
 ?Mathematical formulae have been encoded as MathML and are displayed in this HTML version using MathJax in order to improve their display. Uncheck the box to turn MathJax off. This feature requires Javascript. Click on a formula to zoom.
ABSTRACT
The objective of this study is to provide a base for preservation of historic building, since weighting indicators is a foundation for value evaluation of historic building. A methodology of weighting indicators for the value assessment of historic building is proposed. The proposed methodology contains three methods. Method 1 assigns weights for indicators combining group analytical hierarchy process (AHP) with experts’ average priorities. Method 2 assigns weights for indicators combining group AHP with experts’ priorities by iterative clustering analysis. Method 3 assigns weights for indicators combining group AHP with experts’ priorities by sequential clustering analysis. A frame containing 5 categories and 18 indicators is constructed for value assessment of historic building in Hangzhou city of China. The proposed three methods are used to weight these indicators. The main conclusions are drawn as: 1) the proposed methodology is effective to weight indicators by expert group decision; 2) method 2 and method 3 are capable of selection of individual experts with extremal preference and assigning less priorities for them, which assist in reduction of impact of them on weighting indicators; 3) method 3 optimizes method 2 by elimination of the risk of non-convergence caused by unconvincing iterative termination; and 4) method 3 improves method 2 by reducing the heavy workload of iterative clustering.
1. Introduction
Historic building is precious architectural heritage for a city even for the world. In Chinese context, historic building is defined in “Code of conservation planning for historic cities” GB 50357–2005 as: a building or a structure that has historic and scientific as well as artistic value, reflects the historic townscape of a city and the local features Mohurd (Citation2005). ”Regulation of conservation for historic area and historic building in Hangzhou city” defines historic building as well, historic building is certified by local authority, historic building is not currently officially certified as conserved monument or site, historic building must meet at least one of the following five requirements: 1) The building has artistic and scientific value at the shape, the structure, the material, the construction technology and the engineering technology; 2) The building reflects the townscape and the local features of Hangzhou city; 3) The building is a typical of workshop, storefront, factory, or warehouse throughout history of Hangzhou city; 4) The building is relevant to a significant historic event, or a revolutionary act, or a historic personage; and 5) The building has historic and cultural value, which is not described in above four requirements Hmg (Citation2013).
A historic building is in great value in many fields. It is self-evidential that a historic building has historic and scientific as well as artistic value. Besides, a historic building has environmental value to the local townscape, or cultural value for the local inhabitants. The practical value of a historic building involves while considering the practical utilization or renovation of the building. A historic building is possibly in value in other field. The conservation of a historic building is on the basis of the value assessment of the building. The value assessment provide significant reference for labelling or grading a historic building. The conservation requirement level of historic building is lower than officially certified conserved monuments and sites, however, higher than general buildings (Zhu and Yang Citation2010).
The integrated value assessment of historic building is a challenging issue since value of historic buildings varies in fields greatly. For an instance, a historic building has convincing historic value, whereas it has insufficient artistic value. Each field is denoted by couple indicators to further operation of value assessment of historic building. The integrated value assessment of historic building generally contains a frame of indicators. Identifying indicators plays the first key role in value assessment of historic building. The weights of an indicator imply the importance of the indicator in value assessment of historic building. Assigning weights for indicators plays the second key role in value assessment of historic buildings. A frame of indicators, which have been assigned quantitative weight, is the scientific foundation for integrated value evaluation of historic buildings (Zhu and Jiang Citation1996; Philokyprou and Limbouri-Kozakou Citation2014). Indicators, which have been assigned quantitative weights, are essential for Integrated Value Model for Sustainable Assessment (MIVES), which could be further used in value assessment in historic building. MIVES is a worked and effective methodology for value assessment successfully used in different fields (Oriol and Antonio (Citation2012)).
Weighting indicators should be investigated deliberately and accurately since weights of indicators have major impact on the result of value assessment of a historic building. It is essential that robust and holistic methods are used in weighting indicators in value assessment of historic building. This paper is to demonstrate a methodology for weighting indicators of value assessment of historic building. The objective of this study is to provide a foundation for assessment and preservation of historic building. Many methods were used to assign weights for indicators of value assessment of historic building in the literature review. These used methods are classified into two categories in this paper: subjective weighting methods and objective weighting methods.
Category of subjective weighting methods is based on experts’ judgment on the importance of indicators directly. Analytical hierarchy process (AHP) is a subjective widely used weighting method (Saaty (Citation1990)). AHP was used to assign the relative importance of branch for grading the rehabilitation of heritage sites Ignacio (Pinero et al. (Citation2017)). AHP was chosen to assign priorities to indicators of preservation of historic buildings (Kutut, Zavadskas, and Lazauskas (Citation2014)). AHP was applied to determine relative significance of quantitative and qualitative criteria in upgrading the old vernacular building to contemporary norms (Šiožinytė, Antuchevičienė, and Kutut (Citation2014)). Delphi method and AHP were used to allocate quantitative weights for indicators in evaluation and protection of historic towns in southwestern China (Zhou, Huang, and Wang (Citation2011)). AHP was used to determine quantitative weights of indicator in historic area evaluation (Shi and Liu Citation2008). AHP was adopted to allocate quantitative weights for indicators of evaluation in historic and cultural villages (Zhao et al. (Citation2008)). Binary comparative ranking method was adopted to weight indicators of historic sites evaluation (Liang, Da, and Zhu (Citation2002)).
Category of objective weighting methods is based on evaluation results of case historic buildings, and weights of indicators are extracted from the statistical pattern of evaluation results. Structural equation modelling (SEM) was used to determine weights distribution for indicators of historic building evaluation (Tong and Liu Citation2008; Ding, Shang, and Liu Citation2012). Orthogonal design theory was used to weight indicators of historic building evaluation (Lai, Wang, and Luo (Citation2006)). The radar chart method and the entropy value method were used to assign weights to indicators of value evaluation in architectural heritage (Zhang and Wang Citation2017). Subjective weighting method and objective weighting method were combined, and AHP and entropy value method were used to weight indicators of historical value assessment of modern architectural heritages (Song and Yang Citation2013).
Category of subjective weighting methods and objective weighting methods has advantage and disadvantage, respectively. Subjective weighting methods have advantage of reaping knowledge of experts for weighting indicators directly, whereas they have disadvantage of potential negative impact of individual experts with extremal preference. Objective weighting methods have advantage of reaping statistical data pattern of case historic buildings assessment for weighting indicators, whereas they have disadvantage of insufficient case historic buildings assessment data in general situation and unconvincing selection of case buildings.
A methodology of weighting indicators for value assessment of historic building is proposed in this paper. The proposed methodology is capable of remaining the advantage of making full use of the knowledge of experts directly, whereas it is capable of reducing the negative impact of individual experts with extremal preference by assigning less priorities for them. The methodology is based on group AHP and assigning experts with different priorities. The proposed methodology contains three methods. The three proposed methods are demonstrated in section 2. The methodology is used to weight indicators of value assessment of historic building in Hangzhou city of China, and the implementation is illustrated in section 3. Section 4 shows the effectiveness analysis and the comparison of proposed methods. Section 5 is the conclusion of this study.
2. Methodology for weighting indicators of value assessment of historic building
The AHP method is an approach to solving multi-criteria decision-making problems of choice and prioritization (Aczel and Saaty Citation1983). It is proved that the geometric mean is the appropriate rule to combine individual judgments to a group judgment in deterministic approach of AHP in small group, since it preserves the reciprocal property of the judgment matrix (Saaty (Citation1993)). Group AHP achieves the positive effect of group decision and avoids the negative effect of group decision (Yang, Li, and Yao (Citation2010)).
Experts’ priorities play important role in group AHP, since it can compensate for the negative impact of individual experts with extremal preference. The average priorities of experts are widely used in weighting indicators. The equal priorities of experts are brief arrangements; however, the quality of judgment of individual expert is totally ignored in weighting indicators.
Iterative clustering analysis identifies and assigns less priorities for experts with extremal preference, which improve the group decision quality by reduction of the potential negative impact. However the iterative clustering analysis has shortages of complex iterative steps and the risk of nonconvergence caused by the unconvincing termination condition of iterative clustering (Yang, Tai, and Shi Citation2012; Gao, Luo, and Ying Citation2009).
Experts are assigned priorities by sequential clustering analysis, which shares the rule of “the minority is subordinate to the majority” with iterative clustering analysis (Yang (Citation2017)). Sequential clustering analysis is capable of identifying and assigning less priorities for experts with extremal preference; therefore, it also improves the group decision quality by reduction of the potential negative impact of extremal preference of individual experts. As results, the sequential clustering analysis overcomes the shortages of iterative clustering analysis. First, the sequential clustering analysis is lower calculation load than iterative clustering analysis, since the number of sequential analysis steps is finite and the process of sequential analysis is simpler than iterative clustering analysis. Second, the sequential clustering analysis eliminates the risk of nonconvergence caused by the unconvincing iterative termination condition.
2.1. Method 1: weighting method of combining group AHP with experts’ average priorities
The implementation of method 1 consists of 6 main steps.
Step 1. Identification of indicators for value assessment of historic building, it assumes that the number of indicators identified is n.
Step 2. A panel of experts in historic building is organized to weight indicators, it assumes that there are m experts on the panel in total, individual expert on the panel is labelled randomly as P1,P2, … Pm.
Step 3. A questionnaire survey is carried out in the panel to collect the judgment of individual experts for weighting indicators based on AHP.
Step 4. Comparison matrix of individual expert is constructed based on AHP.
Comparison matrix of individual expert Pe is noted by Ae (e = 1,2, …, m), aeij is the relative importance while pairwise comparison of indicator i and indicator j based on the judgment of expert Pe, i = 1,2, … n; j = 1,2, … n; e = 1,2, …, m; ajie = 1/ aije.
Nine absolute numbers are references for the values of aeij listed in : The numerical values and the corresponding dominant intensities in pairwise comparison judgments in AHP (Saaty (Citation2006)).
Table 1. The numerical values and the corresponding dominant intensities in pairwise comparison judgments.
Consistency estimation guarantees the effectiveness of a comparison matrix constructed. The implementation of the consistency estimation is demonstrated as follows: 1) Calculating the Consistency Index (C.I.), , λmax is the maximum eigenvalue of the comparison matrix; 2) Identifying the Random Index (R.I.), R.I. references to ; 3) Calculating the Consistency Ratio (C.R.),
; and 4) The benchmark of C.R is 0.1, and the value of C.R. of an effective comparison matrix must not exceed 0.1. Otherwise, the comparison matrix must be reconstructed by communication with the individual expert.
Table 2. Random Index (R.I.) of consistency estimation according to matrix size covering this study.
Step 5: It assumes that each expert on the panel has equal priorities.
Step 6: Aa is the comparison matrix of group decision by assigning experts’ priorities averagely. Comparison matrices of individual experts are synthesized to Aa by geometric mean listed in EquationEquation (1)(1)
(1) .
Calculation of the vector Va(va1,va2, …, van) relating to the maximum eigenvalue of Aa. Va implies the weights of indicators by the group decision based on combining group AHP with experts’ average priorities. Ua(ua1,ua2, …, uan) () is the normalization weights of indicators derived from Va, Ua is calculated by
.
2.2. Method 2: weighting method of combining group AHP with experts’ priorities by iterative clustering analysis
The implementation of method 2 consists of 12 main steps.
Step 1. Identification of indicators for value assessment of historic building, it assumes the number of indicators identified is n.
Step 2. A panel of experts in historic building is organized to weight indicators, it assumes that there are m experts on the panel in total, individual expert on the panel is labelled randomly as P1,P2, … Pm.
Step 3. A questionnaire survey is carried out in the panel to collect the judgment of individual experts for weighting indicators based on AHP.
Step 4. The calculation of the normalization weights of indicators based on the construction of comparison matrices of individual expert.
Comparison matrix of individual expert Pe is noted by Ae (e = 1,2, …, m), aeij is the relative importance while pairwise comparison of indicator i and indicator j based on the judgment of expert Pe.
The value of aeij is in reference to nine absolute numbers listed in ; i =1,2, … n; j =1,2, … n; e= 1,2, …, m;ajie =1/ aije.
The implementation of the consistency estimation for Ae is demonstrated as follows: 1) Calculating the Consistency Index (C.I.), , λmax is the maximum eigenvalue of Ae; 2) Identifying the Random Index (R.I.), R.I. is in reference to ; 3) Calculating the Consistency Ratio (C.R.),
; and 4) The value of C.R. of Ae must not exceed 0.1.
Calculation of the vector Ve(ve1,ve2, …, ven) relating to the maximum eigenvalue of Ae. Ve implies the weights of indicators by the individual expert Pe. Ue(ue1,ue2, …, uen) () is the normalization weights of indicators derived from Ve, Ue is calculated by
.
Step 5. Cosine matrix D is calculated, dij indicates the gap between expert Pi and expert Pj on weighting indicators, i = 1,2, …, m, j = 1,2, …, m, dij is calculated by EquationEquation (2)(2)
(2) , the greater value of dij means the closer distance between expert Pi and expert Pj on the judgment of weighting indicators.
Step 6. Each individual expert is regarded as a group. i.e. G1 = {P1}, G2 = {P2}, …, Gm = {Pm}, integer variable q is introduced and q = m, which is the start of the iterative clustering process;
Step 7. It supposes that dxy is the maximum of dij, i = 1,2, …, q, j = (1,2, …, q), then group Gx and group Gy are united to a new group Gq+1, i.e. G q+1 = {Gx, Gy}.
Step 8. If q = 2(m-1) or the value of dxy meets the termination condition of iterative clustering, then go to step 10, else go to step 9.
Step 9. Gx and Gy are taken out from groups, G q+1 is added into groups for further clustering analysis, , q = q + 1, then go to step 7.
Step 10. Drawing the iterative clustering process, final expert groups are output.
Step 11. Assigning priorities for experts in term of the output of expert groups.
It supposes that m experts are divided into g groups. It supposes that there are ψj experts in Group j. λj is the priorities of Group j, calculated by EquationEquation (3)(3)
(3) , λj is assigned to each expert in this group averagely. It assumes that the normalization priorities of experts Pe is we,
,e = 1,2, …, m., .
Step 12. Ab is the comparison matrix of group decision by assigning experts’ priorities based on iterative clustering analysis. Comparison matrices of individual expert are synthesized to by the EquationEquation (4)
(4)
(4) .
Calculation of the vector Vb(vb1,vb2, …, vbn) relating to the maximum eigenvalue of Ab. Vb implies the weights of indicators by the group decision based on combining AHP with experts’ priorities by the iterative clustering analysis. Ub(ub1,ub2, …, ubn) is the normalization weights derived from Vb .Ub is calculated by
2.3. Method 3: weighting method of combining group AHP with experts’ priorities by sequential clustering analysis
The implementation of method 3 consists of 10 main steps.
Step 1. Identification of indicators for value assessment of historic building, it assumes the number of indicators identified is n.
Step 2. A panel of experts in historic building is organized to weight indicators, it assumes that there are m experts on the panel in total, individual expert on the panel is labelled randomly as P1,P2, … Pm.
Step 3. A questionnaire survey is carried out in the panel to collect the judgment of experts for weighting indicators based on AHP.
Step 4. The calculation of the normalization weights of indicators based on the construction of comparison matrices by individual expert.
Comparison matrix of individual expert Pe is noted by Ae (e = 1,2, …, m), aeij is the relative importance while pairwise comparison of indicator i and indicator j based on the judgment of expert Pe.
The value of aeij, i = 1,2, … n; j = 1,2, … n; e = 1,2, …, m; ajie = 1/ aije, is in reference to .
The implementation of the consistency estimation for Ae, demonstrated as follows: 1) Calculating the Consistency Index (C.I.), , λmax is the maximum eigenvalue of Ae; 2) Identifying the Random Index (R.I.), R.I. is in reference to ; 3) Calculating the Consistency Ratio (C.R.),
; and 4) The value of C.R of Ae must not exceed 0.1.
Calculation of the vector Ve(ve1,ve2, …, ven) relating to the maximum eigenvalue of Ae. Ve implies the weights of indicators by the individual expert Pe. Ue(ue1,ue2, …, uen) () is the normalization weights derived from Ve. Ue is calculated by
.
Step 5: It assumes that each expert on the panel has equal priorities.
Step 6: Aa is comparison matrix of group decision by assigning experts’ priorities averagely. Aa is calculated by EquationEquation (1)(1)
(1) , individual comparison matrices are synthesized to Aa by geometric mean.
Calculation of the vector Va(va1,va2, …, van) relating to the maximum eigenvalue of Aa.Ua(ua1,ua2, …, uan) () is the normalization weights of indicators by the group decision based on combining group AHP with experts’ average priorities, Ua is calculated from Va by
.
Step 7. Cosine vector D(d1a,d2a, …, dma) is calculated, dea e = 1,2, …, m, indicates the gap between expert Pi and the expert group by assigning experts’ priorities averagely on weighting indicator, dea is calculated by EquationEquation (5)(5)
(5) . The greater value of dea means the closer distance between expert Pe and expert group, i.e. the possibility of expert Pe with extremal preference is smaller.
Step 8. Each expert is assigned a sequential number noted by ye(e = 1,2, … m) in term of dea. expert with greater dea is assigned greater ye, the maximum value of ye is m, the next is m−1, and so forth, the minimum value of ye is 1.
Step 9. The normalization priorities of expert Pe is noted by βe, e = 1,2, …, m,. Βe is calculated by βe =
in term of ye.
Step 10. Ac is the comparison matrix of group decision by assigning experts’ priorities based on sequential clustering analysis. Comparison matrices of individual judgment are synthesized to by EquationEquation (6)
(6)
(6) .
Calculation of the vector Vc(vc1,vc2, …, vcn) relating to the maximum eigenvalue of Ac. Uc(uc1,uc2, …, ucn) is the normalization weights of indicators by the group judgment based on combining group AHP with experts’ priorities with sequential clustering analysis. Uc is calculated by ,
in term of Vc.
3. Weighting indicators of value assessment for historic building in Hangzhou city
3.1. Frame of indicators of value evaluation for historic building in Hangzhou city
Hangzhou is the capital city of Zhejiang province of China. Hangzhou city is abundant in history and historic buildings, 336 buildings have been officially certified as historic buildings up to the date of this paper, many buildings have the potential to be certified as historic buildings. Step 1 of method 1, method 2, and method 3 is to identify indicators of value assessment for historic building. A frame of indicators of value assessment for historic building in Hangzhou city is constructed in . The frame consists of 5 categories and 18 indicators.
Table 3. Frame of indicators for value assessment of historic building in Hangzhou city China.
The frame is proposed on the following three bases: 1) Analysis of historic buildings officially listed in Hangzhou city; 2) Literature review (Provinsa et al. Citation2008; Yuceer and Ipekoglu Citation2012; Ipekoglu Citation2006; Dutta and Husain Citation2009; Kim et al. (Citation2010); Wang et al. (Citation2015); Chen et al. (Citation2015); Zhu and Hong Citation2011); and 3) A couple of workshops are organized to collect experts’ comments on a draft frame of indicators of value assessment for historic building in Hangzhou.
The construction of frame of indicators follows the principles: 1) The indicators frame should cover the comprehensive value of historic building in Hangzhou city; 2) The indicators frame should have practicality, i.e. it is practicable to find out sufficient or convincing reference for each indicator while assessing the value of a historic building; 3) The contents of indicators are independent of each other; and 4) Each indicator follows an explanation which identify the contents of the indicator accurately;
3.2. Questionnaire survey of weighting indicators of value assessment for historic building in Hangzhou
The implementation of step 2 and step 3 of method 1, method 2, and method 3 are illustrated in this section. In AHP, the relative importance of pairwise comparison between two indicators is noted by aeij, the value of aeij is referenced to . shows that the descriptions of dominant intensities are similar in text. In this study, graphic and text description are combined to the questionnaire design, in order to assist experts to select the accurate value for aeij. is an example part of the questionnaire.
Figure 1. An example part of questionnaire.
63 filled questionnaires are received, 45 filled questionnaires are effective, and 8 filled questionnaires are abandoned because of consistency estimation failure. Of the 45 experts with effective filled questionnaires, 18 experts are engaged in historic building research, 12 experts are engaged in historic building industry, 15 experts are from the local authority of historic building management. Of the 45 experts with effective filled questionnaires, 6 experts have professional experience in range of 3–5 years, 15 experts have professional experience in range of 6–10 years, 10 experts have professional experience in range of 11–15 years, 12 experts have professional experience in range of 16–20 years, and 2 experts have professional experience more than 20 years. The employer of each expert is currently located in the Zhejiang province or the neighbour Jiangsu province.
3.3. Weighting indicators of value assessment for Hangzhou historic building using method 1
The implementation of method 1 begins with step 4 in this section. For each individual expert judgment, 1 comparison matrix of categories is constructed, and 5 comparison matrices of indicators are, respectively, constructed according each category. For individual expert Pe, comparison matrix of category is noted by Ae0 (e = 1,2, …, 45), comparison matrix of indicators of category of “A. Historic value” is noted by Ae1 (e = 1,2, …, 45), comparison matrix of indicators of category of “B. Cultural & Artistic value” is noted by Ae2 (e = 1,2, …, 45), comparison matrix of indicators of category of “C. Scientific value” is noted by Ae3 (e = 1,2, …, 45), comparison matrix of indicators of category of “D. Environmental value” is noted by Ae4 (e = 1,2, …, 45), comparison matrix of indicators of category of “E. Practical value” is noted by Ae5 (e = 1,2, …, 45). Comparison matrices of expert P1 are listed in for an example. The consistency estimation of each comparison matrix of each individual expert is satisfying. The C.R. of the comparison matrices of expert P1 are listed in for an example, the consistency estimation guarantees the effectiveness of the comparison matrices of expert P1.
Figure 2. Comparison matrices of individual expert P1.
Figure 3. Consistent estimation of the comparison matrices of individual expert P1.
The step 5 of method 1 is to assign each expert with equal priorities. The step 6 starts with the construction of comparison matrices of group decision. The comparison matrix of group decision of categories is noted by Aa0, the comparison matrix of group decision of indicators of category of “A. Historic value” is noted by Aa1, the comparison matrix of group decision of indicators of category of “B. Cultural & Artistic value” is noted by Aa2, the comparison matrix of group decision of indicators of category of “C. Scientific value” is noted by Aa3, the comparison matrix of group decision of indicators of category of “D. Environmental value” is noted by Aa4, the comparison matrix of group decision of indicators of category of “E. Practical value” is noted by Aa5. Aa0, Aa1, Aa2, Aa3, Aa4, and Aa5 are calculated by EquationEquation (1)(1)
(1) . Aa0, Aa1, Aa2, Aa3, Aa4, and Aa5 are listed in . The consistent estimation of the comparison matrices of group decision by assigning experts’ priorities averagely are listed in , the consistency estimation confirms the convincing effectiveness of these comparison matrices.
Figure 4. The comparison matrices of group decision by assigning experts’ priorities averagely.
Figure 5. Consistent estimation of comparison matrices of group decision by assigning experts’ priorities averagely.
Calculation of the vector Va0(va1°,va2°, …, va5°) relating to the maximum eigenvalue of Aa0, the vector Va1(va11,va21, …, va41) relating to the maximum eigenvalue of Aa1, the vector Va2(va12,va22, …, va42) relating to the maximum eigenvalue of Aa2, the vector Va3(va13,va23, …, va43) relating to the maximum eigenvalue of Aa3, and the vector Va4(va14,va24,va34) relating to the maximum eigenvalue of Aa4, the vector Va5(va15,va25,va35) relating to the maximum eigenvalue of Aa5. The Va0 implies the weights of categories of group decision with assigning experts’ priorities averagely, and each value of element of Va0 is assigned to its indicators according to the value of element of Va1, Va2, Va3, Va4 and Va5.The normalization weights of indicators Ua by Method 1 are worked out,=1.000, listed in .
Table 4. Normalization weights of indicators by method 1 (Ua).
3.4. Weighting indicators of value assessment for Hangzhou historic building by method 2
The implementation of Method 2 begins with step 4 in this section. For each individual expert judgment, calculation of the vector Ve0(ve1°,ve2°, …, ve5°) relating to the maximum eigenvalue of Ae0, the vector Ve1(ve11,ve21, …, ve41) relating to the maximum eigenvalue of Ae1, the vector Ve2(ve12,ve22, …, ve42) relating to the maximum eigenvalue of Ae2, the vector Ve3(ve13,ve23, …, ve43) relating to the maximum eigenvalue of Ae3, the vector Ve4(ve14,ve24,ve34) relating to the maximum eigenvalue of Ae4, the vector Ve5(ve15,ve25,ve35) relating to the maximum eigenvalue of Ae5. The Ve0 implies the weights of categories by individual expert Pe, The value of each element of Ve0 is assigned to its indicators according to value of elements of Ve1, Ve2, Ve3, Ve4 and Ve5. The normalization weights of indicators Ue(ue1,ue2, …, ue18) (e = 1,2, …, 45) are calculated out,=1.000.
Step 5 of method 2 is to calculate the cosine matrix D, dij (i = 1,2, …, 45, j = 1,2, …, 45) by EquationEquation (2)(2)
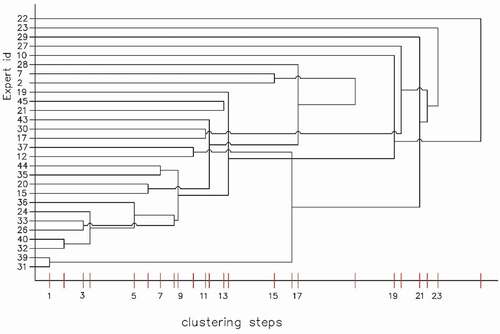
(2) . The iterative clustering process covers the implementation of step 6, step 7, step 8, step 9, step 10 and step 11. 24 iterative clustering steps are illustrated in , and the dxy according to the 24 steps is listed in . The iterative clustering terminates at d(68,22) = 0.9111. In term of the iterative clustering process, these 45 experts are divided into 21 groups as: Group 1 = {P31,P39,P12,P37,P29,P17,P30,P27,P23}, Group 2 = {P32,P40,P24,P36,P26,P33,P35,P44,P19,P10,P22}, Group 3 = {P15,P20,P43,P28,P2,P7}, Group 4 = {P21,P45}, Group 5 = {P1}, Group 6 = {P3}, Group 7 = {P4}, Group 8 = {P5}, Group 9 = {P6}, Group 10 = {P8}, Group 11 = {P9}, Group 12 = {P11}, Group 13 = {P13}, Group 14 = {P14}, Group 15 = {P16}, Group 16 = {P18}, Group 17 = {P25}, Group 18 = {P34}, Group 19 = {P38}, Group 20 = {P41}, Group 21 = {P42}. Normalization priorities of experts we(e = 1,2, …, 45),
by iterative clustering analysis are listed in .
Table 5. The dxy according to the iterative clustering steps.
Table 6. Normalization priorities of experts by iterative clustering analysis.
Figure 6. The iterative clustering process.
The implementation of step 12 begins with the construction of the comparison matrices of group decision by assigning experts’ priorities based on iterative clustering analysis. The comparison matrix of group decision of categories is noted by Ab0, the comparison matrix of group decision of indicators of category of “A. Historic value” is noted by Ab1, the comparison matrix of group decision of indicators of category of “B. Cultural & Artistic value” is noted by Ab2, the comparison matrix of group decision of indicators of category of “C. Scientific value” is noted by Ab3, the comparison matrix of group decision of indicators of category of “D. Environmental value” is noted by Ab4, the comparison matrix of group decision of indicators of category of “E. Practical value” is noted by Ab5. Ab0, Ab1, Ab2, Ab3, Ab4, and Ab5 are calculated by EquationEquation (4)(4)
(4) , as listed in . The consistent estimation of the comparison matrices of group decision by assigning experts’ priorities based on iterative clustering analysis are listed in , the consistency estimation confirms the effectiveness of these comparison matrices.
Figure 7. The group comparison matrices by assigning experts’ priorities based on iterative clustering analysis.
Figure 8. Consistent estimation of comparison matrices of group decision by assigning experts’ priorities based on iterative clustering analysis.
Calculation of the vector Vb0(vb1°,vb2°, …, vb5°) relating to the maximum eigenvalue of Ab0, the vector Vb1(vb11,vb21, …, vb41) relating to the maximum eigenvalue of Ab1, the vector Vb2(vb12,vb22, …, vb42) relating to the maximum eigenvalue of Ab2, the vector Vb3(vb13,vb23, …, vb43) relating to the maximum eigenvalue of Ab3, the vector Vb4(vb14,vb24,vab4) relating to the maximum eigenvalue of Ab4, and the vector Vb5(vb15,vb25,vb35) relating to the maximum eigenvalue of Ab5. The Vb0 implies the weights of categories by group decision with assigning experts’ priorities based on iterative clustering analysis, and the value of each element of Vb0 is assigned to its indicators according to value of the elements of Vb1, Vb2, Vb3, Vb4 and Vb5 .The normalization weights of indicators Ub using method 2 are worked out,=1.000, as listed in .
Table 7. Normalization weights of indicators by method 2 (Ub).
3.5. Weighting indicators of value assessment for Hangzhou historic building by method 3
The implementation of step 4, step 5, as well as step 6 of Method 3 are similar with method 2; therefore, the description of the implementation of method 3 begins with step 7 in this section. Cosine vector D is calculated, and dea (e = 1,2, …, 45) is calculated by EquationEquation (5)(5)
(5) . The implementation of step 8 is to assign each expert with a sequential number noted by ye(e = 1,2, … 45) in term of dea. ye(e = 1,2, … 45) are listed in . The implementation of step 9 is to assign each expert with the normalization priorities βe, calculated by βe =
, βe(e = 1,2, …, 45),
, listed in .
Table 8. Sequential number of experts (ye).
The implementation of step 10 starts with the construction of the comparison matrices of group decision by assigning experts’ priorities based on sequential clustering analysis. The comparison matrix of group decision of categories is noted by Ac0, the comparison matrix of group decision of indicators of category of “A. Historic value” is noted by Ac1, the comparison matrix of group decision of indicators of category of “B. Cultural & Artistic value” is noted by Ac2, the comparison matrix of group decision of indicators of category of “C. Scientific value” is noted by Ac3, the comparison matrix of group decision of indicators of category of “D. Environmental value” is noted by Ac4, the comparison matrix of group decision of indicators of category of “E. Practical value” is noted by Ac5. Ac0, Ac1, Ac2, Ac3, Ac4, and Ac5 are calculated by EquationEquation (6)(6)
(6) and listed in . The consistent estimation of the comparison matrices of group decision by assigning experts’ priorities based on sequential analysis are listed in , the consistency estimation confirms the effectiveness of these comparison matrices completely.
Figure 9. The group comparison matrices by assigning experts’ priorities based on sequential analysis.
Figure 10. Consistent estimation of comparison matrices of group decision by assigning experts’ priorities based on sequential analysis.
Calculation of the vector Vc0(vc1°,vc2°, …, vc5°) relating to the maximum eigenvalue of Ac0, the vector Vc1(vc11,vc21, …, vc41) relating to the maximum eigenvalue of Ac1, the vector Vc2(vc12,vc22, …, vc42) relating to the maximum eigenvalue of Ac2, the vector Vc3(vc13,vc23, …, vc43) relating to the maximum eigenvalue of Ac3, the vector Vc4(vc14,vc24,vc4) relating to the maximum eigenvalue of Ac4, and the vector Vc5(vc15,vc25,vc35) relating to the maximum eigenvalue of Ac5. The Vc0 implies the weights of categories by group decision with assigning experts’ priorities based on sequential clustering analysis, and the value of each element of Vc0 is assigned to its indicators according to the value of elements of Vc1, Vc2, Vc3, Vc4 and Vc5 .The normalization weights of indicators using method 3(Uc) are worked out,=1.000, listed in .
Table 9. Normalization priorities of experts by sequential analysis (βe).
Table 10. Normalization weights of indicators by method 3 (Uc).
4. The effectiveness analysis and comparison of methods proposed
Weights of indicators of value assessment for Hangzhou historic building vary greatly from expert to expert; P1 and P22 are two samples of individual experts. Normalization weights of indicators of value assessment for Hangzhou historic building by expert P1 and expert P22 are, respectively, listed in . show the great difference between expert P1 and expert P22 on weighting indicators.
Figure 11. Normalization weights of indicators by expert P1.
Figure 12. Normalization weights of indicators by expert P22.
Normalization weights of indicators of value assessment of Hangzhou historic building by method 1 and method 2 as well as method 3 are, respectively, listed in , , and . The consistency of weights among method 1, method 2, as well as method 3 is obvious. It is self-evident that the proposed methodology provides a solution to synthesize individual judgment to group decision for weighting indicators of value assessment in historic building. Comprehensive knowledge of all experts are integrated in weighting indicators rather than individual expert. Therefore weights of indicators by the proposed methodology are more convincing than any individual expert. The effectiveness of proposed methodology is validated by .
Figure 13. Normalization weights of indicators by method 1.
Figure 14. Normalization weights of indicators by method 2.
Figure 15. Normalization weights of indicators by method 3.
Compared with method 1, both of method 2 and method 3 have the capability to select individual experts with extremal preference, and assign less priorities for them. In the weighting process in Hangzhou historic building, 17 experts with the minimum priorities are found out by method 2, 17 experts with the lowest priorities are found out by method 3, 9 experts (P1,P9,P8,P4,P5,P11,P42,P14,P18) are identified as the extremal preference by both of method 2 and method 3, which are listed in . The priorities of these 9 experts with extremal preference are listed in .
Figure 16. The identification of experts with extremal preference by method 2 and method 3.
Figure 17. The priorities of 9 experts with extremal preference identified by method 2 and method 3.
Method 3 assigns exclusive priorities for each expert, whereas method 2 assign some experts with the equal priorities. In method 2, experts in a group is assigned with equal priorities, experts in different groups are assigned with equal priorities while the number of expert in different groups is equal. For instance, shows that these 9 experts have exclusive priorities by method 3, whereas these 9 experts have equal priorities because each of these 9 experts forms a group respectively in method 2. Therefore, method 3 provides more detailed reference for assigning experts’ priorities.
The assigning experts’ priorities by method 2 is weak in the risk of nonconvergence caused by the unconvincing iterative termination condition. The iterative termination condition of the clustering process has great impact on the priorities of some experts. For an instance, the priorities of expert P22 is 0.0425, while the iterative clustering process in Hangzhou historic building terminates at the 24th step. While the iterative clustering process in Hangzhou historic building terminates backward a step (at the 23rd step), the expert of P22 will be removed from the Group 2, the priorities of expert P22 will be 0.0039. The instance shows that the unconvincing iterative termination condition of method 2 leads to the uncertainty of the priorities of some experts. Compared with method 2, the experts’ priorities by method 3 is stable.
5. Conclusion
Historic buildings have precious value in many fields such as history, science, art, environment, culture, practical utilization, etc. The significance of preservation of historic buildings is not only for the local area but also for the civilization of human being. The value assessment of historic buildings is the foundation for preservation of historic buildings. The value assessment provides foundational reference for operation of historic building such as labelling, grading, legislation, and renovation. It is clear that a historic building has varying value in fields. Therefore, the value in each field should be integrated deliberately. The weights of indicators are the foundation for integrating value in each field into a comprehensive value for a historic building. Therefore, assigning weights for indicators is significant for value assessment of historic building. Weights should be assigned for indicators of value assessment of historic building robustly and accurately. This study provide a solid base for weighting indicators of value assessment of historic building. This research is summarized as follows:
1) This study proposes a methodology for weighting indicators of value assessment of historic building. The proposed methodology contains three methods. Method 1 assigns weights for indicators of value assessment combining group AHP with experts’ average priorities. Method 2 assigns weights for indicators of value assessment combining group AHP with experts’ priorities by iterative clustering analysis. Method 3 assigns weights for indicators of value assessment combining group AHP with experts’ priorities by sequential clustering analysis. The proposed methodology aims to make full use of experts’ professional knowledge while reducing impacts of experts with extremal preference.
2) Value assessment of historic building in Hangzhou city of China is investigated, a frame including 5 categories and 18 indicators is constructed. A questionnaire survey is carried out in a panel of experts for weighting indicators of value assessment of historic building in Hangzhou. The proposed three weighting methods are used to weight indicators of value assessment of historic building in Hangzhou city.
3) The effectiveness of the proposed methodology is validated by the consistency of weights of indicators by proposed methods and the comparison of weights of indicators by individual experts and the group decision. The proposed methodology integrates the comprehensive knowledge of experts rather than individual expert.
4) Both of method 2 and method 3 have the capability to select individual experts with extremal preference and assign less priorities to them. Therefore, the weights of indicators are amended since both of method 2 and method 3 reduce the impact of individual experts with extremal preference. The amendment is at the cost of more workload, method 1 has the lowest workload, method 3 has lower workload, and method 2 has the heaviest workload.
5) Method 3 improves method 2 by elimination of the risk of nonconvergence caused by the unconvincing iterative termination condition. The unconvincing iterative termination condition of method 2 leads to the uncertainty of the priorities of experts. Method 3 optimizes method 2 by reduction of heavy workload of iterative clustering process. Method 3 assigns exclusive priorities for each expert, whereas method 2 assign some experts with equal priorities.
Acknowledgments
The authors are grateful for the constructive feedback and thoughtful suggestions from experts in the survey in this study. The authors also appreciate the two anonymous reviewers for their insightful and professional comments which guides to revise this paper to current quality.
Additional information
Funding
References
- Aczel, J., and T. Saaty. 1983. “Procedures for Synthesizing Ratio Judgments.” Journal of Mathematical Psychology 27 (1983): 93–103. doi:10.1016/0022-2496(83)90028-7.
- Chen, L., Y. Xu, and M. Hong. 2015. “A Study of Historical Block Renewal Mode: Empirical Analysis in Hangzhou City.” Huazhong Architecture 2015 (3): 146–151.
- Ding, Q., T. Shang, and T. Liu. 2012. “Summarizing Models for Evaluation of Historical Buildings.” Huazhong Architecture 26 (12): 130–135.
- Dutta, M., and Z. Husain. 2009. “An Application of Multicriteria Decision Making to Built heritage: The Case of Calcutta.” Journal of Cultural Heritage 10 (2): 237–243. doi:10.1016/j.culher.2008.09.007.
- Gao, Y., X. Luo, and H. Ying. 2009. “Research on Method for Deriving Experts’ Weights Based on Judgment Matrix and Cluster Analysis.” System Engineering and Electronics 31 (3): 594–596.
- Hmg(Hangzhou municipal government). 2013. “Regulations of Historic Area and Historic Building Conservation in Hangzhou City.” http://www.hangzhoufz.gov.cn/details/gfwjdetail.aspx?id=1793
- Ipekoglu, B. 2006. “An Architectural Evaluation Method for Conservation of Traditional Dwellings.” Building and Environment 41 (3): 386–394. doi:10.1016/j.buildenv.2005.02.009.
- Kim, C., S. Wi, U. Lee, K. Song, K. Kange, and H. Cho. 2010. “An Experience Curve-based Decision Support Model for Prioritizing Restoration Needs of Cultural Heritage.” Journal of Cultural Heritage 11 (4): 430–437. doi:10.1016/j.culher.2010.03.004.
- Kutut, V., E. Zavadskas, and M. Lazauskas. 2014. “Assessment of Priority Alternatives for Preservation of Historic Buildings Using Model Based on ARAS and AHP Methods.” Archives of Civil and Mechanical Engineering 14 (2): 287–294. doi:10.1016/j.acme.2013.10.007.
- Lai, M., X. Wang, and A. Luo. 2006. “Appraising Method of Comprehensive Value of Historic Buildings Based on Orthogonal Design.” Journal of Huazhong University of Science and technology(Urban Science Edition) 23 (1): 35–38.
- Liang, X., Q. Da, and G. Zhu. 2002. “FCE on the Comprehensive Value of the Architectural Heritage in China.” Journal of Southeast University (Philosophy and Social Science) 4 (2): 44–46.
- Mohurd(Ministry of Housing and Urban-Rural Development of the People’s Republic of China). 2005. Code of Conservation Planning for Historic Cities GB 50357-2005. Beijing: China architecture & building press.
- Oriol, P., and A. Antonio. 2012. “Integrated Value Model for Sustainable Assessment Applied to Technologies Used to Build Schools in Catalonia, Spain.” Building and Environment 53 (2012): 49–58. doi:10.1016/j.buildenv.2012.01.007.
- Philokyprou, M., and E. Limbouri-Kozakou. 2014. “An Overview of the Restoration of Monuments and Listed Buildings in Cyprus from Antiquity until the Twenty-first Century until the Twenty-first Century.” Studies in Conservation 60 (4): 267–277. doi:10.1179/2047058414Y.0000000136.
- Pinero, I., T. San-Jose, P. Rodriguez, and M. Losanez. 2017. “Muli-criteria Decision-making for Grading the Rehabilitation of Heritage Sites: Application in the Historic Center of La Habana.” Journal of Cultural Heritage 26 (2017): 144–152. doi:10.1016/j.culher.2017.01.012.
- Provinsa, A., D. Pearceb, E. Ozdemiroglua, M. Susana, and S. Jones. 2008. “Valuation of the Historic Environment: The scope for Using Economic Valuation Evidence in the Appraisal of Heritage-related Projects.” Progress in Planning 69 (4): 131–175. doi:10.1016/j.progress.2008.01.001.
- Saaty, T. 1990. The Analytical Hierarchy Process: Planning, Priority Setting, Resource Allocation. Pittsburgh: University of Pittsburgh. ISBN: 0070543712.
- Saaty, T. 1993. “Group Decision Making Using the Analytic Hierarchy Process.” Mathl. Compat. Modelling 17 (4): 101–109. doi:10.1016/0895-7177(93)90179-3.
- Saaty, T. 2006. “Rank from Comparisons and from Ratings in the Analytic Hierarchy/network Processes.” European Journal of Operational Research 168 (2): 557–570. doi:10.1016/j.ejor.2004.04.032.
- Shi, R., and M. Liu. 2008. “Applying Fuzzy Comprehensive Evaluation Model to Historical District Conservation Research.” Planners 24 (5): 72–76.
- Šiožinytė, E., J. Antuchevičienė, and V. Kutut. 2014. “Upgrading the Old Vernacular Building to Contemporary Norms: Multiple Criteria Approach.” Journal of Civil Engineering and Management 20 (2): 291–300. doi:10.3846/13923730.2014.904814.
- Song, G., and C. Yang. 2013. “Re-examining on the Value Assessment System of Modern Architectural Heritage.” Architectural Journal 2013 (10): 198–201.
- Tong, Q., and T. Liu. 2008. “Structural Equation Models in Evaluation of Historic Buildings.” Huazhong Architecture 26 (12): 263–266.
- Wang, W., Q. Gong, J. Chen, Y. Shen, and X. Wang. 2015. “Research of Inheritance of Historical Architecture Feature under the Background of Urbanization.” Journal of Urban Studies 36 (1): 84–88.
- Yang, Y. 2017. “Index Weight Distribution Method Based on AHP and Expert Sorting Empowerment.” Certified patent of invention. No.CN201510519017.
- Yang, Y., B. Li, and R. Yao. 2010. “A Method of Identifying and Weighting Indicators of Energy Efficiency Assessment in Chinese Residential Buildings.” Energy Policy 38 (12): 7688–7697. doi:10.1016/j.enpol.2010.08.018.
- Yang, Y., H. Tai, and T. Shi. 2012. “Weighting Indicators of Building Energy Efficiency Assessment Taking Account of Experts’ Priority.” Journal of Central South University 19 (3): 803–808. doi:10.1007/s11771-012-1075-5.
- Yuceer, H., and B. Ipekoglu. 2012. “An Architectural Assessment Method for New Exterior Additions to Historic Buildings.” Journal of Cultural Heritage 13 (4): 419–425. doi:10.1016/j.culher.2011.12.002.
- Zhang, J., and S. Wang. 2017. “Method for Evaluating the Value of Architectural Heritage.” Journal of Harbin Engineering University 38 (10): 1661–1668.
- Zhao, Y., J. Zhang, S. Lu, and Z. Liu. 2008. “The Further Study on the Historic and Cultural Village Assessment Indicators: A Case of the 2nd Round Historic and Cultural Villages.” Architectural Journal 2008 (3): 64–69.
- Zhou, T., Y. Huang, and X. Wang. 2011. “An Analysis of the Conservation Evaluation System of Historic Towns and Villages in Southwest China.” Urban Planning Forum 2011 (6): 109–117.
- Zhu, G., and H. Jiang. 1996. “A Foundation for Development of Density Architectural Heritage Area: Architectural Heritage Assessment.” Planners 1996 (1): 33–38.
- Zhu, G., and L. Yang. 2010. “The Confusions and Thinking for Historic Building Conservation and Management.” Architectural Journal 2010 (2): 8–22.
- Zhu, M., and Y. Hong. 2011. “The Research on the Modern Adaptation Evaluation System for the Historical Building along the Great Canal.” Huazhong Architectural 9 (2011): 209–212.