
 ?Mathematical formulae have been encoded as MathML and are displayed in this HTML version using MathJax in order to improve their display. Uncheck the box to turn MathJax off. This feature requires Javascript. Click on a formula to zoom.
ABSTRACT
This study attempts to interpret the urban form of the Japanese cities through the natural spatial reference of front and back which is deeply rooted in Japanese culture. The aim is to provide workable guidance for interpreting the urban form, and for creating diverse and active commercial spaces in Japan and beyond. Based on the physical built environment, this study proposes a parameter of interface which is defined by components taken from both surface of the building and the objects around. The interface is categorized into four types by the combination of main-component of front (F)/back (B) and sub-component of front (f)/back (b), namely Ff, Fb, Bf, and Bb. The approach is demonstrated in the typical commercial district of Shibuya, Tokyo. By analyzing the distributional features of the interface quantitatively, the scopes and attributes of front and back-side space are figured out. According to the distributional similarity of the interface, we sort the urban space into front-side space defined by Ff and back-side space defined by Fb, Bf, and Bb. Thereinto, the ambiguous back-side space defined by Fb and Bf supports diverse possibilities and highly involves in the everyday life of Japanese people.
1. Introduction
The western-type of space and design is apt to be centripetal, beginning with the whole and then proceeding to its parts, which results in a clear order of the urban structure, especially after the Renaissance (Ashihara Citation1986). The symmetry, frontality, symbolism, and monumentality largely influence the appearance of the buildings and the experience in the urban space. When renewing a certain space, the priority is always given to the form for pursuing compositional balance (Ashihara Citation1986). In contrast, both buildings and cities in Japan start with individual parts and expand by randomly proliferating the parts, resulting in a complex and seemingly chaotic organization (Ashihara Citation1986; Shelton Citation2005), though some regulations have been issued to restrict this kind of proliferation.
Research into the urban form has a long history. Alexander (Citation1987) argued that creating a clear and hierarchical structure system from the core to the periphery is important for designing an intelligible urban space. Maki (Citation2008) claimed that the concept of “center-demarcation” is an obvious characteristic of the civilization, winding roads of medieval European castle towns. However, the theory does not work well on the urban form of Japanese cities, which results in a long period of suspicious and negative stance on Japanese cities in western eyes until the middle of the 20th Century (Shelton Citation2005).
In the 1980s, Ashihara (Citation1986) suggested that there is a “hidden order” behind the visual chaos, which is deeply rooted in Japanese geography, history, and culture. To reveal the “hidden order” and the spatial characters of the Japanese cities, many researchers developed their creative explanations. Bognar (Citation1985) claimed that the Japanese city is created, perceived, and understood as an additive texture of its parts or places and is denoted by the distribution of signs and symbols rather than volumes and monuments. Maki (Citation1988) discussed the collage-like surface in Japan and the ways that infrastructures such as signs and vending machines shape the image of the urban space. Kacha Epe Mansouri et al. (Citation2013) compared the streetscape composition in Algeria and Japan, revealed the positive correlations between visual complexity and streetscape images according to individuals’ cognition. Ohno (Citation2016) claimed that the Japanese city, no matter large or small, tends to resemble an archipelago-like structure with huge blocks and buildings as “island” and the other place nearby as “sea”. Ishigure (Citation2016) reviewed the formation process of the subcenters in Tokyo and analyzed the urban structure in the light of black markets and railway networks.
The natural spatial references are widely adopted to locate oneself and organize the urban space. Different cultures have different priorities on spatial reference frames for urban image organizations (Bognar Citation1985; Lynch Citation1960). Moreover, unlike the concept of space in mathematics, which is homogeneous in all dimensions, the physical space that relates to people’s cognition has no axis of symmetry. Preference and meanings are given to certain dimensions (Bollnow Citation2011), which makes the spatial reference more distinctive and valuable for understanding the urban form under a certain cultural background. Thereinto, the pair of the reference – front and back is of extreme importance in Japanese culture (Maki Citation1988; Berque Citation1994). The influence spreads from the linguistic terms to the way of thinking (Doi Citation1985), let alone recognizing the surrounding environment, acting, and orienting oneself in the space as a critical criterion (Bollnow Citation2011).
In general, “front”, as Omote in Japanese character, is interpreted as the external surface of an uncovered matter or the front (of a house) toward people’s eyes of a matter which has two sides; and “back”, as Ura in Japanese character, is interpreted as the reverse side or the opposite side of front, the inner or hidden part of a matter, or the back street which does not face the front street.Footnote1
However, the studies from this viewpoint in interpreting the urban form are rarely discussed in the research on Japanese cities. Kanazawa (Citation2002) surveyed the downtown area of a local Japanese city. He acquired the distribution of front and back domains through cognitive maps drawn by the citizens and concluded that the domains of front and back fundamentally contrast and complement each other in their distribution patterns. Ohno and Kubo (Citation2005) investigated residents’ perception of front and back domains of the outdoor spaces around their houses in a suburban residential district near Tokyo and explored the relationship between the arrangement of behaviors and the physical environment. Hayami (Citation2010) analyzed the urban structure of the back-side space in Kyoto in the Early Modern Period (about 17–19 Century) by comparing the so-called Ura (back) and Oku (interior) urban blocks in spatial meanings. Aoki, Deguchi, and Nakano (Citation2020) directly focused on Harajuku District, Tokyo which is commonly recognized as the back-side of the city, and clarified the factors during the transforming process from a residential area to a lively mixed-use back-side block from the viewpoints of building use, city planning systems, and community organization.
Most of the previous studies rely on the cognition of individuals or the nomenclature in history to infer the locations of front and back domains. However, what makes a front or back-side space from a physical viewpoint is still unclear, which highly influence the effective in analyzing and manipulating the urban form through this pair of spatial reference. A precise and comprehensive way of interpreting front and back-side space is necessary to be figured out. Meanwhile, unfortunately, the Japanese cities embrace the western-type organization of urban landscape to some extent during the modernization and set emphasis on the frontality (Ashihara Citation1986; Shelton Citation2005), while the back-side space is always ignored spatially and consciously by planners and pedestrians whether in the scale of buildings or urban space during the progress of gentrification. As the place with the inherent experience of the local community and the incubation of various businesses (Aoki, Deguchi, and Nakano Citation2020), the spatial meaning of the back-side space to the Japanese urban fabric is urgent to be emphasized.
This research clarified a quantitative way to define the front and back-side space in the light of the interface and physical components. And then a case study on the commercial district in Tokyo was conducted to demonstrate the organization of the urban form by analyzing the distribution features of front and back-side space. The results presented here can provide workable guidance for interpreting the urban form, and for organizing diverse and active commercial spaces in the Japanese context and beyond.
2. Method
2.1. Study area
Generally, in Western cities, the more continuous front-side space in the commercial district stands for more opportunities for business taking the antagonistic relationship between front and back into consideration. However, in Japanese cities, even the most crowded places like Shibuya have unexpected long blank walls and service parts burst into the streetscape, interrupting the atmosphere of shopping or entertainment. The seemingly irrational situation in Japanese commercial districts provides cases to illustrate the organization of the urban form through the concept of front and back (). Accordingly, the core area of Shibuya Commercial District in Tokyo has been taken as the research site ().
Figure 1. Example of the streetscape in Shibuya.
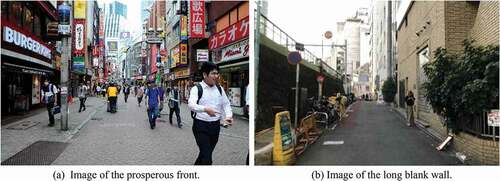
Figure 2. The research site.
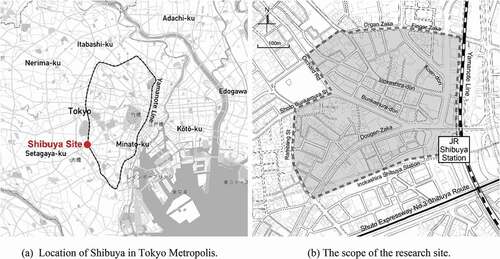
Shibuya is located along the Yamanote Line in the southwest of Tokyo. It is one of the subcenters of the metropolis and gradually becomes the most prosperous shopping district in Tokyo and even the entire territory of Japan after WWII (Ishigure Citation2016). It has an extended and free road system compared to the typical cross-grid ones.
2.2. Parameter of the interface
The definition of front and back is the fundamental issue in this study. In the previous studies, Sudo and Tsuchimoto (Citation2000) made the concept of “back” more specific into “backyard” and “the back sides of town-houses” in their study. Kanazawa (Citation2002) followed common image by letting the citizens draw down the front and back domains in their minds on the map. Similarly, Ohno and Kubo (Citation2005) used the questionnaire to collect the ideas from the residents about their perception of front and back-side space. Hayami (Citation2010) used the definition of “front” as the area that faces the road and “back” as that does not in the blocks. He also related the back-side space with the utilities like rental room and shared toilet. Aoki, Deguchi, and Nakano (Citation2020) adopted the concept of “back” as the backside of main avenues under rapid urban development, and “the back-side space” as the place for small-scale business along the by-pass in the commercial district where once were residences.
While most of the buildings in European countries have clear boundaries toward the streets, dividing inside and outside by solid entities and clarifying their frontality (Ashihara Citation1986; Maki Citation2018), architecture in Japan until the Meiji period (1868–1912), was constructed exclusively by posts and beams (Ashihara Citation1986). The attention was paid to the floor (horizontal entity) rather than the wall (vertical entity) in Japanese tradition. In other words, the attached elements and the shaped scenes are the protagonists in Japanese urban space (Shelton Citation2005), making the reference of front and back not a pair of dualistic classification but an analyzable continuous variable. And the widely existing intermediate states should be taken into consideration(Ohno Citation2010).
Thus, instead of a clear definition separating front and back as a fixed attribute in individuals’ minds, a flexible one based on the physical environment was proposed to make a commonly usable tool for quantitative analysis on the organization of urban form in Japanese cities. Since built structures shape and are shaped by the open space around them (Moudon Citation1997), the concept of “interface” was introduced as the major parameter in this study which focused on the entities between buildings and urban space. Individuals tend to differentiate front and back according to the symbolic values attached to them (Rapoport Citation1977), so by evaluating the interface, the front and back-side space can be recognized.
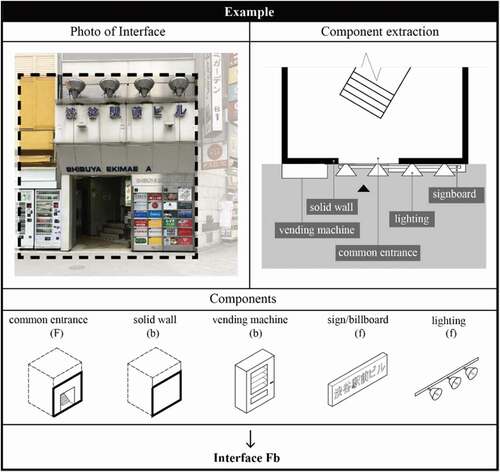
The interface in this research is defined as the assembly of the surface of a building and the objects around it (). They have a significant impact on individuals’ perceptions as well as their behavior in the space. Generally, the objects refer to the equipment and furniture installed on or beside the building. Not all objects belong to the building. The ones added for public use are also included as indispensable and distinctive components of the interface in the urban fabric.
Figure 3. Diagram of the interface.
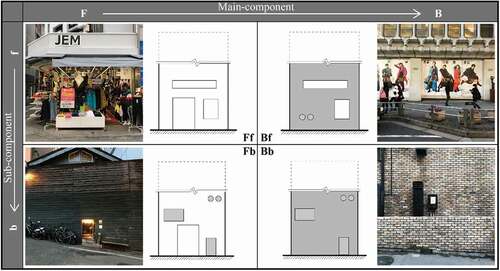
Referring to the previous studies that revealed the urban form and certified the impact on individuals’ impression through extracting physical elements for cluster and semantical analysis in Japan (Neto et al. Citation2016) and beyond (Saito et al. Citation2009; Zhang et al. Citation2020), the components of the interface are extracted and sorted into main-component and sub-component. The former emphasizes the planning of the buildings and the manipulation of the space; the latter emphasizes the appearance and the add-ons. The ones that in favor of the communication with customers responding to the building’s main function are identified as front components (if it belongs to main-component, note as F-component; if it belongs to sub-component, note as f-component); others that serve the operation of the building or the city are considered to be back components (if it belongs to main-component, note as B-component; if it belongs to sub-component, note as b-component). With the different combinations of the main and sub-components, four types of the interface, Ff, Fb, Bf, and Bb are established (). All the components in interface Ff are with front value; interface Fb and Bf have both front and back components; interface Bb only has back components.
Figure 4. The four types of interface.
2.3. Preliminary investigation
A preliminary investigation was carried out to collect available components appearing in the research site during Dec. 2018. Finally, 37 components that have evident characteristics for distinguishing front/back of the interface are extracted by the field observation (). The results of the distinction were verified by interviews and a questionnaire survey towards six students who majored in architecture.
Table 1. Categorization of components.
Among the main-components, openings such as customer entrance, common entrance for multi-tenant buildings, and metro entrance are F-components while the entrance for supply, staff, emergency use and cars are B-components. Space manipulation such as flag-shape lots is sorted into F-component while the artificial platforms that highly reduce the accessibility are sorted into B-component. The distinction of front and back of “set-back” and “piloti” depends on the situations ()). When installed together with F-component (especially those entrances), they make the front more front as F-component by creating more gathering place; when installed together with B-component, they make the back more back as B-component for magnifying the impact of the back-side atmosphere. Interior space for the customers such as business space is regarded as F-component, while the operation space for cooking or fabricating, service space such as staircases and corridors are regarded as B-component.
Figure 5. Example of components that play different roles in different situations.
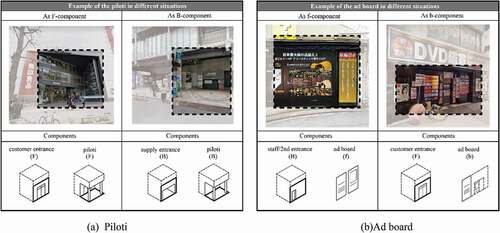
Among the sub-components, transparent glass walls are f-components while translucent and opaque glass walls and solid walls are b-components. Objects for the building such as windows, show windows, sign/billboards, shading devices, and lighting are sorted into f-components, but the ones like meter boxes, vents including AC outdoor units, dustbins, and pipes are sorted into b-component. Objects for the city like seats serve as f-component, while bicycle parking facilities, vending machines, fences, coin lockers, fire, and other facilities are recognized as b-component. The distinction of front and back of “ad boards” and “vegetation” depends on the situations ()). When installed together with F-component (especially those entrances), the chance for them to be recognized as b-components arises because they block the front atmosphere, while in contrast, when installed together with B-component, they are more likely to be recognized as f-component since they cover up the back atmosphere. There also exist some occasional add-ons such as sundries placed at will, graffiti, and dirt on the wall. All of them are regarded as b-component.
2.4. Main investigation
The main data collecting was carried out during December 2018 and replenished during March 2019 through field investigation and Google Street View.
As the first step, the author took a photo of each interface.Footnote2 The height limit of the subject was set according to Maertens’ theory (Dimililer and Akyuz Citation2018). The theory reveals that the object can be perceived as a whole image but not just detailed information nor general framing if the vertical view angle toward it is within 27º, which is also the part that has frequent interactions with pedestrians. Thus, the subject was limited to the ground level or the part below 5 meters high in the case of this research considering the average width of the streets or the sidewalks. Secondly, we extracted and categorized the components observed in the photography of the interface. Based on the combination of the components, the type of interface can be determined (). The result of each interface was mapped down at corresponding locations.
Figure 6. Example for the extraction of the components.
The distribution of the interface is assumed to be influenced by the environment and the building owners’ preference. Therefore, we proposed to analyze such influencing factors including: 1) the location of the interface, 2) the width and length of the street that the interface faces, 3) the land price, and 4) the type of the building where the interface bases on. We also examined the aggregation in and over each type of interface for understanding neighbors’ interaction on interface arrangement.
Information concerning locations and building types were collected by observation during the field investigation; widths and lengths of the street were measured on the digital map (the length of the street defined in this research refers to the extended length of the street in its direction); land prices of certain locations were derived from the public source of the Roadside Land PriceFootnote3 published in 2019. The quantitative relationship between interface distribution and the influencing factors was analyzed by correlation analysis.
As for analyzing the aggregation of the interface, the index (r) by which we could tell a certain type of interface tends to appear close to which type of the interface, was proposed to check the association relationship quantitatively.
Firstly, the types of adjacent interfaces in each level of closeness (k1~ k4) () around each interface (X, 1262 in total) in the site were recorded.
Figure 7. The illustration of the closeness levels.
Then, the index () of a certain type of interface (a) toward one of the four types of interface (b) in each level of closeness (k) was defined by EquationEq. (1)
(1)
(1) . The larger the index is, the higher the chance is for the two tested types of interface to appear together.
Where, is the number of times that the type of interface (b) appears around the type of interface (a) at the closeness level
,
is the total number of the interface (a), and
is an adjusting coefficient because of the different numbers of the interface in each closeness level.
has three locations while
,
, and
have four.
3. Results
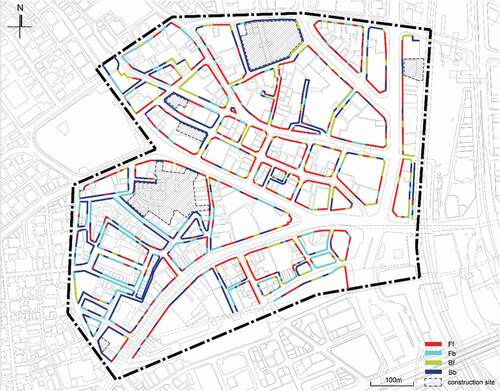
A total of 1262 interfaces from the field investigation were evaluated as the basic data for analysis. The results were mapped on the digital map obtained from the Geospatial Information Authority of Japan (downloaded in 2018.10) and Zenrin Town Map published in Jan. 2019 as a supplement. shows the distribution of the interface. Accordingly, 478 of them are Ff, 302 are Fb, 155 are Bf, and 327 are Bb.
Figure 8. Distribution of the interface in the research site.
3.1. Relationship between interface distribution and the environmental factors
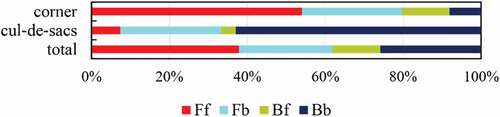
Different locations have quite different proportions of the four types of interface (). Fifty-four percent of the interfaces at the corner of the block are Ff, and another 26% are Fb. The proportion of F-component (usually the entrances) is much higher at corners facing more than two directions compared to the other locations. On the other hand, more than 60% of the interfaces located in cul-de-sacs where the traffic flows are blocked turn out to be Bb, which is much higher than the average share in the entire district.
Figure 9. Proportions of the interfaces in corners and cul-de-sacs compared to the whole area.
Regardless of the width or length of the cul-de-sacs, there is always a high probability to have back components. Hence, the data taken from the cul-de-sacs has been excluded in the analysis related to widths and lengths of the street.
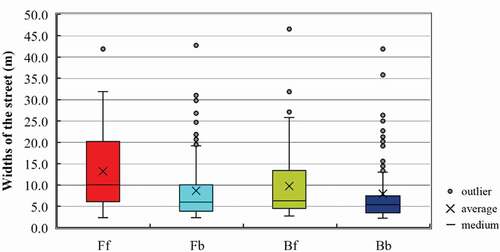
shows the result of the analysis on the relation between the width of the streets and each type of interface. Interface Ff is scattered on the widest range of streets, not only the wide avenues but also the narrow alleys with a median width of 10 m. The extended lower whisker of interface Ff shows that a considerable number of interface Ff is mixed with the others on the narrow alleys. For instance, it can be seen that more than half of the interfaces along the alley called “Spain Slope” which has an average width of 4.5 m are Ff. On the other hand, most of the interface Fb, Bf, and Bb distribute on relatively narrow streets with similar medians around 5 to 6 m. Mass of outliers observed manifest that it is inevitable for the wider streets to have interface Fb, Bf, and Bb though the numbers are limited, bringing about a mixed streetscape which is against the common sense of a prosperous shopping district.
Figure 10. The boxplot of the street widths.
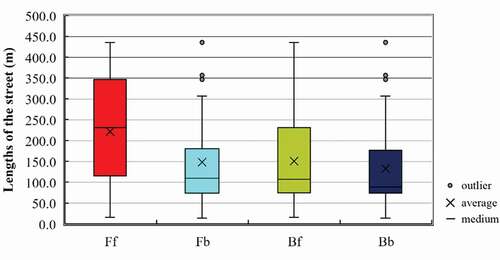
demonstrates the relation between the length of the streets and each type of interface. Similar to that of the width, interface Ff has the largest span of distribution and most of them are located on extended streets from 115 m to 346 m in length with a medium of 230 m. Interface Fb, Bf, and Bb locate in relatively short streets with similar medians and averages in length. The long upper whisker of interface Bf indicates that there is also some interface Bf scattered in the long streets, mixing with the interface Ff.
Figure 11. The boxplot of the street length.
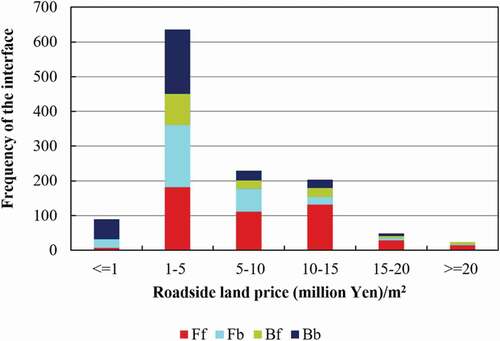
shows the frequency of the interface in different land price zones. Most of the interfaces are located in the land with prices between 1 and 5 million yen per square meter. Below this price zone, there are only a few interface Ff but a lot of Bb observed. As the land price increases, the proportion of interface Bb decreases and that of Ff increases significantly. When the land price goes beyond 20 million yen per square meter, almost all the interfaces are Ff. Interestingly, there are more interface Fb than Bf in low price zones while more interface Bf than Fb in high price zones.
Figure 12. Frequency of the interface in each roadside land price zone.
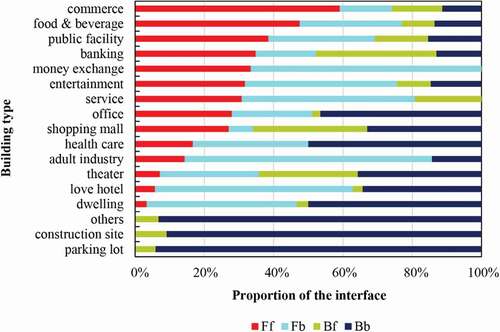
compares the proportion of the interface in each building type. With the exclusion of 7 non-occupied buildings and another 13 with the functions unknown, 1236 interfaces were involved in this analysis. The most common types in this district are commerce and food and beverage, which cover almost 60% of the total interfaces. The results show that commerce (including retail and multi-tenant buildings) and food and beverage (including restaurants, drink shops, café, and bars) have the highest proportions of interface Ff. These types of buildings have the demand to grasp eyes from the pedestrians using various front components, setting the tone of the commercial district in this place. In contrast, parking lots, construction sites, and others (including devices, facilities, gap spaces, garages, scarps, storages) in the urban fabric are always enclosed by back components. They make up only 1% of the sample but 33% of the interface Bb in the entire district. Adult industry (including adult-only shops, DVD shops), dwellings, love hotels and theatres (including a playhouse for small concerts and plays, and striptease theatres) have rather low proportions of interface Ff but more Fb.
Figure 13. Proportions of the interface in each building type.
3.2. Relationship among adjacent interfaces
The aggregation in and over each type of interface in the commercial district is shown in . It shows a general tendency that the aggregation drops with the increase of the distance between the two interfaces.
Figure 14. Adjacent association of each type of interface with Ff, Fb, Bf, and Bb.
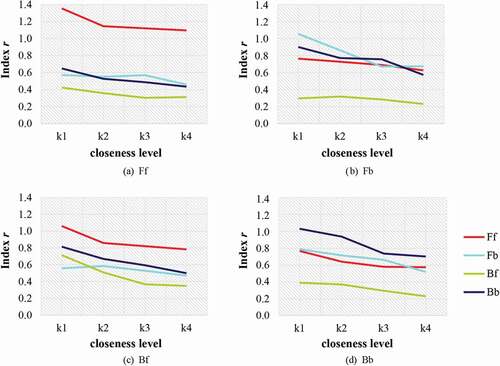
Reading the four charts separately, interface Ff has obvious aggregation in itself but does not have closed correlations with other types of interface (). As for interface Fb, when k ≤ 2, it usually appears close to its type, and then interface Bb and Ff; when k > 2, the self-correlation turns to be similar with the correlation to interface Bb and Ff (). The appearance of interface Bf is highly associated with interface Ff (). Besides, interface Bb shows considerate self-aggregation ()).
Comparing the four charts, it can be found out that interface Ff and Bb have much more self-aggregation, while that of interface Fb and Bf is not obvious. Despite themselves, interface Fb tends to appear with interface Bb and Ff, while interface Bf tends to be close to interface Ff. In general, interface Ff has the greatest impact on the adjacent interfaces. However, no matter how close the interface Bf exists, it has little influence on the distribution of any type of interface.
4. Discussion
Spaces with different types of the interface make up the urban environment in Shibuya Commercial District.
As for the initial objective of this research as determining the definition of the front and back-side space, according to the results of the above analysis, Fb, Bf, and Bb whichever have B-component or b-component in their notations share similar distributional features which are quite different from that of interface Ff, so that we can separate them into two broad categories: the urban space defined by interface Ff is identified as front-side space while the space defined by interface Fb, Bf, and Bb is designated as back-side space. Thereinto, since interface Fb and Bf have both front and back components which make an ambiguous image in appearance, the back-side space defined by them is regarded as ambiguous back-side space ().
Figure 15. Diagram of the defining process of front/ back-side space.
Figure 16. Distribution of the front and back-side space.
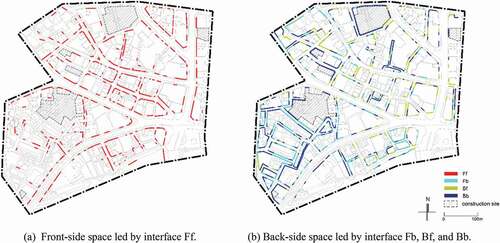
Comparing the front and back-side space, it can be found out that the front-side space does not only appear on the glossy avenues where are wide, extended, and high-priced areas, but also squeeze into the narrow, short, or low-price places, mixing with back-side spaces. The corners of the block have a high chance to be front-side space. Moreover, the business aggregation effect pushes interface Ff to have a high tendency to be located together. On the other hand, the back-side space is diverse with different characters brought by interface Fb, Bf, and Bb. The building owners’ preference on certain interface using in the back-side space was discovered. For instance, adult shops prefer using interface Fb with b-component like sunk fences and vegetation as covering for keeping concealment and privacy. Interface Fb is also common in food and beverage stores and shops with small volumes. When the inevitable b-components cannot be set on other places for environmental or financial reasons, their appearance together with F-component can be understood as a compromise on the limited lot-frontage. Moreover, since the back-side-like store is regarded as a style for its unique charm, there is also of the possibility that the owner adds b-components to the interface on purpose for style making. In contrast, some of the continuous elevations of shopping malls are decorated by f-components such as show windows and ad boards to relieve the negative image of the long, blank, and boring facades. Dwellings, health care facilities, and offices have little impulsion for keeping communications with the pedestrians by interface Bf. Most of their back-side use either interface Fb or Bb. As for the multi-tenant buildings and small shops, interface Bb is rare to see but both of the ambiguous interfaces are adopted for the high demand for communicating with potential customers on the street. Besides, it is speculated that the building owners’ choice on certain interface is also influenced by the neighboring interfaces. If there is interface Ff around, the possibility for setting interface Ff or Bf arises; if there is interface Bb around, the possibility for setting interface Bb arises.
At the scale of components, we can speculate that the land price highly influences the building owners’ enthusiasm on sub-component arrangement. The owners on the high-price land have the intention to use f-component to build connections toward the customers and to appeal them, while those on the low-price land pay less attention to the appearance and let b-components exposed to the urban space. However, the preference for F-component or B-component influenced by certain land price zone is not obvious. Some owners prefer the places with lower price as possible for cost-saving while others prefer better locations at any cost.
A certain district has its unique sequence of the interface that represents the identity of its urban form. As the intermediate state, the ambiguous back-side space in the urban fabric is of great importance in building a diverse and active neighborhood. Interface Fb offers F-component such as customer entrance in the back-side space so that a considerable flow of the pedestrians is sustained and the “hidden” back-side commercial areas which are highly involved in the everyday life of Japanese people are formed. Meanwhile, interface Bf offers f-component such as ad boards and lighting for keeping communicating with the pedestrians, extending the commercial atmosphere to the back-side space, and activating the place.
5. Conclusion
The spatial reference of front and back plays an essential role in reading the Japanese urban space from the past till now. This study has proposed a framework to examine the front and back and demonstrated it in the Shibuya Commercial District in Japan. Through the parameter of the interface, the evaluation of front and back could be discussed more rigorously by the physical arrangement rather than the subjective cognitions, and the discourse of front and back could extend to the urban scale based on the building scale.
Instead of dualistic classification, four types of interface by the combination of main-component of front (F) and back (B) and sub-component of front (f) and back (b), namely Ff, Fb, Bf, and Bb, have been proposed to describe the seemly chaotic urban space. The relationship between the type of interface and the influencing factors including locations, widths and lengths of the streets, land prices, and building types has been examined. According to the similarity of the distributional features of the interface, urban space is separated into two broad categories: the space defined by the interface Ff is identified as front-side space; that defined by interface Fb, Bf, or Bb is identified as back-side space, of which that defined by Fb and Bf is sorted as the ambiguous back-side space.
Based on the analysis above, we can infer several tendencies as the building owners arrange their interfaces. 1) The owners have obvious intentions on certain type of interface for certain building type. 2) The corners of the block are usually arranged with F-component. 3) The arrangement of sub-component is highly influenced by the land price while the influence on the arrangement of main-component by certain land prize zone is not obvious. 4) The type of the interface nearby has an impact on building owners’ decisions on their interface arrangement. They tend to set interface Ff or Bf around Ff, and interface Bb around Bb.
City planning brings notable expansions of the front-side space at the cost of losing the back, especially the ambiguous ones. However, diverse and active places in the Japanese context do not rely on the frontality but some kind of mixture of front and back. Massey (Citation2005) reminds us that a finished place simultaneity is a finish of possibilities diachronically. In other words, a finish with all the interfaces being Ff is a finish of the possibilities for further development. In contrast, the back-side space, especially the ambiguous back-side space led by interface Fb and Bf is always being and remains unfinished as the reserved land for the future, providing the possibilities for diverse urban life. Therefore, the regional revitalization should not simply focus on converting back-side to front-side but respect the existence of the back-side space, especially the ambiguous types, and optimize the share of different interfaces. More comparative studies on an enlarged dataset of commercial districts and beyond in Japan should be conducted to figure out statistical insights for the appropriate proportions of each interface in the certain pattern of the urban space and step further on the way of interpreting urban form through the spatial reference of front and back.
Disclosure statement
No potential conflict of interest was reported by the author(s).
Additional information
Funding
Notes
1 See Shogakukan’s Japanese Dictionary (Nihon Kokugo Daijiten).
2 The unit of an interface is an individual building. If the building is too long and the components changed a lot within the length, it was taken as several interfaces.
References
- Alexander, C. 1987. A New Theory of Urban Design. New York: Oxford University Press.
- Aoki, K., A. Deguchi, and T. Nakano. 2020. “Town Management And Application Of City Planning System In Residential-commercial Mixed Use District Of “ Ura Harajuku ” in Tokyo.” Journal of Architecture and Planning (Transactions of AIJ) 55 (3): 1249–1256. doi:10.11361/journalcpij.55.1249.
- Ashihara, Y. 1986. The Hidden Order. Tokyo: Chuokoron Sha.
- Berque, A. 1994. Living Space in Japan. M. Miyahara, Trans. Tokyo: Chikumashobo.
- Bognar, B. 1985. Contemporary Japanese Architecture, Its Development and Challenge. New York: Van Nostrand Reinhold.
- Bollnow, O. 2011. Human Space. London: Hyphen Press.
- Dimililer, R., and U. Akyuz. 2018. “Towards a Multi-Disciplinary Approach in Urban Design Education : Art and Software (Depthmap) Use in Urban Design of Public Spaces.” EURASIA Journal of Mathematics, Science and Technology Education 14 (4): 1325–1335. doi:10.29333/ejmste/81521.
- Doi, T. 1985. Omote and Ura. Tokyo: Koubundou Publishers.
- Hayami, Y. 2010. “The Back or the Interior in Kyoto of Early Edo Period.” Journal of Architecture and Planning (Transactions of AIJ) 75 (648): 525–533. doi:10.3130/aija.75.525.
- Ishigure, M. 2016. Tokyo Rising from the Postwar Black Markets. Tokyo: Kajima Institute Publishing.
- Kacha Epe Mansouri, L., N. Matsumoto, A. Cavalcante, and A. Mansori. 2013. “Study on Visual Complexity Using RMS Contrast Statistics in Streetscape Composition in Algeria and Japan.” Journal of Architecture and Planning (Transactions of AIJ) 78 (685): 625–633. doi:10.3130/aija.78.625.
- Kanazawa, S. 2002. “Cognition of Front and Back in Urban Space and the Correlation with Urban Structure.” Journal of Asian Architecture and Building Engineering 1 (2) (November): 201–208. doi:10.3130/jaabe.1.2_201.
- Lynch, K. 1960. The Image of the City. London: MIT Press.
- Maki, F. 1988. “City, Image and Materiality.” In Fumihiko Maki: An Aesthetic of Fragmentation, edited by S. Salat. New York: Rizzoli.
- Maki, F. 2008. Nurturing Dreams: Collected Essays on Architecture and the City, edited by M. Mulligan. Cambrige, Massachusetts, London, England: MIT Press.
- Maki, F. 2018. City with a Hidden Past. Tokyo: Kajima publishing.
- Massey, D. 2005. For Space. London: SAGE.
- Moudon, A. V. 1997. “Urban Morphology as an Emerging Interdisciplinary Field.” Urban Morphology 1: 3–10. doi:10.1111/j.1469-8137.1956.tb05265.x.
- Neto, O. A., S. Jeong, J. Munakata, Y. Yoshida, T. Ogawa, and S. Yamamura. 2016. “Physical Element Effects in Public Space Attendance.” Journal of Asian Architecture and Building Engineering 15 (3): 479–485. doi:10.3130/jaabe.15.479.
- Ohno, H. 2010. “The External Layers of Streets.” In City with a Hidden Past. by F. Maki, 103–152. Tokyo: Kajima publishing.
- Ohno, H. MPF. 2016. Fibercity: A Vision for Cities in the Age of Shrinkage. Tokyo: University of Tokyo Press.
- Ohno, R., and E. E. Kubo. 2005. “Residents’ Front/back Definition of the Spaces around Suburban Houses near Tokyo: A Quantitative Study on the Perception and Use of Outdoor Area.” In Designing Social Innovation, edited by B. Martens and A. G. Keul, 223–230, Cambridge: Hogrefe Publishing.
- Rapoport, A. 1977. Human Aspects of Urban Form : Towards a Man-environment Approach to Urban Form and Design. Oxford: Pergamon Press.
- Saito, T., T. Nishio, Y. Taguchi, M. Korenaga, and K. Yagi. 2009. “Spatial Composition and Public Use of Courtyards in the Historic Area in Milan.” Journal of Architecture and Planning (Transactions of AIJ) 74 (639): 1095–1100. doi:10.3130/aija.74.1095.
- Shelton, B. 2005. Learning from the Japanese City. New York: E & FN Spon.
- Sudo, Y., and T. Tsuchimoto. 2000. “Backyard and Back Sides of Town-houses in Kyoto of the Initial Stage of the Early Modern Period.” Journal of Architecture and Planning (Transactions of AIJ) 65 (528): 203–210. doi:10.3130/aija.65.203_1.
- Zhang, Z., K. Fang, X. Wang, L. Chen, W. Zhang, G. Zhu, and N. Furuya. 2020. “Riverside Building Boundary Spatial Characteristics and Utilization Patterns in China Post-urbanization: A Case Study on Shantang River, Suzhou.” Journal of Asian Architecture and Building Engineering 1–16. doi:10.1080/13467581.2020.1838291.