
 ?Mathematical formulae have been encoded as MathML and are displayed in this HTML version using MathJax in order to improve their display. Uncheck the box to turn MathJax off. This feature requires Javascript. Click on a formula to zoom.
ABSTRACT
To study the dynamic characteristics and seismic damage of the Bayun Pagoda,the dynamic characteristics are determined via an in-situ dynamic test, and the flexibility curvature method is used to identify the damage. Moreover, the numerical calculation results of the dynamic characteristics are compared with the test results. The mechanical parameters of the materials are determined in the consistency of the dynamic characteristics, and a plastic damage model is also introduced. From the vertical compressive stress the initial damage is defined, and the seismic damage is analyzed by inputting El-Centro, Taft, and Lanzhou artificial wave. As results, the first-order natural frequencies are close to each other in the horizontal East-West and North-South directions, and the initial damage rates of the 6th, 8th, 10th floors are higher. The distributions of the principal tensile stress excited by different seismic are similarbut the distributions of seismic damage are slightly different; the area with serious seismic damage is in the middle and bottom floors, and the damage accumulation of the first floor is more obvious than those of the other floors. Moreover, the outer edge of each floor, the pagoda eaves, and the periphery of the archway are found to be easily damaged.
1. Introduction
China’s ancient buildings are outstanding historical and cultural heritage sites, and the main examples are masonry pagodas, some of which have been conserved for more than 2000 years. However, the structures of existing masonry pagodas have long suffered from natural erosion, and their material properties have been heavily degraded, thereby causing damage to the structures. The extension of cracks and the decrease in the stiffness of these damaged structures have affected their dynamic properties, thereby leading to the reduction of their overall performance. Furthermore, earthquakes are the main threat to the structural safety of masonry pagodas, and damaged pagodas are more sensitive to earthquakes. With the change of the dynamic characteristics, the seismic responses and damage modes of the structures will also change, which will affect the seismic capacity of ancient pagodas.
Dynamic characteristics are an important basis for the evaluation of the seismic capacity of structures. However, because the material performances of ancient masonry pagodas are dispersive and their structures are various, the reliability of theoretically and numerically derived dynamic characteristic results is difficult to guarantee. Therefore, in-situ dynamic tests are an effective method by which to determine the dynamic parameters of ancient pagodas. Both domestic and foreign scholars have carried out a series of studies on the dynamic performance, structural damage, and seismic capacity of masonry pagodas. For example, in-situ dynamic tests have been carried out to determine the dynamic characteristics of the Zhongjiang South Pagoda, Huqiu Pagoda, Jin’aozhou Pagoda, and Xiaoyan Pagoda, and the dynamic performances of these ancient pagodas were analyzed according to the dynamic characteristic parameters (Fan, Hu, and Yuan Citation2013; Yuan, Fan, and Chen et al. Citation2005; Chen, Deng, and Luo Citation2010; Lu, Li, and Tian Citation2019). Fan, Li, and Peng (Citation2016) investigated the dynamic characteristics of the Songjiang Pagoda, and, combined with the difference in the modal information before and after damage, the damage locations and degree of the pagoda were evaluated. A simplified formula has also been established for the calculation of the vibration period of masonry pagodas based on a cantilever vertical bar model with a uniform distribution of equivalent mass (Yuan Citation2015). Bartoli and Betti analyzed the natural frequency test results of San Gimignano in Italy, summarized 43 different cases, analyzed the physical parameters affecting the dynamic behaviour of masonry tower, combined with the existing evaluation formula, and put forward a reliable semi-empirical formula for the main frequency of masonry tower (Bartoli et al. Citation2017)
Dynamic parameters are the basis for damage identification; when a structure is damaged, its dynamic characteristics will change. Tang et al. (Citation2020) constructed a new damage identification index based on the difference curvature norm of the modal flexibility matrix and verified the rationality of the proposed calculation method for the equivalent damage degree. Based on the formula of the generalized flexibility matrix, He et al. (Citation2020) defined the damage index with the quasi-flexibility difference curvature and proposed a structural damage identification method based on the flexibility curvature and frequency perturbation. Wang and Cheng (Citation2008) proposed a calculation method of the structural damage index and proved the sensitivity of modal frequency to damage. Zhang et al. (Citation2005) used the flexibility curvature method to calculate the damage of a steel truss and verified the feasibility of the method. An and Ou (Citation2014) carried out damage identification according to the proportional flexibility matrix. Combined with the structural reliability appraisal work of Chongjiao Xingfu Temple in Changshu City, Jiangsu Province, China, Qiu and Jiang (Citation2001), Qiu, Jiang, and Cao (Citation2001) proposed a systematic method for the structural damage identification and diagnosis of masonry pagodas based on structural damage identification theories.
The seismic damage and seismic capacity of masonry pagodas are the main components of related seismic research. Pan et al. (Citation2016b) provided the seismic damage characteristics and reinforcement methods of ancient masonry building walls and, based on fuzzy mathematical theory, proposed an evaluation method for the failure state of masonry structures. Chen, Y., and W. (Citation2015) established a mathematical model for the seismic risk assessment of masonry pagodas that considers the failure probability and seismic damage of the structure. Valente and Milani (Citation2016) established finite element (FE) models of eight masonry pagodas in northeast Italy and presented a seismic safety index of ancient pagodas. Valente and Milani (Citation2018) carried out thorough investigations to analyze the effects of geometrical features on the seismic response and damage distribution of numerous historical masonry towers. Later, they established FE models of eight masonry pagodas in northeast Italy and presented a seismic safety index of ancient pagodas (Valente and Milani Citation2016). Habieb, Valente, and Milani (Citation2019) used different isolators to study the seismic performance of the historical masonry bell tower. The numerical simulation results show that LRB (Lead Rubber Bearing) and FPS (Friction Pendulum System) isolators are very effective in reducing the seismic effect of masonry tower. In the case of near-fault earthquake, the isolation system with higher damping and larger size is needed to reduce the displacement of the tower.
Li et al. (Citation2014) simulated the seismic damage evolution process of the Longhu Pagoda and analyzed its seismic failure mechanism via numerical calculation. Gentile and Saisi (Citation2007) identified structural model parameters via environmental vibration measurement and FE simulation and evaluated the damage of an ancient bell tower structure. Later, Saisi and Gentile (Citation2015) evaluated the state and seismic vulnerability of the Gabbia Tower in Italy after an earthquake via geometric measurement, apparent inspection, environmental vibration tests, acoustic waves, and jack tests. Yuan (Citation2013) analyzed the relationship between the seismic damage degree and seismic intensity for masonry pagodas damaged in the Wenchuan earthquake. Kim and Ryu (Citation2003) studied the damage characteristics of an ancient pagoda with a five-story stone structure under different vibration modes via a shaking table test. They proposed the relationship between the damage characteristics and the ground motion mode and compared the damage characteristics of the pagoda structure with historical earthquake damage to quantitatively evaluate the intensity of historical earthquakes. Ca Solo et al. (Citation2013) took 10 existing ancient masonry pagodas in Italy as examples and analyzed the influences of different height-width ratios, wall thicknesses, and opening ratios on the seismic responses of the structures. Moreover, they studied the influence of various geometric shapes on the seismic performances of these pagodas, and, combined with a nonlinear analysis method, analyzed in detail the collapse mechanisms.
The initial damage to ancient pagoda structures has a significant impact on their dynamic characteristics and seismic response. If the structure of a pagoda is damaged, its stiffness, damping, and dynamic characteristics will change accordingly, and the damage mechanism of the structure will be more complex after an earthquake. In their research on the failure of ancient masonry structures, Valente and Milani (Citation2019) took two complex monumental masonry churches in northern Italy as cases, developed detailed FE models that considered the plastic damage behaviour of the structures, and performed nonlinear dynamic analyses to simulate the seismic damage. Moreover, assuming that masonry behaves as a plastic damage material with almost vanishing tensile strength, they also studied the nonlinear dynamic range (Valente et al. Citation2019). By comparing the procedure provided by the relevant Italian code with the FE results obtained via nonlinear static analyses, explicit accounts were provided for the actual inclination of the towers via a cantilever beam approach (Milani, Shehu, and Valente Citation2017). Later, an interactive kinematic limit analysis approach that can be handled by inexperienced users was presented as a means for the reliable evaluation of the seismic vulnerability of masonry towers (Milani Citation2019). The existing literature has reported methods for damage detection and seismic response analysis of existing masonry pagodas via vibration tests, theoretical analysis, and numerical simulation. However, in previous studies, the existing damage to the pagodas was not considered. Therefore, to study the seismic damage process for masonry pagodas with existing damage, in the present work, the damaged Bayun Pagoda is considered as a case study. Considering the initial damage to the pagoda structure, its dynamic characteristics, structural damage, and seismic damage mechanism are analyzed, and the dynamic characteristics of the structure are determined via in-situ dynamic tests. The flexibility curvature method is used to identify the damage to the pagoda, and the initial damage is embedded into a numerical calculation model to analyze the seismic response and damage. This work therefore provides a reference for the seismic capacity evaluation of damaged masonry pagodas.
2. Dynamic characteristics of the Bayun Pagoda
2.1. General conditions of the Bayun Pagoda
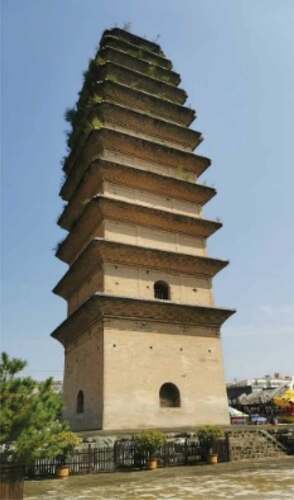
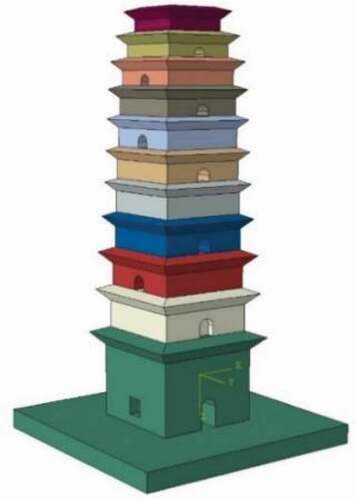
The Bayun Pagoda is also called the Ruiguang Temple Pagoda because there are two marks on the four sides of the first layer that look like floating clouds; these have not disappeared, even in drought years, so it is also called the Bayun Pagoda (). The pagoda is located in Zhouzhi County, Xi’an City, Shaanxi Province, China. It was built during the Tang Dynasty (AD 708) and was rebuilt during the Song Dynasty. It was listed as one of the protected key cultural relics in Shaanxi Province in 1957 and was designated as a protected national cultural relic in 2001. The size of the structure is described in . The wall of the pagoda is a single leaf constructed from clay bricks and glutinous rice mortar.
Table 1. The size of the Bayun Pagoda in detail.
Figure 1. The Bayun Pagoda.
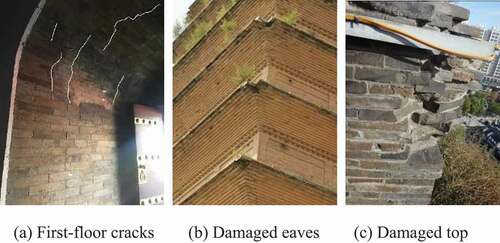
According to an investigation of the structural damage to the Bayun Pagoda, there are many cracks at the top of the archway on the first floor (), obvious falling bricks on the eaves above the fifth and sixth floors (), and the top floor is collapsing ().
Figure 2. The existing damage of the Bayun Pagoda.
2.2. In-situ dynamic test
2.2.1. Test plan
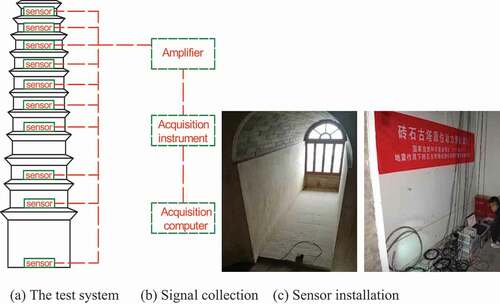
The structural vibration signals of the Bayun Pagoda were sampled under a pulsating ground environment. The main equipment of the dynamic test system included a Model 941B ultra-low-frequency dynamic sensor, a signal amplifier, a maximum amplification factor of 5000, a Model DA1001 dynamic signal collector, and a digital computer. The test plan is presented in ). The pagoda structure is an empty cylindrical structure, and the floors are wooden attachments. Because sensors could not be placed at the centers of the floors, they were arranged at the inner edge of each layer of the structure and bonded with a coupling agent, as shown in ). The signal continuous time was 30 min, and automatic DC removal by the system eliminated the effect of the initial voltage signal. Vibration signals were, respectively, collected in the NS and EW directions for 30 min, and the signals were then smoothed and filtered.
Figure 3. The in-situ dynamic test of the Bayun Pagoda.
2.2.2. Test results
When a structure vibrates, the relationship between the excitation force and the self-power spectrum of the response is expressed as follows (Lu, Tian P. G., and Zhang Citation2017)
where is the frequency response function, and
and
are the self-power spectra of the structural response and excitation force, respectively.
Because there existed no other on-site vibration at nighttime, the ground fluctuation can be considered as white noise with a limited frequency band, and its power spectrum is constant. Therefore, the peak point in the response curve of the power spectrum corresponds to the natural frequency of the structure. After a self-power spectrum analysis, the power spectrum density curve of the Bayun Pagoda under self-vibration was created, as shown in .
Figure 4. The self-power spectra of the vibration of the Bayun Pagoda.
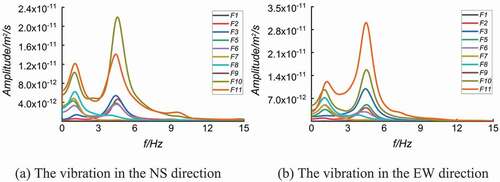
As presented in , the ground-floor measurement point was greatly disturbed by ground vibration, and the correlation between the main frequency of the vibration signal and the structural vibration is weak. The peak power spectrum density is obvious with the increase in the measurement point height from the third layer, and the corresponding frequency is the structural natural frequency. The first two frequencies of horizontal vibration along the EW direction are 1.07 and 4.41 Hz, respectively, and the frequencies of horizontal vibration along the NS direction are 1.04 and 4.23 Hz, respectively. It is evident that the natural frequencies of the pagoda structure in the horizontal NS and EW directions are similar.
The ancient pagoda structure is equivalent to a multi-particle system under the excitation of stationary and random signals. The relationship between the mode coordinates and the power spectrum density is as follows (Lu Citation2016)
where and
are the ith-order mode coordinates of measurement points 1 and 2, respectively,
is the peak value of the cross-power spectrum between measurement points 1 and 2, and
is the peak value of the self-power spectrum of measurement point 2.
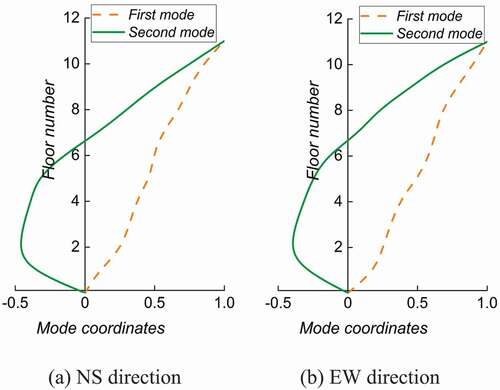
The first two mode coordinates of the Bayun Pagoda were calculated by EquationEq. (2)(2)
(2) and displacement normalization was carried out. As revealed in , the first mode is a shear-type mode, while the second mode is a bending-shear-type mode.
Figure 5. The first and second modes of the Bayun Pagoda.
Changes in the mass and stiffness of a damaged pagoda can affect the damping. The modal damping of the structure was calculated by the power spectrum half-bandwidth method based on the power spectral density curve of the response of each measurement point.
where ωi is the half-bandwidth of the power spectrum, ξi is the damping ratio, and ωi is the i-th frequency value.
The results reveal that the damping ratios of the pagoda structure corresponding to the two modes in the EW direction were, respectively, 0.048 and 0.011, and the damping ratios corresponding to the two modes in the horizontal NS were, respectively, 0.048 and 0.013.
The Rayleigh damping coefficient is used for calculation. Based on the test results of the first two order damping of the pagoda, the Rayleigh damping coefficient of the model can be calculated by calculating the damping coefficient, where ,
,
,
,
is the first two order circular frequency and damping ratio of the tower
,
.
2.3. Numerical calculation
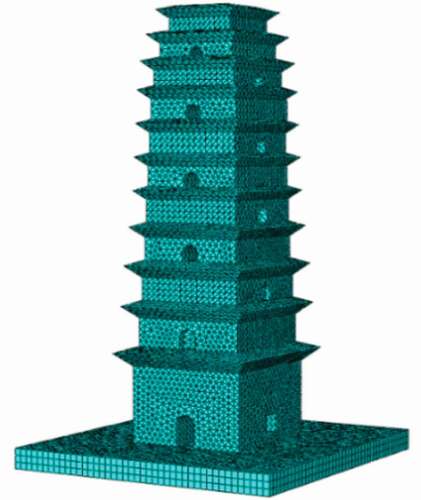
ABAQUS FE software was used to construct the model. In addition to the main structure of the pagoda, its bottom foundation was also considered. Therefore, for the numerical calculation of the seismic response, the foundation was combined with the main structure of the pagoda. The seismic response analysis requires a certain accuracy, especially in the damage analysis. Different elements correspond to different damage conditions; dense grid is conducive to obtain more accurate damage results, so the more dense grids are used while ensuring the amount of calculation, and the simulation results are more accurate. The model is divided into 173,303 grids and the grid spacing is 200 mm.
Furthermore, the 10-node quadratic tetrahedral solid element (C3D10) was used for mesh generation. In total, 173,303 units were included, as presented in . Tetrahedral element can be used to construct arbitrary shape mesh, and the sharp part can be easily divided into tetrahedral mesh, while hexahedral mesh needs regular model.
Figure 6. Finite element model of the Bayun Pagoda.
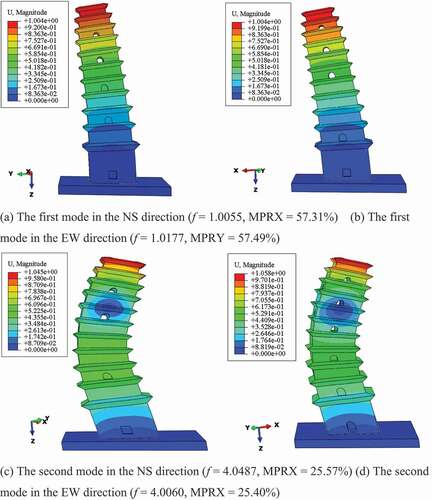
By trial calculation, it was found that when the elastic modulus of the material was 1370 MPa and the density was 1800 kg/m3, the calculated results of the natural vibration frequencies were close to the test results, as shown in . The first two vibration modes in the horizontal direction are shown in , which reveals that the mass participation ratios of the first vibration modes in the NS and EW directions were both approximately 57%.
Table 2. A comparative analysis of the finite element simulation and field test results.
Figure 7. Vibration modes of the Bayun Pagoda.
presents a comparison between the calculated and measured results of the natural vibration frequencies of the pagoda structure. There was little difference between the two first-order frequencies of the test and calculation results. However, the difference range was within 10%, and the calculation results of the natural frequencies along the horizontal NS and EW directions were also similar.
3. Damage analysis of the pagoda structure
3.1. Flexibility curvature amplitude mutation coefficient method
When an ancient pagoda structure is damaged, its stiffness, damping, and other parameters will change, as will its modal parameters. Therefore, the damage area of an ancient pagoda can be identified according to the change of the modal parameters.
The stiffness matrix and flexibility matrix of the pagoda structure are expressed by the following modal parameters:
where is the structural stiffness matrix,
is the flexibility matrix,
is the mass matrix,
is the natural frequency of the structure, and
is the mode shape vector normalized by mass.
It can be seen from EquationEq. (5)(5)
(5) that the flexibility coefficient is inversely proportional to the square of the natural frequency of the structure, so the weight of the higher-order frequency in the flexibility matrix is small, and the structural flexibility is primarily determined by the low-order frequency. Because the low-order modes of the structure can easily be determined, the first two modes are used for damage analysis.
The local flexibility corresponding to the damaged area of the structure is increased, and the flexibility matrix is expressed as follows (Yang Citation2008):
where is the natural frequency of the structure and
is the mode vector after mass normalization.
When the flexibility difference method is used for damage analysis, it is difficult to determine the flexibility of the structure before damage. Therefore, the flexibility curvature is introduced, and the central difference method is used to determine the flexibility curvature of the structure (Tang, Shen, and Chen Citation2001)
where and
are the flexibility curvatures of the structure before and after damage, respectively. Additionally,
and
,
and
, and
and
are, respectively, the compliance coefficients of the ith mode shapes of the,
,
, and
measurement points before and after damage, and
is the distance between adjacent measurement points.
According to EquationEq. (8(8)
(8) ), the flexibility difference curvature can be expressed as follows (Xu and Dai Citation2001):
The mutation coefficient of the flexibility curvature amplitude can more clearly show the variation laws of the flexibility curvature of various parts of the structure, and the formula is expressed as follows (Xu and Dai Citation2001):
where ,
, and
respectively represent the flexibility curvature values of the measured points and their adjacent points.
3.2. Flexibility curvature and amplitude mutation coefficient
The flexibility curvature was calculated using the mode coordinates of the measurement points, and the pagoda structure was divided into 10 sections along its height. The flexibility curvatures of the ancient pagoda along the horizontal EW and NS directions were calculated by the flexibility curvature interpolation, as shown in .
Figure 8. Flexibility curvatures of the Bayun Pagoda in the horizontal directions.
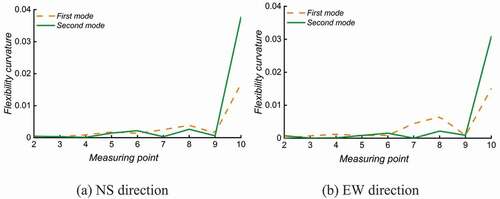
reveals that the flexibility curvatures along the two horizontal directions vary with the height and the first- and second-order modal flexibility curvatures along the horizontal EW and NS directions change significantly at measurement point 9. The modal flexibility curvature of each order has peaks at measurement points 8 and 10, and the flexibility curvature of measurement point 10 reaches the maximum value. The wall thickness and section size of the bottom floor of the pagoda structure are far greater than those of the top floor. The stiffness difference between floors is too large, and the change of the modal flexibility curvature is not significantly affected by the joint damage. Therefore, the mutation coefficient of the flexibility curvature amplitude was used to further determine the damage locations of the pagoda structure, as shown in .
Figure 9. The mutation coefficient of the curvature amplitude in the horizontal directions.
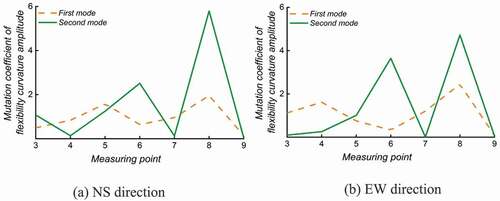
It can be seen from that there is no obvious relationship between the mutation coefficient of the flexibility curvature amplitude and the height of the measurement points of the Bayun Pagoda in the EW and NS directions. Excluding measurement point 7, the mutation coefficient of the second-order modal flexibility curvature amplitude increases with the height of the measurement point; the peak values appear at measurement points 6 and 8, and the maximum value appears at measurement point 8. Because the cross-section of the pagoda is square and the stiffness and mass of the floor are evenly distributed, the variation laws of the mode curvature amplitude mutation coefficient along the horizontal EW and NS directions are basically consistent.
Based on the flexibility curvature and amplitude mutation coefficients of the Bayun Pagoda, the amplitudes of measurement points 6, 8, and 10 are significantly higher than those of adjacent floors, indicating that the pagoda structure is seriously damaged on these three floors.
3.3. Introduction of plastic damage
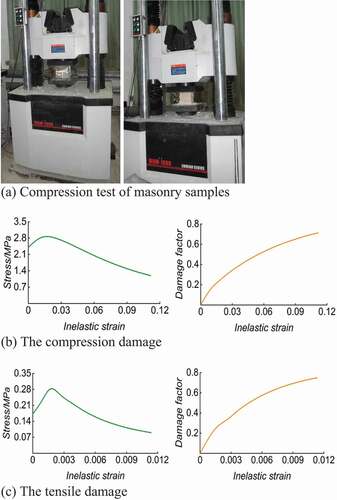
Because the damage state of each floor of the Bayun Pagoda is not consistent, plastic damage should be considered in seismic damage analysis. Combined with the stress–strain curve of old masonry under axial compression, the compression and tensile constitutive model of masonry were determined (Lv and Shi Citation2006; Liu, Yan, and Shi Citation2009; Lu et al. Citation2020). The damage factor is proposed and improved; by substituting the peak stress, peak strain, elastic modulus, and secant modulus of the material, the plastic parameters suitable for this paper can be obtained. presents the stress-strain and strain damage factor curves of the pagoda material after the introduction of plastic damage obtained via the strain and peak stress values, the secant modulus, the initial elastic modulus, and the stress in the compression test. Damage factors contain the tensile damage factor and the compressive damage factor, and the tensile damage factor can be described by the tensile damage value for the masonry.
Figure 10. The plastic damage parameters of the masonry.
According to the calculation results of the vertical compressive stress of each floor of the pagoda structure and the compressive stress curve of the entire pagoda, the pressure ratio of each floor was calculated, as shown in ). Then, by taking the pressure ratio, which is the vertical compressive stress to compressive strength, as the damage parameter, the initial damage to each floor was defined based on the pressure ratio, and the damage was included in the numerical model. The initial compression damage value of each floor is given according to the pressure ratio ()). The model of initial injury after implantation is presented in .
Figure 11. The compressive stress and initial damage of each floor of the Bayun Pagoda.
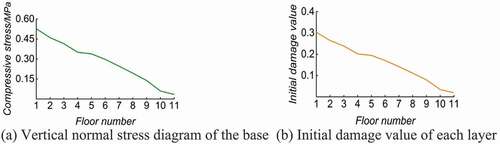
Figure 12. Model of the Bayun Pagoda with initial damage.
For the basic parameters of masonry materials, namely the compressive strength value of and the tensile strength value of
(Yang and Fan Citation2007; CitationWang and Dong), the results show that the peak value of compressive strain is 0.03. Additionally, the average masonry value of the peak tensile strength is 1/10 the compressive value, the expansion angle is 34°, and the eccentricity is the default value of 0.1. Moreover, the ratio of the biaxial compressive strength to the uniaxial compressive strength is 2, the ratio of the second stress invariant on the tension-compression meridian is 0.6667, and the viscosity parameter is 0.005.
4. Damage analysis of the Bayun Pagoda under earthquake conditions
4.1. Seismic wave input
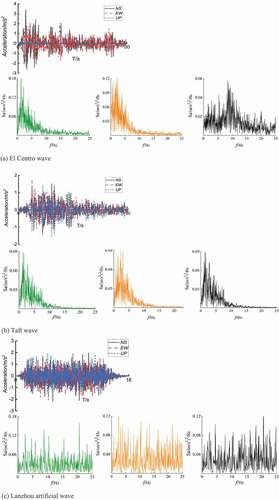
The Bayun Pagoda is located on the ground with an intensity scale of 8. The site is classified as type II, and the basic vibration period is 0.4 s. Based on the ground conditions and earthquake-resistance requirements, three seismic waves, namely the El Centro, Taft, and Lanzhou artificial waves, were selected for excitation, and the detailed waves and response spectra are shown in . As revealed by the figure, the response spectrum curves of the El Centro and Tianjin waves are similar and exhibit obvious peak ranges, while those of the curves of the Lanzhou artificial waves are not obvious. The acceleration was input after amplitude modulation according to the fortification levels of frequent, moderate, and rare earthquakes.
Figure 13. The acceleration time-history curves of three seismic waves.
4.2. Analysis of maximum principal tensile stress
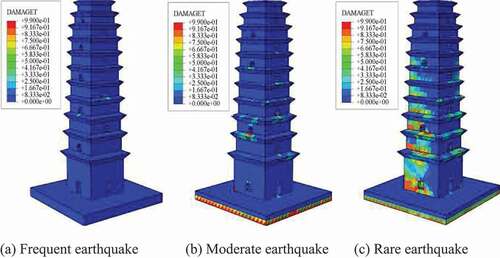
The seismic waves were input in the model to calculate the dynamic responses of the Bayun Pagoda, and the main tensile stresses at the peak times were extracted, as shown in . With the increase in seismic intensity, the peak value of the maximum principal tensile stress increased. The results demonstrate that the maximum principal tensile stresses under the actions of the three seismic waves were distributed at the archway and the pagoda eaves. The maximum principal tensile stresses were, from greatest to least, due to the Taft, El Centro, and Lanzhou artificial waves. Under the condition of a rare earthquake, the maximum stress was 1.237 MPa under the Taft wave, 0.76 MPa under the El Centro wave, and 0.74 MPa under the Lanzhou artificial wave.
Figure 14. The maximum principal tensile stress affected by the El Centro wave.
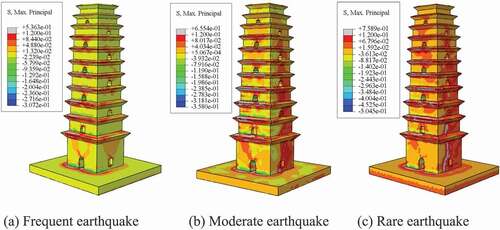
Figure 15. The maximum principal tensile stress affected by the Taft wave.
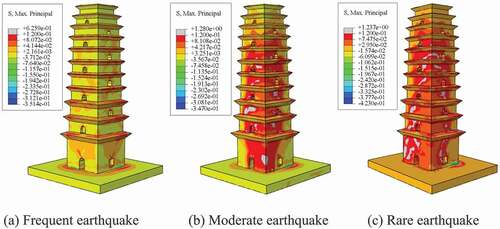
Figure 16. The maximum principal tensile stress affected by the Lanzhou artificial wave.
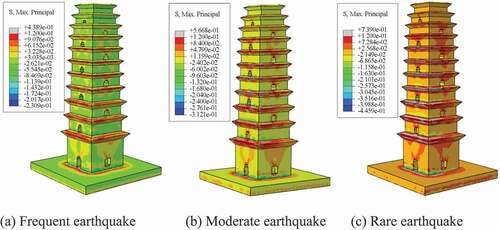
Under the condition of a frequent earthquake, the maximum value of the main tensile stress of the pagoda structure was about 0.05 MPa, which was distributed around the door opening, and this value was slightly greater than the tensile strength of the masonry. Under the condition of a moderate earthquake, the maximum principal tensile stress of the structure reached about 0.07 MPa, and the damage area was distributed at the archway and the eaves of the pagoda. Finally, under the condition of a strong earthquake, the main tensile stress of the pagoda was greater than 0.09 MPa, and most sections of the structure were destroyed under the El Centro and Taft waves.
The tensile damage of the pagoda first appeared in the areas with high tensile stress, which caused the damage of the pagoda opening and the outer edges of the pagoda eaves. With the increase of the input seismic wave intensity, the tensile damage extended to other floors, and a large damage area was gradually formed.
4.3. Tensile damage
Because the tension damage of the masonry materials of ancient pagodas is most obvious, the structural damage contours can reflect the distribution characteristics of the damage of the pagoda structure. present the tensile damage contours of the pagoda structure at the peak response time excited by the three waves. The tensile damage value was found to increase with the increase of the input seismic wave. The results demonstrate that the relationship between the tensile damage value and the maximum principal tensile stress is not consistent under the actions of the three types of waves. The tensile damage value under the El Centro wave was found to be the largest, followed by that under the Taft wave and that under the Lanzhou artificial wave was the smallest.
Figure 17. Tensile damage contours affected by the El Centro wave.
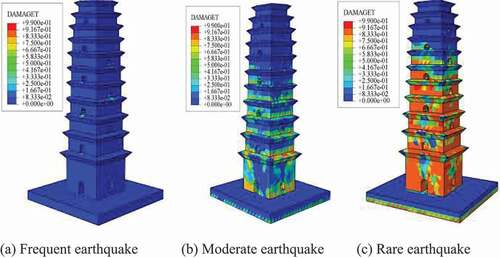
Figure 18. Tensile damage contours affected by the Taft wave.
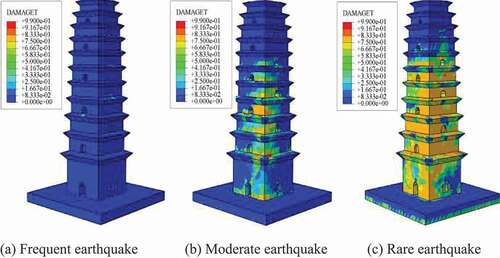
Figure 19. Tensile damage contours affected by the Lanzhou artificial wave.
It can also be seen that the damage area and tensile damage value of the structure were small, and the tensile damage value was less than 0.1. Under the action of the El Centro and Taft waves, the extension range of the tensile damage value of the structure was increased, and was mainly distributed below the seventh floor. The maximum damage values are at the bottom and eaves of the pagoda. In contrast, under the action of the Lanzhou artificial wave, there was only a small range of damage at the pagoda eaves from the second to the seventh floors. Under the condition of rare earthquakes, the maximum tensile damage value under the excitation of the three seismic waves reached about 0.8, and the scope of the severe damage area was slightly extended as compared with that under the condition of a moderate earthquake. Under the action of the El Centro and Taft waves, the damage area basically covered the whole section along the middle floor, whereas the damage area under the Lanzhou artificial wave was only distributed at the NE side below the seventh floor of the pagoda.
Based on the results of the main tensile stress nephogram of the tower, the maximum value of the main tensile stress under the Taft wave was found to be larger than that under the El Centro wave; however, the results of the tensile damage nephogram are contrary, so the effects of the two waves were inconsistent.
4.4. Accumulation of tensile damage
The damage accumulation of a pagoda under seismic wave excitation is closely related to structural failure. The damage factor curves of the first to eighth floors of the pagoda structure for the three types of seismic waves under the conditions of moderate and rare earthquakes were derived, as shown in . The diagrams of the damage factors can reveal the initial time of seismic damage and the damage evolution of each floor after being affected by an earthquake. Once the damage factors of the floor reach an unchanged value, it indicates that the structure of the floor does not suffer further damage. When the damage to the tower increases, the plastic deformation area also increases. Because the distribution of the two is consistent, only the distribution of the plastic damage can be analyzed.
Figure 20. The cumulative damage factor of the Bayun Pagoda affected by the El Centro wave.
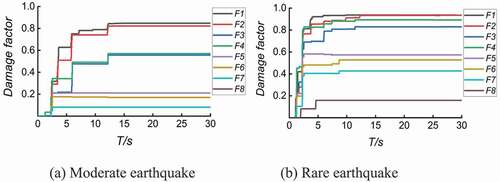
Figure 21. The cumulative damage factor of the Bayun Pagoda affected by the Taft wave.
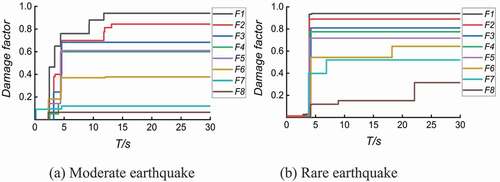
Figure 22. The cumulative damage factor of the Bayun Pagoda affected by the Lanzhou artificial wave.
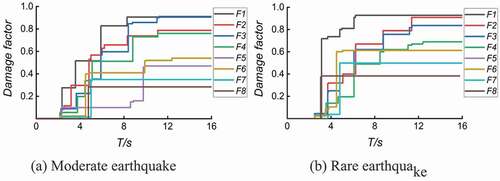
After the seismic wave was input, the initial damage time of the pagoda structure was 2–3 s after loading. The seismic damage started on the lower floor, but the time points of the damage to each floor were not different. The initial damage time of the eight floors under various load cases was slightly delayed, and the final damage value was also the minimal. The overall trend is that the damage factor of the lower floor was greater than that of the upper floor.
By comparing the damage results of moderate and rare earthquakes under the same seismic wave, it can be seen that the damage to each layer presented a ladder-type growth under the condition of a moderate earthquake, and the maximum value of the damage factor was about 0.9. In contrast, in the case of a rare earthquake, the damage to each layer reached the maximum value at almost the same time, and the final damage factor values of the three seismic waves were between 0.93 and 0.96.
Moreover, when the structural damage to the ancient tower is small, the tower body slightly rocks around the bottom section of the pagoda. When the upper part of the structure is damaged and cracked, the pagoda above the broken surface will rock around the broken surface. With the increase in tower damage, the amplitude of shaking also increases.
A comparison of the process of seismic damage accumulation with the initial damage to the pagoda reveals that the floors with more serious initial damage were not the same as the floors with the fastest accumulation of seismic damage. After the pagoda is damaged in earthquake, the cracks in structure lead to local failure along the fracture. If the projection range of the fracture in the horizontal plane is greater than one-half of the cross-sectional area, the pagoda will overturn along the fracture plane. The reason for this is that the initial damage to the first floor of the structure could not be determined due to the limitation of the measurement points; moreover, the damage to the Bayun Pagoda has been repaired multiple times, and the initial damage was not the result of original seismic damage. The tensile damage factor of the structure reveals that when the structure was damaged by an earthquake, the damage first appeared on the first floor and spread upward with loading; however, the damage factor of the first floor was the largest, and the damage pattern was the most serious.
From the spectra, it can be seen that the main frequencies of the three seismic waves are not the same. When the structure of the pagoda was damaged, its frequency decreased. When the two frequencies were in the same frequency band, the dynamic response increased rapidly and the damage became more severe. Therefore, the damage contour plot results under the action of the three seismic waves are different.
5. Conclusion
The defining feature of this research is that, according to the damage identification results of a masonry pagoda, its seismic response was analyzed in consideration of the damage of the structure, and the process and characteristics of seismic damage were investigated.
• The damage and cracks of the Bayun Pagoda have little influence on the dynamic characteristics of the structure in the EW and NS directions, and the test results of the horizontal dynamic characteristics were basically consistent with the numerical calculation results.
• The flexibility curvature method was used to identify the initial damage of the Bayun Pagoda structure, and the initial damage of the 6th, 8th, and 10th floors is more serious.
• The results of the main tensile stress and tensile damage of the pagoda demonstrate that, under earthquake conditions, the archway and the eaves of the pagoda will be damaged first, and floors 1–8 are vulnerable.
• The calculation results of the damage accumulation of each floor of the pagoda under different seismic waves were slightly different, but the damage accumulation laws were similar. Additionally, the distribution of the seismic damage of the pagoda structure was found to be inconsistent with the initial damage.
In future research, the contact and slip of the interface between bricks and mortar will be considered in the numerical simulation of ancient masonry pagodas, and a more refined numerical model will be established to study their seismic response and damage.
Acknowledgments
We would like to acknowledge the help extended by the staff at the Structural Engineering Laboratory at the Xi’an University of Technology to conduct the experiments. We are also grateful to the anonymous reviewers for their comments. We would also like to thank EditorBar (www.editorbar.com) for its linguistic assistance during the preparation of this manuscript.
Additional information
Funding
References
- An, Y. H., and J. P. Ou 2014. “A Proportional Flexibility Matrix Decomposition-based Damage Localization Method for Frame Structure.” Journal of Vibration Engineering and Technologies 27 (6): 819–826. doi:10.16385/j.cnki.1004–4523.2014.06.017.
- Bartoli, G., M. Betti, A. M. Marra, and S. Monchetti. 2017. “Semiempirical Formulations for Estimating the Main Frequency of Slender Masonry Towers[J].” Journal of Performance of Constructed Facilities 31 (4): 04017025. doi:10.1061/(ASCE)CF.1943–5509.0001017.
- Ca Solo, S., G. Milani, G. Uva, and C. Alessandri. 2013. “Comparative Seismic Vulnerability Analysis on Ten Masonry Towers in the Coastal Po Valley in Italy.” Engineering Structures 49: 465–490. doi:10.1016/j.engstruct.2012.11.033.
- Chen, P., Z. Y. Yun, W. Z. Song,and Y. F. Chen 2015. “Seismic Vulnerability Assessment of Ancient Masonry Pagoda.” Earthquake Research Engineering and Retro 45 (4): 98–102. doi:10.13204/j.gyjz.201504018.
- Chen, T. C., H. Deng, and X. H. Luo. 2010. “Dynamic Characteristic Analysis and Test for Jinaozhou Pagoda.” Journal of Vibration and Shock 29 (4): 193–196+240. doi:10.13465/j.cnki.jvs.2010.04.035.
- Fan, H., Y. X. Hu, and J. L. Yuan. 2013. “The Structure of the South Pagoda of Zhongjiang in Dynamic Rest Research.” Journal of Yangzhou University 16 (3): 57–60+69. doi:10.19411/j.1007-824x.2013.03.014.
- Fan, Y. M., S. X. Li, and D. Peng. 2016. “Application of Micro Tremor Technology on Integrated Damage Detection of Ancient Pagoda Structures.” Chinese Journal of Applied Mechanics 33 (1): 61–66+180-181. doi:10.11776/cjam.33.01.C009.
- Gentile, C., and A. Saisi. 2007. “Ambient Vibration Testing of Historic Masonry Towers for Structural Identification and Damage Assessment.” Construction and Building Materials 21 (6): 1311–1321. doi:10.1016/j.conbulidmat.2006.01.007.
- Habieb, A. B., M. Valente, and G. Milani. 2019. “Effectiveness of Different Base Isolation Systems for Seismic Protection: Numerical Insights into an Existing Masonry Bell Tower.” Soil Dynamics and Earthquake Engineering 125: 105752. article ID:105752. doi:10.1016/j.soildyn.2019.105752.
- He, R., Y. K. Tan, Q. X. Guo, and W. He. 2020. “Structural Damage Identification Based on Analogous Flexibility Difference Curvature and Perturbation of Frequency.” China Earthq Eng J 42 (4): 7–12. doi:10.3969/j.1000–0844.2020.04.825.
- Karayannis, C. G., B. A. Izzuddin, and A. S. Elnashai. 1994. “Application of Adaptive Analysis to Reinforced Concrete Frames.” Journal of Structural Engineering 120 (10): 2935–2957. doi:10.1061/(ASCE)0733-9445(1994)120:10(2935).
- Kim, J. K., and H. Ryu. 2003. “Seismic Test of a Full-scale Model of a Five-storey Stone Pagoda.” Earthquake Engineering & Structural Dynamics 32 (5): 731–750. doi:10.1002/eqe.246.
- Li, S. C., Y. J. Zhao, D. D’Ayala, and Y. Liu. 2014. “Numerical Simulation on the Seismic Damage Evolution of Masonry Ancient Pagodas.” Journal of Yangzhou University 17 (4): 60–63. doi:10.19411/j.1007-824x.2014.04.015.
- Liu, G. Q., Y. Q. Yan, and C. X. Shi. 2009. “Research on the Unified Model of the Compressive Constitutive Relations of Masonry.” Journal of Hunan University 36 (11): 6–9
- Lu, J. L. 2016. “Damage and Dynamic Characteristics Analysis of a Solid Structure Pagoda.” Mechanics in Engineering 38 (5): 560–566. doi:10.6052/1000-0879-16-064.
- Lu, J. L., C. L. Li, X. Han, and F. L. Zhang. 2020. “Numerical Simulation and Test Verification of Seismic Damage for a Brick Masonry Pagoda.” Journal of Vibration Engineering and Technologies 33 (2): 364–371. doi:10.16385/j.cnki.1004–4523.2020.02.017.
- Lu, J. L., X. L. Li, and P. G. Tian. 2019. “Study on Dynamic Characteristics and Structural Damage Identification of Xiaoyan Pagoda.” Journal of Building Materials and Structures 49 (5): 38–43. doi:10.19701/j.jzjg.2019.05.008.
- Lu, J. L., J. H. Si, P. G. Tian,and W. Zhang. 2017. “Dynamic Characteristic Test Analysis of Jishi Pagoda of Xingjiao Temple.” Journal of Building Materials and Structures 47 (21): 105–108. doi:10.19701/j.jzjg.2017.21.020.
- Lv, W. R., and C. X. Shi. 2006. “Constitutive Relationship of Brick Masonry.” Journal of Building Materials and Structures 36 (11): 77–78+53. doi:10.19701/j.jzjg.2006.11.024.
- Milani, G. 2019. “Fast Vulnerability Evaluation of Masonry Towers by Means of an Interactive and Adaptive 3D Kinematic Limit Analysis with Pre-assigned Failure Mechanisms.” International Journal of Architectural Heritage 13 (7): 941–962. doi:10.1080/15583058.2019.1645241.
- Milani, G., R. Shehu, and M. Valente. 2017. “Role of Inclination in the Seismic Vulnerability of Bell Towers: FE Models and Simplified Approaches.” Bulletin of Earthquake Engineering 15: 1707–1737. doi:10.1007/s10518-016-0043-0.
- Pan, Y., D. Xie, S. Yuan, and X. Y. Wang. 2016b. “Seismic Damages of Nepalese Cultural Heritage Buildings and Strengthening Measures: Case Studies on Three Durbar Squares in Ms 8.1 Gorkha Earthquake.” Journal of Harbin Institute of Technology 48 (12): 172–182. doi:10.11918/j.0367–6234.2016.12.025.
- Pan, Y., L. J. Li, W. Y. Yao, and H. Q. Wang. 2016a. “Evaluation Methods for Post-earthquake Damage State of Ancient Masonry Buildings.” Journal of Southwest Jiaotong University 51 (4): 704–713. doi:10.3969/j.0258–2724.2016.04.015.
- Qiu, H. X., and Y. S. Jiang. 2001. “System Identification for Structural Damage of Ancient Pagoda I:Theory.” Journal of Southeast University 31 (2): 81–85.
- Qiu, H. X., Y. S. Jiang, and S. Y. Cao. 2001. “System Identification for Structural Damage of Ancient Pagoda II:Application.” Journal of Southeast University 31 (2): 86–90.
- Saisi, A., and C. Gentile. 2015. “Post-earthquake Diagnostic Investigation of a Historic Masonry Tower.” Journal of Cultural Heritage 16 (4): 602–609. doi:10.1016/j.culher.2014.09.002.
- Tang, S. H., C. F. Luo, Z. Fang, B. J. Su, X. B. Zhang, and J. Q. Chu. 2020. “Structural Damage Identification Method Based on Curvature Norm Difference of Modal Flexibility Matrix.” Chinese Journal of Applied Mechanics 37 (3): 982–989+1385. doi:10.11776/cjam.37.03.B008.
- Tang, X. B., C. W. Shen, and D. F. Chen. 2001. “Flexibility Curvature Method in the Damage Detection of Structures.” Journal of Wuhan University 23 (8): 18–20+26. doi:10.13413/j.cnki.jdxblxb.2008.02.016.
- Valente, M., and G. Milani. 2016. “Seismic Assessment of Historical Masonry Towers by Means of Simplified Approaches and Standard FEM.” Construction and Building Materials 108: 74–104. doi:10.1016/j.conbuildmat.2016.01.025.
- Valente, M., and G. Milani. 2016a. “Non-linear Dynamic and Static Analyses on Eight Historical Masonry Towers in the North-East of Italy.” Engineering Structures 114: 241–270. doi:10.1016/j.engstruct.2016.02.004.
- Valente, M., and G. Milani. 2016b. “Seismic Assessment of Historical Masonry Towers by Means of Simplified Approaches and Standard FEM.” Construction and Building Materials 108: 74–104. doi:10.1016/j.conbuildmat.2016.01.025.
- Valente, M., and G. Milani. 2018. “Effects of Geometrical Features on the Seismic Response of Historical Masonry Towers.” Journal of Earthquake Engineering 22 (sup1): 2–34. doi:10.1080/13632469.2016.1277438.
- Valente, M., and G. Milani. 2019. “Advanced Numerical Insights into Failure Analysis and Strengthening of Monumental Masonry Churches under Seismic Actions.” Engineering Failure Analysis 103: 410–430. doi:10.1016/j.engfailanal.2019.05.009.
- Valente, M., G. Milani, E. Grande, and A. Formisano. 2019. “Historical Masonry Building Aggregates: Advanced Numerical Insight for an Effective Seismic Assessment on Two Row Housing Compounds.” Engineering Structures 190 (Jul.1): 360–379. doi:10.1016/j.engstruct.2019.04.025.
- Wang, B. B., and J. Dong. 2014. “Nonlinear Finite Element Analysis of Masonry Wall Using Damaged Plasticity Model.” Journal of Disaster Prevention and Mitigation Engineering 342: 216–222. 10.13409/j.cnki.jdpme.2014.02.019.
- Wang, Z., and Y. S. Cheng. 2008. “Statistical Damage Detection Based on Dynamic Characteristics of Feedback Controlled Structure.” Journal of Engineering Mechanics 25 (1): 116–121+136.
- Xu, F. H., and B. Dai. 2001. “Identification Method for Damage Structure Based on the Relative Change Rate of Flexibility Curvature Matrix.” Journal of Changsha University 12 (4): 63–68.
- Yang, H. 2008. “Structural Damage Identification Based on Flexibility Matrix Method.” Journal of Jilin University 46 (2): 242–244. doi:10.13413/j.cnki.jdxblxb.2008.02.016.
- Yang, W. Z., and J. Fan. 2007. “A Generic Stress Strain Equation for Masonry Materials in Compression.” Journal of Zhengzhou University 28 (1): 47–50.
- Yuan, J. L. 2013. “Study on Corresponding Relation between Seismic Intensity and Damage Degree of Ancient Masonry Pagodas.” Journal of Earthquake Engineering and Engineering Vibration 33 (2): 164–167.
- Yuan, J. L. 2015. “A Simplified Method for Calculating the Fundamental Period of Ancient Masonry Pagoda.” Journal of Earthquake Engineering and Engineering Vibration 35 (2): 151–156. doi:10.13197/j.eeev.2015.02.151yuanjl.018.
- Yuan, J. L., H. Fan, H. B. Chen et al.JL Yuan, H Fan, HB Chen, L Yao, D Abruzzese. 2005. “Experimental Study of Dynamic Behaviour of Huqiu Pagoda.” Journal of Engineering Mechanics 22 (5): 158–164.
- Zhang, L. M., C. W. Jun, S. J. Du, and Y. X. Shi. 2005. “Testing Damage on the Steel Truss Structure Using the Method of the Sudden Change Coefficient of Flexibility of Curvature.” Journal of Southeast University 35 (A1): 133–138.