
 ?Mathematical formulae have been encoded as MathML and are displayed in this HTML version using MathJax in order to improve their display. Uncheck the box to turn MathJax off. This feature requires Javascript. Click on a formula to zoom.
ABSTRACT
Unmanned aerial vehicles (UAVs) are widely utilized in civil engineering due to the ease of use of UAVs in aerial monitoring tasks. A UAV-based mapping system is efficient and allows for a higher frequency of monitoring. Furthermore, improving technologies with increasing applications has made it possible to wirelessly send auto flight data to ground stations in real time. Existing studies have focused on data processing on UAV captured data to a form that is measurable and manageable. Studies on using 2D images for 3D modeling usually employ the point cloud generation algorithm. This research explores a 2D image environment that is favorable for point cloud generation by adjusting the environmental values of the image that have a direct influence on the algorithm of point cloud generation. Accuracy analysis is done by checking the number of generated point clouds by variation of illumination values. The aim of this study is to propose a pre-processing methodology to adjust 2D image using histogram equalization, adaptive histogram equalization, image sharpening and local contrast enhancement method in construction site. 2D image corrections by pre-processing methods are converted into point cloud data and results performance is analyzed and verified by comparing with original data results.
1. Introduction
Unmanned aerial vehicles (UAVs) have recently seen widespread use in several contexts, including civil engineering, disasters, agriculture, delivery, and the military sector. The global UAV market has seen consistent expansion and further growth is expected. Particularly, expansion of spatial information portal services like MS Virtual Earth and Google Earth parallels the growth of the market. Moreover, the contribution ratio to the spatial information field via aerial monitoring is expected to expand. Therefore, there is significant interest in employing UAVs for fast and convenient aerial monitoring. The time, cost and human resource efficiency of UAV-based photogrammetry enables high-frequency monitoring. Furthermore, the ability of real-time data transmission to the ground via wireless connectivity is vital in the increasing utilization of autonomous flight-based UAV data acquisition (Lee, Bae, and Ryu Citation2009).
Figure 1. Input 2D image, calculation of camera pose, generation of 3D point cloud.
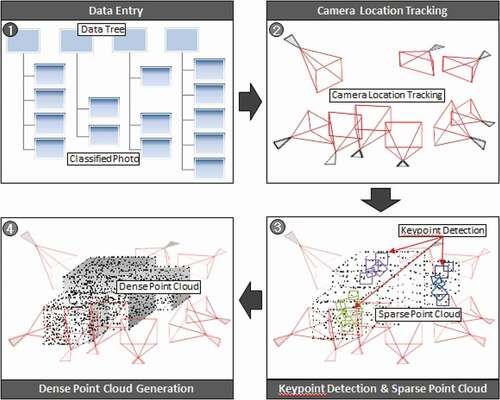
Figure 2. Image histogram process.
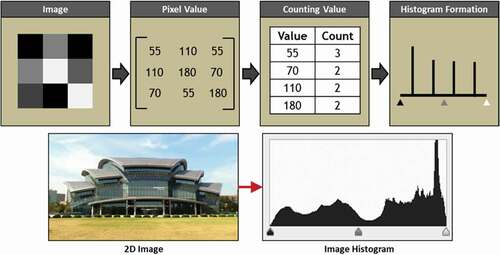
Figure 3. Image compensation methodologies.
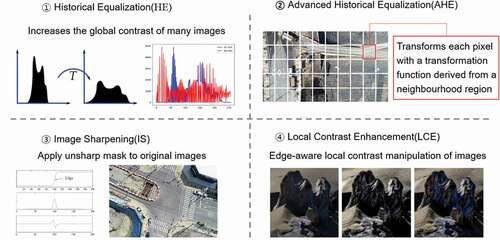
Figure 4. Specification of UAV and camera.
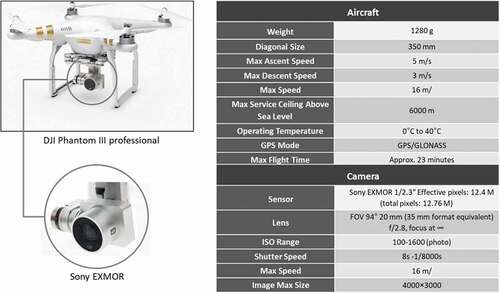
Figure 5. Comparison of photogrammetry software.
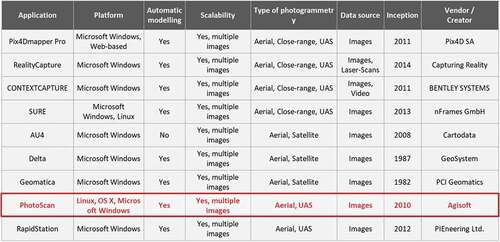
Figure 6. Pre-processing software (Matlab).
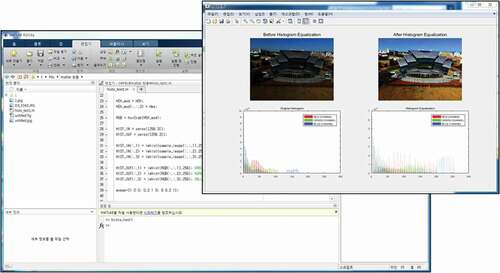
Figure 7. Test condition(target1(left), target2(right)).
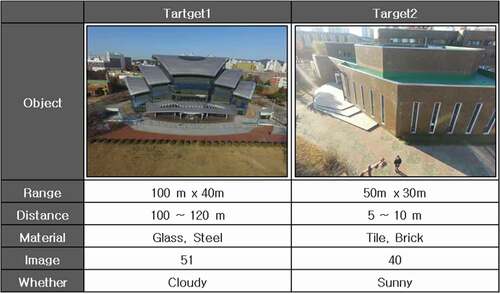
Figure 8. Compensation of 2D images.
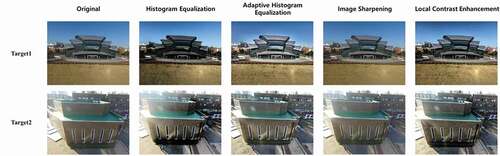
Figure 9. The results of sparse point cloud.
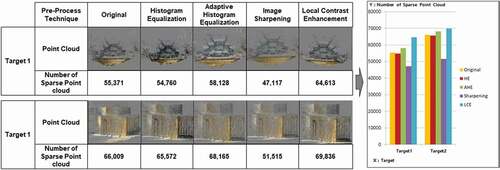
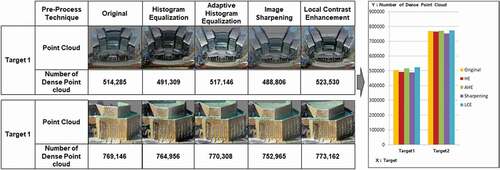
Figure 10. The results of dense point cloud.
Existing technologies concentrate on algorithms using UAV data and its analysis. Particularly, there have been multiple attempts to convert raw data to be measurable and manageable, not just for surveying. Most development has been on algorithms of point cloud generation for three-dimensional (3D) modeling using two-dimensional (2D) images.
Presently, the construction industry is employing laser scanners as well UAVs for site and construction management (Yim, Seo, and Yun Citation2015). Photogrammetry using UAVs is accurate, efficient and inexpensive. Thus, its frequency and areas of application increase. Nevertheless, acquiring high-quality data is challenging due to the dynamic nature of environments, hurdles with reference points application, and post-processing difficulties caused by the nature of construction sites.
Therefore, to solve photogrammetry’s limitations in construction, this study experimented on changes in illuminance to improve the accuracy of 3D point cloud data that is ultimately generated in the 2D digital image photographing stage. Furthermore, after the image acquisition step, various image quality enhancement techniques were used to correct the images and compare and analyze the accuracy of the 3D point cloud data obtained from the corrected 2D images. In this study, 3D images of various buildings were produced using unmanned aerial photogrammetry, and the degree of performance improvement was verified and analyzed based on the key point and point cloud values.
2. Literature review and theoretical discussion
Two of the most ubiquitous technologies in UAV image processing are Scale-Invariant Feature Transform (SIFT) by Lowe (Citation2004), and Structure from Motion (SfM) by Snavely, Steven, and Richard (Citation2006). The multi-image matching technique (Seitz et al. Citation2006; Hiep et al. Citation2009; Zhu et al. Citation2010) is based on semi-global matching algorithms (Gehrke et al. Citation2010; Hirschmuller Citation2008), optimal flow algorithms (Pierrot-Deseilligny and Paparoditis Citation2006). Later, Furukawa and Ponce (Citation2010) and Rothermel et al. (Citation2012) proposed an algorithm to convert initial point clouds of lower density to high-density point clouds using Multi-View Stereo (MVS) technology recalculation. The standard technology of aerial triangulation known as bundle adjustment calculates the parameters of interior and exterior orientation for individual photos in the photogrammetry field.
Compared to laser scanners, the low accuracy of UAV photogrammetry is the most significant drawback. If resolved, photogrammetry implementation can decrease costs in construction sites and scheduling. There have been several studies on the analysis of factors that degrade accuracy. SfM, when combined with UAV technology, provides a cost-effective and efficient way to get accurate and dense 3D data of the Earth surface (Lucieer, Jong, and Turner Citation2014). d’Oleire-Oltmanns, Marzolff, and Peter (Citation2012) demonstrated the mapping and monitoring of soil erosion by a small fixed-wing UAV. Harwin and Lucieer (Citation2012) used a multi-rotor UAV and SfM workflow to achieve 2.5–4 cm of accuracy. Absolute geometric accuracies of 4 cm were achieved by Turner, Lucieer, and Watson (Citation2012), using a multi-rotor UAV and SfM workflow to derive DEMs and ortho-mosaics of Antarctic moss beds compared with DGPS ground control. (Niethammer, James, and Rothmund Citation2012; Niethammer, Rothmund, and James Citation2010) employed a quad-copter UAV to acquire aerial photography and generated DSMs and ortho-mosaics of the Super-Sauze landslide in southern France; achieving geometric accuracies of around 0.5 m. ,
Snavely and Szeliski (Li, Snavely, and Huttenlocher (Citation2010) studied 3D information noise caused by corresponding pixels mismatching. Many factors in construction sites, such as an untidy environment, mismatch between pixels, changes in lighting, and sensor noise, make photogrammetry through 2D images difficult (Robert, Al-Hamadi, and Michaelis Citation2007). Processing is needed to improve accuracy of 3D photogrammetry data from construction sites that has significant noise (Kim, Son, and Kim Citation2011). Kerdsrilek (Citation2008) removed DSM point cloud automatically where height changes were severe, such as buildings, and developed a SCOP++ algorithm that converts to DTM by interpolating surrounding data. The shortcoming of the algorithm is that heights of larger buildings needed manual editing since they were represented obliquely. The primary causes and resolution methods to improve construction site photogrammetry quality needed to be explored. Lowe (Citation2004) extracted identical feature points of different images and proposed a method to produce reliable 3D data. The study reported changes in number of feature points being affected by noise, distortion, and lighting changes; despite feature points not being affected by rotation and scale of images. Prior studies had found acquired 2D images having significant impact on quality of 3D data. ,
Thus, the best way to get high-quality 3D data in construction sites and other poor environments is the pre-processing of acquired 2D data. Multiple processing methods to acquire 3D images of high quality from 2D images have been proposed, e.g., illuminance, contrast and sharpness tweaking. Amongst those, changes in illuminance and image contrast are the most efficient for photogrammetry data acquiring algorithms. This process, generally known as Histogram Equalization (HE), was first studied by Pizer et al. (Citation1987). It transforms contrast and illuminance by changing the histogram of image information values. Based on existing HE methods, Kim (Citation1997) developed bi-histogram equalization (BBHE). Abdullah-Al-Wadud et al. (Citation2007) later compared and analyzed global, local and dynamic histogram equalization (GHE, LHE and DHE respectively) to determine the strengths and weaknesses of each.
Histogram equalization usually increases global contrast and may cause noise amplification in the conversion process. Several studies were conducted to prevent this, including a study on adaptive histogram equalization (Pizer et al. Citation1987), which divides an image into several blocks and performs histogram equalization for each block, and a study on contrast-limited histogram equalization (Zuiderveld Citation1994), which limits the contrast enhancement of adaptive histogram equalization. Previous studies focused on improving quality of image itself, which limited 2D data utilization, and few studies have been conducted on sparse data generation and correlation. Akcay evaluated results of key-points extracted by pre-processed images using histogram equalization, high pass and low pass filters (Akcay and Avsar Citation2017).
Therefore, this study proposes solutions to the quality limitations of photogrammetry on construction sites using a UAV. Firstly, the change in the result of 3D reconstruction is checked according to a change in brightness via a change in camera aperture and shutter speed in the data acquisition stage. Secondly, histogram equalization, contrast-limited adaptive histogram equalization, image sharpening, and local contrast, which are the preprocessing techniques for image improvement in the data processing stage, are applied, and the 3D point cloud values are compared and analyzed through the SFM. The procedure of pre-processing proposed is as follows.
Correct the 2D images from UAV. (Histogram Equalization, Adaptive Histogram Equalization Contrast Limited Adaptive Histogram Equalization, Image Sharpening, local contrast enhancement)
Detect the key-points and generate sparse point cloud.
Compare the number of key-points generated by each method.
Generate the dense point cloud
Analyze the relationship between number of key-points and accuracy of dense point cloud.
Derive the best method by analysis of results.
2.1. Basic theory of photogrammetry
The technology to convert 2D digital images into 3D images is usually called image-based modeling, photogrammetry, or structure from motion (SfM). The SfM algorithm uses overlapped photos to generate 3D scenes automatically. Developed at Cornell University in 2006 by Professor Snavely, it restores 3D shapes in each scene as well as the location relationships of cameras. The algorithm then uses 3D to restructure several overlapped photos taken from different angles. SfM easily implements image registration in spite of camera location or scale changes by recognizing feature points in the SIFT algorithm.
The degraded coordinate value (x, y, z) accuracy of the target and initial location estimate of camera can be improved by iterative calculations of the non-linear least-squares method. All pixels are represented as point clouds, which are highly accurate 3D coordinate values. However, the SfM method does not include information of scale and orientation; coordinate values of point clouds have relative spatial coordinate values between the 2D images and objects.
The core function of SfM is to ascertain coordinate values of feature points that are matched with 2D images from multiple angles. A relationship of feature points between the images is determined after extracting the points from 2D images of objects. A matrix is then generated from the corresponding relationship; followed by estimating camera locations and the coordinates of every feature point via factorization. A bundler and bundle adjustment, which are open software, are used for the factorization process. Random sample consensus (RANSAC) and the track method are used for feature point matching of 2D images. A point cloud can be generated if three 2D images have two feature points; otherwise it is automatically removed if conditions are not met. Contrasting existing aerial photogrammetry, SfM processes are performed automatically. However, early point cloud precision was too low to accurately represent an object.
Developed at Washington University by Professor Furukawa, patch-based multi-view stereo (PMVS) and clustering view for multi-view stereo (CMVS) are therefore employed for precision improvement. CMVS decomposes overlapped 2D images into subsets or clusters, and PMVS reconstructs a 3D structure from the clusters independently (Furukawa and Ponce Citation2010).
In early bundler generated point cloud, the number of points increases as CMVS and PMVS processes progress, thereby generating point cloud of high-density. However, all the processing procedures are performed automatically, thereby making inspection or modification of data values by users difficult. Consequently, bundler has a drawback of somewhat degrading reliability regarding the accuracy of the output.
2.2. 3D reconstruction software
As of late, multiple 3D modeling with 3D images software applications are being developed. Pix4Dmapper and Photoscan are widely used and feature-rich examples. These applications employ a variety of image formats to extract 3D models by application of option values in line with the object. Thus, they’re ideal for modeling within various environments. However, these features are restricted to professional versions. Hence, each application has its own merits and faults. Pix4Dmapper is specialized for UAV images and has a variety of features and expressions, including a point cloud editor, project optimization, area mixing and editing.
Often used alongside Pix4Dmapper, Photoscan shares many features and supports extensions for inputting images, increasing the accuracy, and shortening camera tracing duration with the align photo feature. The overall process is similar, consisting of uploading the picture, editing the mesh, specifying the mask area, creating high-quality texture, aligning the picture, building and editing the point cloud, transforming to mesh-shaped polygons, and exporting as desired values. However, the cloud editor expands upon the features, offering automatic control via python, DEM data output, 4D processing, and mesh use changes. Thus, Photoscan is ideal for buildings, sculptures, and topography as well as aerial images. Available output formats are: PDF, LAS, XYZ, PLY, ASPRS, OBJ and U3D.
A lighter software application, Memento by Autodesk, is more suited for extracting 2D images and point cloud compared to Recap 3D, the existing scanner software. Despite being disadvantaged in the supported formats when compared to the competition, Memento is better for implementing more vivid 3D objects, called HD3D, efficiently. It is optimized for detailed scanning rather than for larger objects. The cloud editor is quick loading, even for voluminous meshes, and offers multiple features including wire frame, isolation for mesh arrangement, realistic textures, variance analysis between real and digital models, and modifications. A salient feature is the creation of 3D models for CNC or 3D printers after saving as STL file. PLY, OBJ, FBX, RCM and STL are available output formats.
2.3. Image histogram
Image histograms are used to represent color distributions in digital images, usually on a value range from 0 to 255 in gray scale. The overall color distribution of the image can be determined at a glance since the histogram of a specific image is represented. Image histograms help users to easily identify the characteristics of images such as brightness, contrast and color distribution. Filtering features, such as decreases or increases in image contrast and brightness, can be implemented on the image histogram’s data.
2.4. Histogram equalization
Studies have been conducted to improve 2D image quality to overcome the limitation of photogrammetry in various construction sites. The data processing of 2D images acquired through UAV can be the most efficient method to obtain high-quality 3D data. The pre-processing method of 2D images to acquire more precise 3D data can be done variously by changing illuminance, contrast, and sharpness. Among the above processing methods, the most efficient method is changes in illuminance and contrast of images considering algorithms to acquire photogrammetry data. Generally, this process is called histogram equalization (HE). This method transforms illuminance and contrast by changing image histogram of image information values displayed as a form of histogram. Previous studies have focused on improving quality of image itself, which limited 2D data utilization, and few studies have been conducted on 3D data generation and correlation.
Histogram equalization (HE) makes the distribution of image contrast values uniform to improve image quality. The objective is to generate a uniformly distributed histogram. Particularly, HE is effective with dark, detailed sections of images. Therefore, it can cope with construction environments efficiently. HE has four execution phases. 1) The brightness value’s (j) frequency (hist[j]) is calculated using IE. 2) Cumulative frequency-based cumulative histogram values are calculated and normalized.
3) Using the gray scale mapping function, the normalized cumulative histogram is mapped to gray-level values.
4) The input image’s pixel value i is converted to a normalized value n[i], generating the image result.
In this study, the above method was used to convert each section of RGB, generating high-quality contrast.
2.5. Contrast-limited adaptive histogram equalization
This technique specifies certain areas in the image and designates a suitable conversion function for each area. The boundary line can be displayed clearly by specifying the arrangement of the histogram to be converted, thereby achieving a different effect from the existing histogram equalization. One problem of histogram equalization is that severe noise is generated on the boundary line where different regions are in contact with each other. In the case of contrast-limited adaptive histogram equalization (CLAHE), there is a certain restriction on the value of the color conversion function for each region to reduce the contrast effects of images, but it can offset the noise generated in the boundary portion of the existing histogram equalization to some extent.
2.6. Image sharpening and local contrast enhancement
Unsharp masking is a popular image processing technique for image enhancement. With this technique, which is used to sharpen the image, an unsharp mask is created using a different image from the original and a blurred image via filter. Three factors are required for sharpening: threshold, amount, and radius. Threshold means the minimum required contrast for a pixel to be an edge pixel, specified in the scalar range from 0 to 1. Higher values (near 1) allow sharpening only in high-contrast regions, such as strong edges, while leaving low-contrast regions unchanged. Lower values (near 0) allow relatively smoother regions of the image to be sharpened. The strength of the sharpening effect, called amount, is specified as a numeric value. Larger values lead to larger increases in the contrast of the sharpened pixels. Radius is the term used for standard deviation of the Gaussian lowpass filter, also specified as a numeric value that controls the size of the region around the edge pixels that affected by sharpening.
The local contrast enhancement method flattens or enhances the local contrast of 2D images by smoothing or increasing details while leaving strong edges unaltered. Two factors are needed for local contrast enhancement: edgeThreshold and amount. The edgeThreshold defines minimum intensity amplitude for strong edges to be left intact, while amount is the amount of smoothness or enhancement needed.
3. Scope and methodology
UAVs are employed in multiple areas including reconnaissance, military, engineering, and agriculture. With the introduction of small, unmanned aircraft (i.e., drones), UAVs have performed various high-quality functions cost-effectively in commercial/industrial settings.
Recently, UAVs have been used in acquiring 3D information for tasks such as supervision of construction, verification of errors, and Building Information Modeling (BIM) on construction sites. A construction project’s progress record can be generated with UAV-based photogrammetry, which is resource efficient. However, there is a slew of 3D data quality degrading factors such as the untidiness of construction sites, lighting changes, sensor noise, pixels mismatch, environment diversity, reference point application hurdles, and post-processing difficulties. Additionally, errors and inaccuracies are present due to the characteristics of photogrammetry. These realities necessitate a method that reduces errors and inaccuracies.
To increase the accuracy of 3D data, a method for increasing illuminance and contrast was applied in the 2D image acquisition stage of this study. Furthermore, in order to obtain a high-quality contrast value, various image compensation techniques were used to change image property values through data processing in the previous stage of 3D reconstruction. Finally, the obtained data values from the original and from the corrected image were compared and analyzed.
3.1. Research process
Experimental methodology consisted of three steps: data collection, processing, and analysis of results. The detailed process comprised selecting the equipment, data acquisition, transformation, processing, comparison, and reliability verification. For the collection stage, the equipment was selected, UAV flight plan was set, and specified building’s 2D image data was acquired. In this process, data of different illuminances were obtained at different camera apertures and shutter speed values. Then, the values were compared to the differences of the results according to the variables in the acquisition step. Next, in the data processing step, the collected 2D image data were processed using image correction techniques. Histogram equalization, contrast-limited adaptive histogram equalization, image sharpening, and image local contrast were used for image correction. Then, the key point, sparse and the dense point cloud of the original and the modified 2D image were obtained and compared. For results analysis, the degree of quality improvement was confirmed by comparing and analyzing the final values derived from each data type.
3.2. Experimental device and software
The commercially ubiquitous DJI Phantom 3 Professional with the Sony EXMOR camera examined the applicability of UAV photogrammetry in the commercial construction sector. The UAV can maintain a 30 minutes flight, with a maximum speed of 16 m/s. The camera images acquired were 4000 × 3000 pixels and 12 Megabytes.
Multiple UAV specialized photogrammetry software is available on the market. Two popular commercial examples are Pix4Dmapper and PhotoScan. Amongst other examples, the software mainly utilized in this study are:
Pix4Dmapper
Used initially along with other software examples.
Photoscan
Ultimately selected due to lower noise in buildings.
Matlab
Used to implement HE.
Functions of the photogrammetry software examples utilized:
key point analysis
sparse point cloud generation
dense point cloud generation
The before and after the transformation photos and their image histograms are shown in the four windows on the screen.
4. 3D reconstruction according to change of illuminance value
4.1. Test condition
A flight plan to collect image data of identical angle and path was established prior to conducting this study. The building's heights and distances were identical. Two buildings at Sungkyunkwan University in South Korea were chosen. DJI Phantom III Advanced was the selected UAV and Samsung NX300, the camera. Image/picture data was obtained using the UAV from identical locations and classified by illumination value. Then Photoscan application was used to obtain the number value of point cloud of the data with each illumination value. The number of points per illumination value were analyzed to get the most efficient and the average illumination value. Finally, the illumination value that had the greatest number of point cloud was determined.
The following combinations of shutter speed and aperture were used: F8, 1/6000; F13, 1/2000; F22, 1/200; F22, 1/500. 40 pictures were taken, 10 for each combination, in test for Target 1; and 96 pictures, 24 per combination, were taken in test for Target 2. Every 3 minutes, the ground was marked, and accurate vertical position of UAV was verified. To check the variation of illumination in Target 1, the southward building’s front was photographed. In Target 2, another building was photographed for comparison from two directions. The picture/image data of each environment and illumination value was classified by shutter speed and aperture. Average illumination and distribution was determined for each picture group. The average illumination was converted to a brightness value. The Photoscan application was used to create the classified data’s point cloud value.
4.2. Number of point cloud for performance evaluation
To standardize brightness results according to shutter speed and aperture, the brightness was analyzed and presented as a lux value. The brightness values for F13, 1/2000; F8, 1/6000; F22, 1/500; and F22, 1/200 were 100 lx, 120 lx, 150 lx, and 200 lx. Number of point cloud values for Target 1 were 1269 for F13, 1/2000; 1059 for F8, 1/6000; 1180 for F22, 1/200; and 1349 for F22, 1/500. For Target 2; 12339 for F13; 1/2000; 11320 for F8, 1/6000; 11639 for F22, 1/200; and 12050 for F22, 1/500.
4.3. Test results
For shutter speed 1/2000, aperture value F13, and average brightness (lux) of 100 lx the generated point cloud number was 1,269 in Target 1 and 12,339 in Target 2. The number of generated point cloud for 1/6000, F18, and 100 lx was 1,059 in Target 1 and 12,339 in Target 2. For 1/500, F22, and 150 lx; it was 1,180 in Target 1 and 11,639 in Target 2. 1/200, F22, and 200 lx had 1,349 in Target 1 and 12,505 in Target 2 ().
Table 1. Application possibilities for digital twin.
The total point clouds of 2D data for 100 lx and 200 lx were greater by about 11% than the number of point cloud for 120 lx and 150 lx.
5. Compensated images-based 3D reconstruction and discussion
5.1. Test condition
Three buildings were targeted in the experiment. For Target 1, the Academic Information Center at Sungkyunkwan University was selected. The shooting area was 100 m × 40 m, and the distance was 100 m–120 m. Glass and steel were the main external materials and the weather was cloudy. Student Center at Sungkyunkwan University was Target 2 with shooting area 50 m × 30 m and distance 5 m–10 m. Weather conditions were sunny and with tiles, paint, and bricks on the exterior. For Target 1, a civil scale was used to verify the applicability in civil engineering. The experiment for Target 2 focused on a building with diverse structures and changes in illuminance to emulate construction site conditions.
5.2. Compensation of original 2D image
For image compensation, the histogram equalization, contrast-limited adaptive histogram equalization, image sharpening, and local contrast enhancement techniques were applied to the images obtained from Target 1 and Target 2.
For image compensation in this study, the contrast enhancement limit value for contrast-limited adaptive histogram equalization was set at 0.005, and the tile was set at [8, 8]. For image sharpening, the threshold value was set at 0, the amount at 0.8, and the radius at 1. The threshold and amount values of local contrast enhancement were set at 0.4 and 0.5, respectively, for the experiment.
In this process, we could visually confirm that there was a greater effect, especially in unclear images with cloud or shadows. We then created a point cloud through 3D reconstruction and compared the resulting number of points generated between the original images and the images corrected through each technique. The number of generated points was compared by using spare points and dense points, which represent the tie points of valid points among the total key points. The PhotoScan values for sparse reconstruction were set as follows: accuracy (medium), key point limit (80000), tie point limit (10000), quality (low), and depth filtering (aggressive) for dense reconstruction.
5.3. Comparison and analysis on the sparse point cloud of the original 2D image and the compensated 2D image
For Targets 1 and 2, the sparse point cloud results obtained from the original image and the corrected image were compared and analyzed. Target 1 obtained 55,371-point cloud from the original image, and 54,760 (histogram equalization), 58,128 (contrast-limited adaptive histogram equalization), 47,117 (image sharpening), and 64,613 (local contrast enhancement) point cloud were obtained. Target 2 obtained 66,009 point cloud from the original images, and the number of point cloud obtained from the corrected image was 65,572 (histogram equalization), 68,165 (contrast-limited adaptive histogram equalization), 51,515 (image sharpening), and 69,836 (local contrast enhancement). The image corrected through histogram equalization and image sharpening was lower than the original image’s dense point cloud, and a sparser point cloud value was obtained using contrast limited adaptive histogram equalization and local contrast enhancement.
The change in the generated points was observed when the variables of each technique were varied, and it was found that the contrast of the 2D image and the number of generated points increased as the contrast enhancement limit value of the adaptive histogram equalization was increased. In the case of local contrast enhancement, as the amount variable increased, the contrast value of the 2D image also increased, and the number of generated points slightly increased. As the edgeThreshold variable increased, the number of generated points slightly decreased. In the case of image sharpening, the change in the radius and amount value affects the generated points. As the radius and amount value decreased, the number of generated points increased. However, it did not reach the number of generated points of the original image.
A paired sample t-test was conducted to identify the correlation coefficient of the result values. The data values before and after applying the AHE, IS, and LCE techniques to targets 1 and 2 were compared to determine whether applying the techniques had an effect on increasing the key-points. First, we established the null hypothesis, “Applying the AHE, IS and LCE techniques have no effect on key point generation” and the alternative hypothesis, “Applying the AHE, IS and LCE techniques have an effect on key point generation.” summarizes the result of the paired sample t-test. . Paired Sample T-Test between original 2D images and compensated 2D images.
Table 2. Comparison of sparse point cloud number according to pre-processing variables.
Table 3. Paired sample T-test between original 2D images and compensated 2D images.
Because the p value (significance) is smaller than 0.05 for targets 1 and 2, the alternative hypothesis, “Applying the AHE, IS and LCE techniques have an effect on key point generation” is true. However, in this study, an image compensation technique has an effect only if it increases the number of key points. Thus, the IS technique was found to have no effect because the number of key points decreased although the p value was significant.
5.4. Comparison and analysis on the dense point cloud of the original 2D image and compensated 2D image
For Targets 1 and 2, the dense point cloud results obtained from the original image and the corrected image were compared and analyzed. For Target 1, 514,285 dense point cloud were obtained from the original image, and 491,309 (histogram equalization), 517,146 (contrast-limited adaptive histogram equalization), 488,806 (image sharpening), and 523,530 (local contrast enhancement) dense point cloud were obtained. For Target 2, 769,146 dense point cloud were obtained from the original image, and 764,956 (histogram equalization), 764,956 (adaptive histogram equalization), 752,965 (image sharpening), and 773,162 (local contrast enhancement) dense point cloud were obtained from the corrected image. The dense point cloud of the image corrected through histogram equalization and image sharpening were lower than those of the original image. Furthermore, it was found that more dense point cloud can be obtained when local contrast enhancement and contrast-limited adaptive histogram equalization are applied.
6. Conclusions
Hypotheses were established and verified for the accuracy analysis of 3D reconstructions of 2D images. First, this study verified that the efficiency of 3D reconstruction can be improved by analyzing the change in the number of point cloud generated according to the illuminance value of the 2D images in the data acquisition step. In the image capturing step, the aperture and shutter speed values produced different illuminance values for the same object. As a result of the 3D reconstruction conversion, the 2D image data of 100 lx and 200 lx increased about 11% more than the 2D image data of 120 lx and 150 lx.
Second, this study analyzed the influence of image correction techniques on the improvement of photogrammetry quality by comparison of results of sparse and dense point cloud, which consist of tie points of valid points among the key points, which is a decision-making scale for 3D reconstruction. Histogram equalization, contrast-limited adaptive histogram equalization, and local contrast enhancement techniques were used for image compensation. Consequently, the result values increased when the images were corrected with contrast-limited adaptive histogram equalization and local contrast enhancement techniques. Furthermore, the changes of 2D images and 3D point cloud generation values according to the variables of each technique were confirmed.
The 2D image pre-processing proposed in this study suggests the possibility of using it more efficiently in places where the quality of the 2D image itself is high, such as construction sites, and it can be utilized in various applications such as 2D reconstruction and 2D image stitching. Limitations of the study include lacking experimental information on more diverse objects because only two objects were used, the application of variable values to the setting of the illuminance in the data acquisition step, and the lack of RGB luminance analysis. Furthermore, higher quality results could be obtained more efficiently if an in-depth study is conducted for the comparison and analysis of actual measurement data and the data obtained with high precision-measuring equipment such as laser scanners.
Disclosure statement
No potential conflict of interest was reported by the author(s).
Additional information
Funding
Notes on contributors
Daeyoon Moon
Daeyoon Moon received his Ph.D. at Sungkyunkwan University with his dissertation titled “Improved optimization method to generate 3D earthworks world model based on hybrid method (UAV & TLS)„ submitted to the department of convergence engineering for future city in 2019. His past works have included research involving smart construction technologies and developing methods to implement IoT and sensing in the civil engineering sector.
Kyuhyup Lee
Kyuhyup Lee is a Ph.D. candidate at Sungkyunkwan University's Department of Convergence Engineering for Future City. His work includes developing algorithms and systems for implementing AR/VR technologies, Cyber-Physical Systems, smart factories, and is interested in the application of advanced technologies for innovation processes in smart construction.
Soonwook Kwon
Soonwook Kwon is a Professor of School of Civil and Architectural Engineering, Landscape Architecture and a Chair Professor of Graduate Program for Future City Convergence Engineering Department of Sungkyunkwan University, Korea. He is also a board of director of IAARC (International Association of Automation and Robotics in Construction). He received his Ph.D. from University of Texas at Austin, Department of Civil Engineering in Construction Engineering and Project Management Program. After receiving the degree, he worked as a senior researcher at Korea Institute of Construction Technology (KICT), and conducted research projects in the areas of construction technology and governmental programs encouraging technological advancement of the AEC industry.
Seojoon Lee
Seojoon Lee received his master's degree from Sungkyunkwan University's Department of Convergence Engineering for Future City. He has worked on developing algorithms and systems for Cyber Physical Systems for manufacturing facility maintenance, field information visualization and sharing using AR/VR/MR, smart safety for temporary structures, and construction management technology for off-site construction based precast concrete housing.
Jinwoo Song
Jinwoo Song received his master's degree from Sungkyunkwan University's Department of Convergence Engineering for Future City. His work has focused on Cyber-Physical Systems, smart manufacturing, semiconductor factories, AR/VR/MR technologies and smart construction management.
References
- Abdullah-Al-Wadud, M., M. H. Kabir, M. A. A. Dewan, and O. Chae. 2007. “A Dynamic Histogram Equalization for Image Contrast Enhancement.” IEEE Transactions on Consumer Electronics 53 (2): 593–600. doi:10.1109/TCE.2007.381734.
- Akcay, O., and E. O. Avsar. 2017. “The Effect of Image Enhancement Methods during Feature Detection and Matching of Thermal Images.” The International Archives of Photogrammetry, Remote Sensing and Spatial Information Sciences 42: 575. doi:10.5194/isprs-archives-XLII-1-W1-575-2017.
- d’Oleire-Oltmanns, S., I. Marzolff, and K. Peter. 2012. “Unmanned Aerial Vehicle (UAV) for Monitoring Soil Erosion in Morocco.” Remote Sensing 4: 3390–3416. doi:10.3390/rs4113390.
- Furukawa, Y., and J. Ponce. 2010. “Accurate, Dense, and Robust Multiview Stereopsis.” IEEE Transactions on Pattern Analysis and Machine Intelligence 32: 1362–1376. doi:10.1109/TPAMI.2009.161.
- Gehrke, S., K. Morin, M. Downey, N. Boehrer, and T. Fuchs. 2010. “Semi-global Matching: An Alternative to LIDAR for DSM Generation.” In Proceedings of the 2010 Canadian Geomatics Conference and Symposium of Commission I, Calgary, Alberta, Canada, Vol. 2(6).
- Harwin, S., and A. Lucieer. 2012. “Assessing the Accuracy of Georeferenced Point Clouds Produced via Multi-view Stereopsis from Unmanned Aerial Vehicle (UAV) Imagery.” Remote Sensing 4: 1573–1599. doi:10.3390/rs4061573.
- Hiep, V. H., R. Keriven, P. Labatut, and J. P. Pons. 2009. “Towards High-resolution Large-scale Multi-view Stereo.” In Computer Vision and Pattern Recognition CVPR 2009. IEEE Conference, Miami, FL, 1430–1437.
- Hirschmuller, H. 2008. “Stereo Processing by Semiglobal Matching and Mutual Information.” IEEE Transactions on Pattern Analysis and Machine Intelligence 30 (2): 328–341. doi:10.1109/TPAMI.2007.1166.
- Kerdsrilek, J. 2008. “Reduction of DSM to DTM and Quality Assessment.” Photogrammetry and Remote Sensing Project for Zurich Airport. Swiss Federal Institute of Technology.
- Kim, C., H. Son, and C. Kim. 2011. “The Effective Acquisition and Processing of 3D Photogrammetric Data from Digital Photogrammetry for Construction Progress Measurement.” Proceedings of the 2011 ASCE International Workshop on Computing in Civil Engineering, 178–185. Miami, Florida.
- Kim, Y. T. 1997. “Contrast Enhancement Using Brightness Preserving Bi-histogram Equalization.” IEEE Transactions on Consumer Electronics 43 (1): 1–8. doi:10.1109/30.580378.
- Lee, D. C., K. H. Bae, and K. H. Ryu. 2009. “Geospatial Data Modeling for 3D Digital Mapping.” Journal of the Korean Society of Survey, Geodesy, Photogrammetry and Cartography 27 (3): 393~400.
- Li, Y., N. Snavely, and D. P. Huttenlocher. 2010. “Location Recognition Using Prioritized Feature Matching.” European Conference on Computer Vision, Vol. 6312, 791–804. Berlin Heidelberg: Springer.
- Lowe, D. G. 2004. “Distinctive Image Features from Scale-invariant Keypoints.” International Journal of Computer Vision 60 (2): 91–110. doi:10.1023/B:VISI.0000029664.99615.94.
- Lucieer, A., S. M. D. Jong, and D. Turner. 2014. “Mapping Landslide Displacements Using Structure from Motion (SfM) and Image Correlation of Multi-temporal UAV Photography.” Progress in Physical Geography 38 (1): 97–116. doi:10.1177/0309133313515293.
- Niethammer, U., M. R. James, and S. Rothmund. 2012. “UAV-based Remote Sensing of the Super-Sauze Landslide: Evaluation and Results.” Engineering Geology 128: 2–11. doi:10.1016/j.enggeo.2011.03.012.
- Niethammer, U., S. Rothmund, and M. R. James. 2010. “UAV-based Remote Sensing of Landslides.” ISPRS Commission V Mid-Term Symposium ‘Close Range Image Measurement Techniques’, Vol. Part 5, 496–501. Newcastle upon Tyne: International Archives of the Photogrammetry, Remote Sensing and Spatial Information Sciences XXXVIII, June 21–24.
- Pierrot-Deseilligny, M., and N. Paparoditis. 2006. “A Multiresolution and Optimization-based Image Matching Approach: An Application to Surface Reconstruction from SPOT5-HRS Stereo Imagery, Archives of Photogrammetry.” Remote Sensing and Spatial Information Sciences 36: 1/W41.
- Pizer, S. M., E. P. Amburn, J. D. Austin, R. Cromartie, A. Geselowitz, T. Greer, B. T. H. Romeny, and J. B. Zimmerman. 1987. “Adaptive Histogram Equalization and Its Variations.” Computer Vision, Graphics, and Image Processing 39 (3): 355–368. doi:10.1016/S0734-189X(87)80186-X.
- Robert, N., A. Al-Hamadi, and B. Michaelis. 2007. “A Novel Method for 3D Face Detection and Normalization.” Journal of Multimedia 2 (5): 1–12.
- Rothermel, M., K. Wenzel, D. Fritsch, and N. Haala. 2012. “SURE: Photogrammetric Surface Reconstruction from Imagery.” LC3D Workshop, Vol. 9. Berlin Germany.
- Seitz, S. M., B. Curless, J. Diebel, D. Scharstein, and R. Szeliski. 2006. “A Comparison and Evaluation of Multi-view Stereo Reconstruction Algorithms.” Proceedings of the IEEE Conference on Computer Vision and Pattern Recognition 1: 519–528.
- Snavely, N., M. S. Steven, and S. Richard. 2006. “Photo Tourism: Exploring Photo Collections in 3D.” ACM Transactions on Graphics (TOG) 25 (3): 835–846. doi:10.1145/1141911.1141964.
- Turner, D., A. Lucieer, and C. Watson. 2012. “An Automated Technique for Generating Georectified Mosaics from Ultra-high Resolution Unmanned Aerial Vehicle (UAV) Imagery, Based on Structure from Motion (Sfm) Point Clouds.” Remote Sensing 4: 1392–1410. doi:10.3390/rs4051392.
- Yim, S. B., C. W. Seo, and H. C. Yun. 2015. “Terrestrial Mapping for Inaccessible Areas by Using UAV.” In Proceedings of the annual conference of the Korean Society of Survey, Geodesy, Photogrammetry and Cartography, Korea 257~258
- Zhu, Q., Y. Zhang, B. Wu, and Y. Zhang. 2010. “Multiple Close‐range Image Matching Based on a Self‐adaptive Triangle Constraint.” The Photogrammetric Record 25 (132): 437–453. doi:10.1111/j.1477-9730.2010.00603.x.
- Zuiderveld, K. 1994. “Contrast Limited Adaptive Histogram Equalization.” Chap. VIII.5 in Graphics Gems, edited by P. S. Heckbert, Vol. IV. 474–485. Cambridge, MA: Academic Press.