
 ?Mathematical formulae have been encoded as MathML and are displayed in this HTML version using MathJax in order to improve their display. Uncheck the box to turn MathJax off. This feature requires Javascript. Click on a formula to zoom.
ABSTRACT
Suburban village tourism is supposed to promote happiness. However, as tourists swarm in, suburban village community spaces tend to become spaces of conflict between diverse groups. To balance development and protection, we need to understand such conflict. Spatial behavior conflict is an important index of the conflict between tourists and residents. This paper is a case study of the Shecun community. It obtains data via GPS tracking and cognitive mapping. By employing the spatial behavior conflict model and space syntax, it analyzes the spatial characteristics of the spatial behavior conflict. And lastly, it explores the paths to sustainable development in suburban villages. According to this empirical research, variations do exist in the spatial behavior conflict in Shecun community, whose spaces can be classified into five types based on their conflict intensity; and there is a positive correlation between the community space’s global accessibility and intensity of spatial behavior conflict.
1. Introduction
In recent years, rural tourism has boomed as urban residents have an increasing demand for an idyllic rural experience and the state promotes the sustainable development of rural areas. Thanks to their advantages in location, economy, transport and supporting infrastructure, suburban villages develop faster than those in remoter areas in terms of urbanization and modernization. In developing countries, suburban villages appear “both urban and rural on the one hand, but neither urban nor rural on the other” (Ucieklak-Jeż and Bem Citation2020; Kayat Citation2002). While rural tourism brings economic gains to suburban villages, excessive tourism results in spatial conflict between tourists and residents. To ensure the villages’ sustainable development, we need to pay close attention to tourism’s possible negative impacts in our planning and management practices.
In China, suburban villages refer to those villages whose rural settlements are located either entirely or partially within the urban growth boundaries. A suburban village community shares some characteristics of both tourism and community (Zhao Citation2016). As defined by Doxey (Citation1975) and Butler (Citation1980), conflicts between residents and tourists tend to increase with the development of tourism. As tourists increase, not only a crowding-out effect of village community spaces can be observed on residents, but also causing disruption to local life and culture (Macbeth Citation1997), which further leads to the commodification of rural community space(Medina Citation2003). It is worth mentioning that the commoditization of indigenous culture does not necessarily destroy its meaning (Cohen Citation1988), depending on the tourist’s preference of authenticity for shaping the landscape (Wait Citation2000), as well as the state of local culture (Harrison Citation2005). In addition, the development of rural tourism has brought problem like traffic jams and population diversity which is also reshaping the relationship between residents, tourists and the community (Huang, Stewart, and Stewart Citation1996; Luloff et al. Citation1994). It is meaningful, therefore, to identify where such spatial conflict often occurs and to achieve a balanced development of both tourism space and community space.
“Spatial conflict” has been defined as the value orientation of different organizations or individuals regarding environment or resources (Cocklin Citation1988). Different groups in a given community space take different attitudes toward different activities, hence the occurrence of spatial conflict (Bakhtiari, Jacobsen, and Jensen Citation2014; Vaske et al. Citation1995). Although many researchers have tried to explore socio-spatial conflict through an analysis of the relationship between tourism and the community (Michael and Krannich Citation1998), most researchers have approached the analysis and assessment of tourism community spaces merely through studying socio-spatial conflict and cognitive conflict (Zhang and Xu Citation2016). Understood as the conflict between the demands of different human activities, spatial behavior conflict can be interpreted as the expression of the competition for spatial resources between the incoming tourists and the local residents (Xie Citation2017). Therefore, a classification of community spaces according to their spatial behavior conflict is the first step towards the sustainable development of suburban village community spaces.
For lack of solid technological support, most existing research has been qualitative studies. However, progress in spatial analysis technologies has presented fresh opportunities. The development of advanced geospatial technologies (e.g., GIS and GPS) has inspired researchers to use GPS tracking data to explore new methods to assess spatial conflict, as it can measure people’s activity spaces as well as preferences. Despite the improvements in the methods of assessing spatial behavioral conflict, great challenges remain. While, from the perspective of spatial uncertainty, accessibility of different locations is often neglected in existing research, space syntax proves effective in making up for the deficiency. Space syntax has been developed as the mainstream method for research in spatial morphology and behavior (Hillier et al. Citation1993). Studies have used space syntax to explain the relationship between human behavior and spatial structure, and concluded that tourist activities are affected by spatial distribution and road structure (Dai, Luo, and Chen Citation2012& Li et al. Citation2016), and the number of tourists is highly correlated with road integration. To address the spatial uncertainty and identify the spatial conflict spaces, we need to consider not only people’s actual daily activity patterns, but also the environment that restricts people’s daily activities.
In view of the difficulty in obtaining rural data, this research limits itself to the spatial behavior conflict in suburban village community spaces. It aims to explore a method that combines GPS tracking and cognition survey data, objectively quantify spatial behavior conflict, and make accessibility interpretations by reference to space syntax. The results show that this method proves effective in identifying the spaces of spatial conflicts in suburban villages and can be used as a new tool to classify the conflict spaces according to their conflict intensity and explore the relationship between environment and behavior.
2. Methodology
2.1. Description of the case study
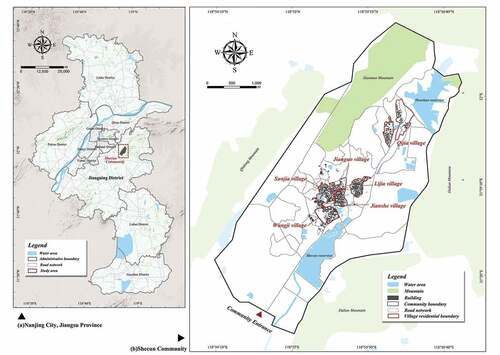
The subject of this case study is Shecun community in Nanjing, Jiangsu Province. It is among the earliest batch of pilot villages in Jiangsu Province’s “Characteristic Pastoral Villages” Program. Shecun lies in the valley between the Qinglong Mountain and the Dalian Mountain, neighboring the Shecun Reservoir, and features historic residential architecture of the Ming and Qing Dynasties as is represented by the Panshi Ancestral Temple. It is one of the existing villages that best represent the “mountains, water, and village” cluster pattern and has the richest abundance of historical and cultural elements in Jiangning District (Qi and Yu Citation2019). It is becoming increasingly popular as a suburban tourist destination; in 2019, it received more than 100,000 tourists. The Shecun community covers an area of 16.46 square kilometers and consists of six natural villages (see ) – the Sunjia Village, the Wangjia Village, the Jianshe Village, the Jianguo Village, the Lijia Village, and the Qijia Village – with a total permanent resident population of 2585. Faced with the pressure of urban expansion, tourism and resident demands, the Shecun community needs, on the one hand, to balance tourism development with the demand of protecting and developing tangible and intangible cultural heritages, and on the other hand, ensure local residents’ living standards and meet their need for socializing. According to field investigations, the activity spaces of local residents have been subject to constant infringement by tourist activity, especially during the daytime on holidays. Therefore, the Shecun community is worth studying as a typical suburban village.
Figure 1. Shecun Community (a) Location map of Shecun Community, Jiangning District, Nanjing city, Jiangsu Province; (b) The Shecun Community layout and surrounding environment.
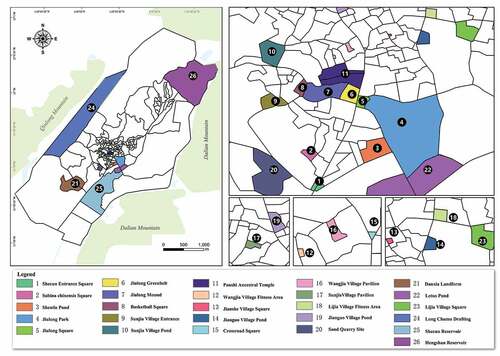
First, we conducted a preliminary on-site investigation of the community space with reference to the layout map of Shecun, and then identified a selection of sampling sites based on factors such as tourist attractions and how local residents and tourists used the spaces. In line with the typical sampling principle of the Braun-Blanquet School, we selected publicly accessible spaces and defined their boundaries mostly by forest edges and road curbs. Larger areas with less clear boundaries were defined according to their actual usage. Twenty-six tourism community space units were selected and defined. (see ).
Figure 2. Layout of the Shecun Community and space segragation.
2.2. Source of research data
Our field investigation revealed that most local residents tend to stay in certain fixed areas, which suggests that GPS tracking might make little sense in identifying their short-period behaviors; so we approached the survey via questionnaires about their cognition of the spaces. The tourists have a continuous demand for sight-seeing and are unfamiliar with the tourist attractions; so GPS tracking was used to record their complete travel trajectories, which illustrate their spatial demand accurately.
2.2.1. Data on the spatial distribution of permanent residents’ activities
The research team handed out cognitive mapping questionnaires, which bear the photos of the 26 selected community space units, to Shecun’s local residents. The concept of cognitive mapping was introduced by American psychologist Tolman, Tolman, and Edward (Citation1948). Designed to capture people’s understanding and preference about the environment (Dai and Zhang Citation2009; Gu and Song Citation2001), cognitive mapping is suitable for surveys on simple or specially-designated subjects, making the surveys easy and feasible. Therefore, this paper employs the cognitive mapping method to analyze the residents’ cognition.
With the approval of the National Ethics Committee, the research team, assisted by the Party-Public Service Center of the Shecun community, handed out a total of 1400 anonymous questionnaires to local residents from September 2019 to December 2019. 1384 effective responses were collected; the survey response rate stood at 98.8%. The central coordinates of each space units were picked up by the coordinate picking tool of Baidu Map, which were then processed by ArcGIS Pro to get a general idea about the everyday living spaces of the community residents.
2.2.2. Data on the spatial distribution of the tourists
From February 2019 to January 2020, the research team conducted three on-site tourist surveys in each month (including holidays, weekdays and weekends, when the weather is cloudy and sunny). A combination of tracking via handheld GPS units and questionnaires was used to collect the tourists’ personal temporal-spatial behavior data. Compared with cognitive mapping, the portability, diversified application and accessibility of GPS tracking has won attention from a wide range of research fields. Several studies (Shoval and Isaacson Citation2007 & Shoval et al. Citation2010; Taczanowska, Arnberger, and Muhar Citation2006) have examined GPS’s advantage in data accuracy.
Considering that most tourists arrive at the suburban tourist destination by public transit or private cars, to avoid redundant records, the surveys were conducted at the bus station and the car parking lot of Shecun. GPS handsets were handed out to 234 tourists, and 221 effective trajectories were recorded, representing an effective response rate of 94.4%. The handheld GPS handsets (Victory Technology Co., Ltd.) used in this survey had a horizontal positional accuracy of 2.5 meters for 95% of the tracking points and update at a one-second interval, capable of monitoring the tourist’s accurate time and location. After deviations were corrected and data format converted, the trajectories were loaded in ArcGIS Pro to generate the spatial distribution of 221 tourists in Shecun.
2.2.3. Data on the accessibility of the community spaces
Shecun features such a high building density that the satellite map, given the limited resolution of its publicly available version, cannot show the alleys and lanes accurately. So drones were used to get orthophoto maps and survey the site. The axial map was drawn up with AutoCAD in line with the longest axial lines principle, which sort out 1160 axial lines.
The first step of space syntax analysis is space segmentation. There are three methods, namely, convex method, axis method and view method. The axis method is widely applied in the analyses of spatial configuration and spatial morphology. Essentially, it measures the traffic activity of the road network within a given radius of space measured by steps. In order to describe the space system in detail, space syntax offers a series of quantitative indexes. Integration describes the spatial configuration on a general level. Existing research has proved that integration is an effective variable to describe spatial accessibility (Li and Guo Citation2003; Zhuang, Zhang, and Dai Citation2012). According to space syntax theory, 10% of the most integrated space is often referred to as the integrated core. In other words, spatial integration as a morphological feature determines whether a space is easily accessible (Klarqvist Citation1993). The axial lines model in space syntax analysis measures the traffic of the road network within a given radius measured by steps. This research uses UCL’s Depthmap to conduct the axial lines model analysis. In this model, the accessibility index is integration. The finished axial map was loaded in Depthmap software for processing to get the integration values of the axial lines of the entire community space.
2.3. Analysis methods
In this research, we did a lot of on-site investigations and analyses before designing the questionnaires for residents and tourists respectively. From 7:00 a.m. to 7:00 p.m., the survey observed the behavior of different people in the community space every two hours. Then we handed out GPS units to the tourists and questionnaires to the residents.
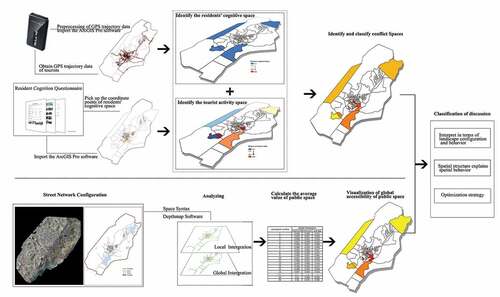
The research consists of the following major analyzing steps (see ):
Feed the survey data (the GPS tracking data for the tourists and the cognitive mapping data for the residents) into ArcGIS Pro. Analyze the tourist and resident crowd densities in the public spaces by a five-class natural breaks classification, namely, extremely high density, high density, medium density, low density and extremely low density.
Calculate the spatial behavior conflict values based on the mapping data values by reference to the Spatial Behavior Conflict (SBC) model (Li, Xie, and Wang Citation2018) (1) Load these calculated conflict values to the ArcGIS Pro database and proceed with a statistical analysis of the 26 space units. Finally, classify the spatial behavior conflict into five classes by natural breaks classification, namely, extremely high conflict, high conflict, general conflict, low conflict and extremely low conflict.
Figure 3. Analysis framework.
In the above model, and
refer to the crowd density for the residents and the tourists respectively.
The model quantifies the spatial behavior conflict between tourists and residents; According to the field survey, tourists in suburban rural communities have basically the same demands for spaces, mainly focusing on enjoying the field scenery and traditional culture. Therefore, the internal conflicts and mutual interferences within the same group are excluded from the discussion. The formula involves data of two dimensions – crowd density and ratio (Li, Xie, and Wang Citation2018). A space with a higher overall crowd density of tourists and residents combined and closer tourist and resident density values shall return a higher value of spatial behavior conflict. Spatial behavior conflict reflects the competition for spatial resources and values between various groups, and the intensity of spatial conflict is reflected in the number of people involved in the competition for spatial resources (Zhou and Peng Citation2012). Given limited spatial resources, there is a positive correlation between the overall number of people involved and the intensity of the competition for spatial resources. Furthermore, as the intensity of the competition for spatial resources varies with different groups of people, a smaller difference between the numbers of people in different groups suggests a higher intensity of spatial behavior conflict. In consideration of this, we select the crowd density of tourists and residents active in the public space as an important index.
Calculate the global integrations (r = n) and the local integrations (r = 5/r = 7) of the community spaces using Space Syntax’s Depthmap software platform. Analyze the spatial configuration and integrations. Then carry out an exploratory analysis to eliminate the extreme values so as to accurately calculate the global integration values of 26 space units.
On the basis of the above analysis and in light of the community’s spatial morphology, landscape, and crowd behavior characteristics, offer optimization strategies correspondingly from the perspective of an overall planning that involves the community space, the residents and the tourists.
3. Analysis results
3.1. Spatial distribution of the tourists and the residents
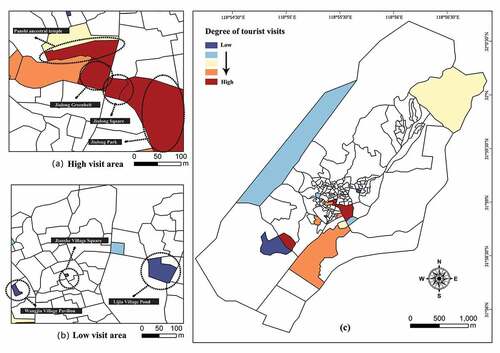
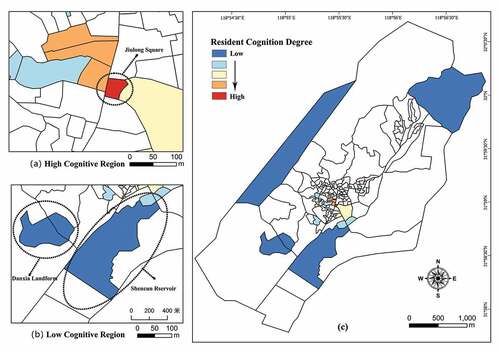
By calculating the number of tourists in the 26 analysis units, we can measure the agglomeration of tourists in each space unit and hence the spatial distribution of tourists(see )). A natural breaks classification by the GIS software platform categorizes the tourist agglomeration levels into five classes. In Shecun, tourist agglomeration is high at the Panshi Ancestral Temple, the Jiulong Square and the Jiulong Park (see )), while the spaces inside the villages are low visit areas, for instance the fitness area and the entrance square of Lijia Village (see )).
Figure 4. Spatial Distribution of Tourist Visits. (a) High visitor rate of community space; (b) Low visitor rate of community space. (c) the tourist visiting degreen of Shecun Community space.
Identify high visit spaces for the residents by summarizing the questionnaire responses and get the spatial distribution of the residents (see )). Each respondent’s visits in the spaces are labeled and converted into data by the GIS platform. As is shown in , the frequency of resident visit varies greatly from one space unit to another, which can be understood to reflect the variation in the residents’ cognition about Shecun’s public spaces. The Jiulong Square, marked in red, is an important agglomeration area for local residents (see )), while the fitness area, the reservoir, and the Longchumo Rafting area are the spaces least visited by local residents and are marked in blue (see )).
Figure 5. Spatial Distribution of Resident Cognition. (a)The community space with a high degree of resident awareness. (b)The community space with a low degree of resident awareness. (c)The resident cognition degree of Shecun Community space.
3.2. Classification of conflict spaces
The spatial behavior conflict index describes the intensity of spatial conflict in different spaces. In terms of their behavior conflict indices, the spaces fall into five classes in a descending order of the conflict intensity. As is shown in , the classification is as follows
Extremely High Conflict Areas, with large numbers of both tourists and residents and highest spatial behavior conflict indices. These include the Jiulong Square (No. 5), the Panshi Ancestral Temple (No. 11), and the Jiulong Greenbelt (No. 6) (see ));
High Conflict Areas, mainly including the Jiulong Park (No. 4), the Shentie Pond (No. 3), and the Shecun Entrance Square (No. 1) (see ));
General Conflict Areas, including the Shecun Reservoir (No. 25), the San Quarry Site (No. 20), the Danxia Landform (No. 21), the Jiulong Mound (No. 7), the Lotus Pond (No. 22), and so on (see ));
Low Conflict Areas, including the Longchumo Rafting area (No. 24), the Hengshan Reservoir (No. 26) and so on (see ));
Extremely Low Conflict Area, the Jianshe Village Square (No. 13) being the sole space in this class (see )).
Figure 6. Classification of Spatial Behavior Conflict.
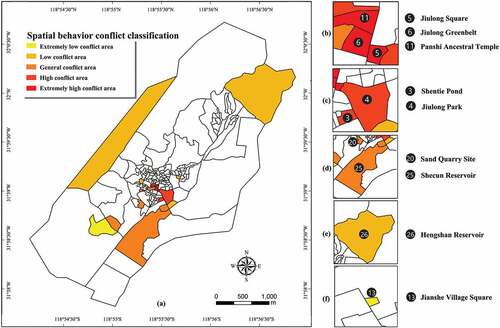
On the whole, the spatial behavior conflict is unevenly distributed over the entire space, being highly concentrated in the core development area. The conflict intensity gets lower as we move to the outer circles. Areas with high conflict (Class 1 and Class 2) are favorite spaces for tourists and residents and can easily have negative impact on the rural space. The rest areas (Classes 3 ~ 5) feature less intense conflict between local residents and tourists. We will discuss them in greater detail in the “Discussion” part.
3.3. Analysis of space accessibility
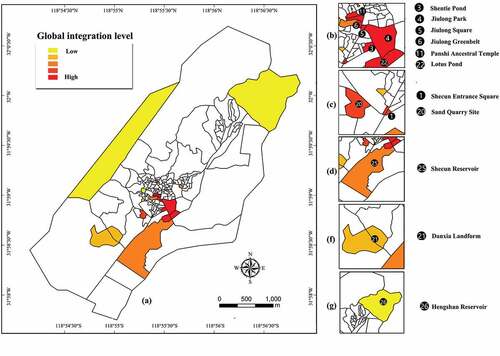
As is mentioned above, through an analysis of axial lines via the Depthmap software platform, this research analyzes the global and local integrations of Shecun. In , areas with higher integrations are marked in cooler colors, while those with lower integrations, higher permeability and better accessibility are marked in warmer colors.
According to ), the global integration value ranges between 0.212 and 0.594 and averages at 0.392. 54.22% of the axes have integrations lower than the average value, which suggests a rather ordinary level of the community space’s overall accessibility. (see )). Four roads register relatively higher global integrations, which suggests higher accessibility and higher level of activity for these roads. The central area of the Shecun community – the Wangjia Village and its surroundings – has a high global accessibility, and forms a core region of high-integration axes around space units No. 5, No. 6, No. 11 and No. 22. Global accessibility is unevenly distributed, being higher in the center and lower in the surrounding areas. Two core regions are identified through analyses of local integration when r is set at 5 and 7 respectively. (see ,)). One of them overlaps with the core region in the global integration analysis; it centers around the Wangjia Village. The other core region centers around the entrance square. It can be inferred, therefore, that the Wangjia Village is definitely the core region of the Shecun community, outweighing all other areas. Furthermore, the fact that the axes surrounding the two reservoirs in the northeast and in the southwest register lower global and local integration values can be explained by the low accessibility of these two areas as well as of their surrounding areas.
Figure 7. Global Integration and Local Integration of the Shecun Community. (a)The result of the Global Integration; (b)&(c) The result of the Local Integration; (d) Correlation analysis between spatial behavior conflict index and global integration degree.
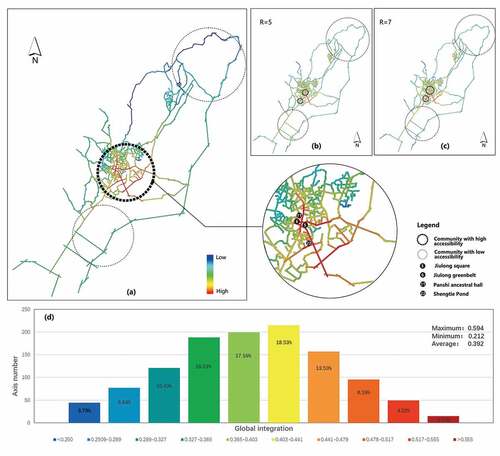
Extract the global integration values of all the axes around the 26 space units, and then carry out an exploratory analysis using SPSS software. According to the Box-whisker Plot in , there are no outliers and extreme values. Therefore, by averaging out the global integration values of the 26 space units based on their maximum and minimum values, we get the accessibility values of the 26 space units. (see )). The space units with the highest accessibility values are concentrated around the central area of the Shecun community – No.5 the Jiulong Square (0.588), No. 11 the Panshi Ancestral Temple (0.570), the Lotus Pond (0.567), No. 3 the Shengtie Pond (0.555), No. 6 the Jiulong Greenbelt (0.555), and No. 4 the Jiulong Park (0.552). (see )). The space unit with the lowest accessibility is No. 26 the Hengshan Reservoir (0.292).
Figure 8. Box-whisker Plot of Global Integration by Community Space Units.
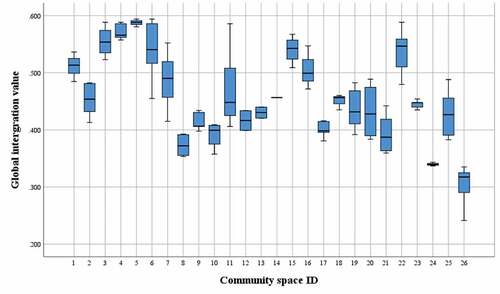
Figure 9. Global Integration of the Space Units.
4. Discussion
4.1. Classification of the areas based on the intensity of spatial behavior conflict
At present, most of the evaluation and classification methods of spatial behavior conflict are based on traditional social investigation methods (questionnaires, interviews, observations, etc.), mathematical and statistical analysis, and spatial magpping software. The activity spaces of residents can be roughly identified via a simulation based on the number of resident households and their addresses. (Li, Xie, and Wang Citation2018). This study employs a cognitive mapping method, which identifies the residents’ activity spaces more accurately. Though causes for spatial behavior conflict are varied, all of them may be attributed to the mutual interference between different groups of people who, with different activity characteristics, share and use the same geographical space, which leads to competition over spatial resources (Ruse Citation2012; Sauer Citation2004: Bess and Rallapudi Citation2007). Therefore, the spatial and behavior characteristics of the space units are discussed in detail below based on their conflict intensity.
4.1.1. Type 1 extremely high conflict areas
These are spaces with both high levels of tourist stay and high resident cognition. The focus of attention is also the focus of diverse values, which makes tension and conflict more common (Trudeau Citation2006; Paasi Citation2003). This is a phenomenon typical of suburban communities after they start to develop tourism. According to (Type 1), this type of spaces boasts elements of core tourist interest, including the historic architecture – the architectural ensemble of the Ming & Qing Dynasties – and the centuries-old cypress tree. Most tourists stay here for a relatively long time to take photos or have picnics. For the local residents, the Jiulong Square and the Jiulong Greenbelt offer an open and wide space as well as plenty of leisure facilities. Shecun’s residents, whether or not there is leisure space near their homes, tend to gather in crowded areas. “Conformist behavior” (Sherif et al. Citation1988), which features even more prominently among rural population.
Figure 10. Observed Characteristics of Different Types of Spatial Behavior Conflict Areas.
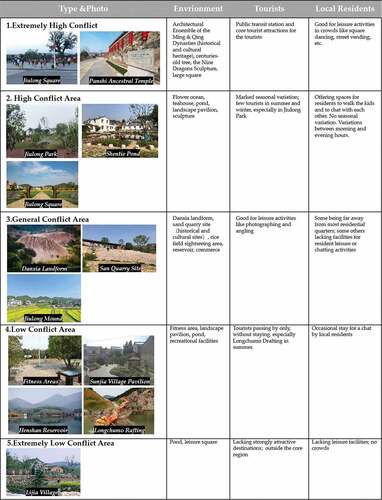
4.1.2. Type 2 high conflict areas
The only space units of this type are the Jiulong Park and the Shentie Pond. Our site visits show that tourist crowd densities in the Jiulong Park and the Shentie Pond vary markedly with the seasons due to the seasonal nature of the flower ocean formed by the ornamental plants – hairawn muhly. The green space metric with seasonality is the best space to capture the community green space (Shin, Kwan, and Grigsby-Toussaint Citation2020), while of all landscaping elements, plants are the only living elements, their effect on the landscape being seasonal, and have the biggest effect on human body (Kang, Li, and Li Citation2008). The research by Kim and Jeong reveals that this seasonal nature may give rise to varied modes of spatial consumption and affect tourist experience and the utilization of natural resources (Kim et al. Citation2018; Jeong, Jin, and Jae Citation2018)). However, this seasonality features little in local residents, who are more given to leisure activities like strolling or walking their kids.
4.1.3. Type 3 general conflict areas
The Sand Quarry, the Danxia Landform, and the Crossroad are located in areas where the Lijia Village and the Jianguo Village merge. Though small in size, they have high densities of tourists and residents. However, the tourists and the residents are active in obviously different spaces, which minimizes their mutual interference. Besides, their overall crowd densities are not high. Therefore, spatial behavior conflict in these spaces is not intense.
4.1.4. Type 4 low conflict areas
This space type has either a small number of tourists or a small number of residents, making mutual interference less possible. Spaces within the residential quarters like fitness areas, leisure squares and ponds are mainly frequented by local residents. In contrast, the Longchumo Rafting, as a tourist destination far away from the residential quarters, is mainly visited by tourists. Behavior conflict in these spaces is kept at a fairly low level. It is noteworthy, however, that though a number of fitness areas and leisure/landscape pavilions have been built in an effort to upgrade the rural residents’ living standards, they now attract few stays due to their poor spatial accessibility, low resident cognition and poor maintenance.
4.1.5. Type 5 extremely low conflict areas
This space type features both low resident cognition and low tourist visit and represents those spaces being ignored. The only space unit of this type is the Lijia Village pond. Its accessibility is, in fact, not low. However, local residents are more accustomed to going to the Jiulong Square which is not far away but more crowded, while for the tourists, the space falls outside the core tourist region and lacks attractions that appeal strongly to tourists. (Refer to Type 5 in )
4.2. Explaining spatial behavior conflict with spatial structure
It is worth further discussion to what extent a quantitative description of space syntax is helpful to our understanding of tourist and resident preferences. Due to difficulties, investigations using GPS normally do not last long. However, as human behavior is subject to a wide range of influences like weather, humidity, etc. (Ajzen Citation1991). Conversely, data obtained through a longer period of investigation give a fuller and more faithful picture of the behavior patterns being studied, which reflect, to a certain degree, the morphological structure of space. In this research, as data are obtained through an 8-month investigation, they are believed to be a generally faithful account of the tourist-resident spatial behavior conflict.
A comparison between the spatial behavior conflict map and the spatial integration map reveals a certain commonality between them (refer to ,)). Therefore, IBM SPSS Statistics 25 was used to conduct variance analysis and normal distribution test for the results of spatial behavior conflict index and the spatial integration in each space. Since all the datasets were tested for normal distribution and homogeneity of variance, Pearson analysis was used for correlation analysis. According to , Pearson correlation analysis shows a high correlation (0.707). In other words, spaces with higher spatial integrations have higher levels of spatial behavior conflict, and vice versa. Some space units are outstanding in that they involve only one category of people – either the tourists or the residents (see )). This, according to the spatial behavior conflict model, implies low levels of spatial behavior conflict, for instance the Crossroad Square (No.15) and the Lotus Pond (No.22). Our site visits show that while some landscape elements in these spaces do appeal to tourists, they hold little appeal for local residents. Therefore, in suburban villages like Shecun, space syntax analysis can offer reasonable explanations for the spatial behavior conflict.
Table 1. Correlation analysis of spatial behavior conflict and spatial integration.
Figure 11. Correlation between Global Integration and Spatial Behavior Conflict in Shecun Village. (a)Global integration of the community space; (b)Spatial behavior conflict of the community space; (c)The correlation analysis values between global integration and spatial behavior conflict.
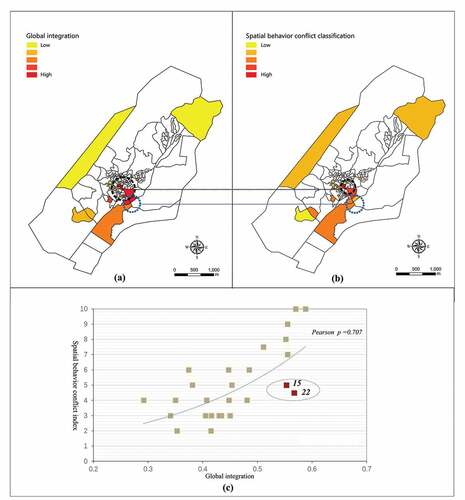
The spatial behavior conflict in Shecun can be understood as an uneven distribution of crowds, with higher densities in the center and lower in the surrounding areas. According to our on-site investigations, this is because most tourists and residents move on foot in Shecun. The pedestrians’ activity spaces are limited by their physical strength. This, coupled with the poor accessibility of many roads in the community, makes the spatial structure less effective in guiding tourist movements. In Shecun, the only unblocked and prominently accessible road is the main avenue running from north to south. Most tourists demonstrate a strong “dependence on the main path” (East et al. Citation2017),and tend to concentrate in areas surrounding the main road giving rise to spatial behavior conflict.
4.3. Optimization strategies
Optimize the spaces in a phased manner according to the classification of spatial behavior conflict (see ). Top priority shall be given to areas with high or extremely high conflict such as the Jiulong Square, the Jiulong Greenbelt, and the Panshi Ancestral Temple. The extremely high conflict spaces are attractive to both residents and tourists, but the space resources are limited. Xake Jiulong Square for an example. The local residents used to sell goods at the Jiulong Square, but have been forced to sell by setting up roadside stalls as the Square has been occupied by the tourists. It is advisable to create designated business spaces to encourage the transactions between residents and tourists.
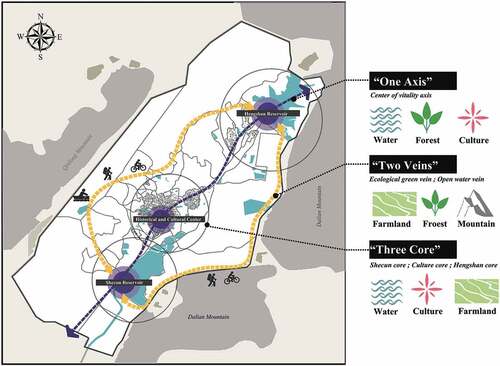
According to , some of the as-built tourist attractions fail to attract tourist visits effectively. Refer to and for spatial landscape features and behavioral features, we would suggest, in the first place, drawing up a layout plan regarding the landscape elements of the entire space. In the light of Shecun’s landscape resources (its waters, forest, rice fields, mountains, and culture), we propose a “one axis, two veins, three cores” layout structure (see ). Secondly, we suggest that the management authorities, with reference to the space syntax analysis results, improve the streets’ accessibility and signage system, and through regular activities to relieve the other spaces of the pressure of high crowd densities. It is worth noting that although this paper does not consider the conflict between the same groups, existing studies have proved that the feeling of crowding brought by too many tourists will inevitably have a negative impact on tourism itself, and have attempted to solve this problem (Zehrer and Raich Citation2016 & Li et al. Citation2017). For scenic spots neglected by tourists, for instance,the Cypress Square (No.2), is easily ignored by most tourists because, though it is marked on the tourist guide map, its entrance road is not easily noticeable, its accessibility is poor, and no activities are in place to guide the tourist flow. Tourists have a preference for clearly indicated and guided spaces(Ibon, Beatriz, and Marisol Citation2016).
Select spaces with high resident cognition by reference to . Increase the provision of land for public leisure space for the residents and hold more community activities to strengthen neighborhood feelings, while taking care to avoid waste of space. The spaces formed by the plantation could effectively influence pedestrian behaviors (Mahmoud and Omar Citation2015). Make use of the soft landscape elements such as plantation and feature walls to separate the spaces for resident activities from the tourists so as to reduce conflict.
Figure 12. Shecun Village Community Space Priority Level and Strategy.
Figure 13. A Concept Map for Shecun’s Landscape Planning.
4.4. Limitations and insights for future research
This research has some limitations. First, it is too hard to get a completely faithful layout of suburban villages, which may make the analysis less accurate. This research uses drones to get orthophoto maps, which helps make up for the partial inadequacy of the layout data. Second, while GPS tracking and cognitive mapping can identify which spaces attract visits, they cannot identify which elements (plants, signs and other factors) influence tourists’ behavior. Third, at present, no software can automatically process GPS trajectories; so, the format conversion and processing of the data can only be done manually. The job is so hard and time-consuming that it is hardly possible to deal with thousands of trajectories. Research in this regard is still in its infancy, and the interaction between the space and the user deserves further exploration. In future research, we may attempt to study the relationship between the spaces’ microenvironment characteristics and user behaviors, or by introducing the time dimension, to study the changes in the temporal-spatial behavior patterns of various groups of people in different seasons. Hopefully, such research may offer some guidance to planners and designers in a multi-dimensional manner.
5. Conclusions
As tourism develops and cities grow, more and more rural areas become “suburban villages”, which is a dynamic process. Due to their unique locations, suburban villages should adopt policies and strategies to motivate local residents and tourists to “rediscover” the spaces, guide tourists to explore those low-visit spaces, and make the spatial distribution of activity more balanced.
This research is case study of the Shecun community in Nanjing, Jiangsu. Through an almost one-year period of on-site investigation to the suburban villages, it explores and analyzes the characteristics of resident and tourist spatial behaviors. From the perspective of spatial behavior conflict, it classifies the suburban village spaces into five space types and assesses the intensity of the conflict. Finally, through a space syntax analysis, it demonstrates a positive correlation between the intensity of behavior conflict and the global accessibility. We believe, therefore, that our research has opened up a fresh perspective for understanding suburban village community spaces. It sheds some light on how to balance development and protection, and contributes to the sustainability of rural development.
Acknowledgements
We would like to thank the management department of the Shecun community for giving us their permission to do this research. We would also like to thank X. B., Z.W. and S. Z. for assistance during data collection and to thank H. W. and T.Z. for writing suggestions.
Disclosure statement
The authors declare no conflict of interest.
Additional information
Funding
Notes on contributors
Jie Zheng
Jie Zheng is a Ph.D. Student of the department of Landscape Architecture School, Nanjing Forestry University. She focuses on space and behavior.
Xuefeng Bai
Xuefeng Bai is a Ph.D. Student of the department of Landscape Architecture School, Nanjing Forestry University. He focuses on historical landscape resources.
Zhuoran Wu
Zhuoran Wu received the Master degree in Landscape Architecture from Nanjing Forestry University in 2021.He is interested in Landscape planning and design.
Shuyue Zhang
Shuyue Zhang received the Master degree in Landscape Architecture from Nanjing Forestry University in 2021.She is interested in Landscape planning and design.
Tiantian Zhang
Tiantian Zhang received a doctorate degree at Nanjing Forestry University in 2018, and she has been dedicated to research at Soochow University as a Assistant Professor. Her main research area is history of traditional Chinese gardens and Urban historical geography.
Hao Wang
Hao Wang is currently the president of Nanjing Forestry University. He focuses on landscape planning and design, ecological gardens and green space system planning.
References
- Ajzen, I. 1991. “The Theory of Planned Behavior.” Organizational Behavior and Human Decision Processes 50: 179–211. doi:10.1016/0749-5978(91)90020-T.
- Bakhtiari, F., J. B. Jacobsen, and F. S. Jensen. 2014. “Willingness to Travel to Avoid Recreation Conflicts in Danish Forests.” Urban Forestry & Urban Greening 13: 662–671. doi:10.1016/j.ufug.2014.08.004.
- Bess, R., and R. Rallapudi. 2007. “Spatial Conflicts in New Zealand Fisheries: The Rights of Fishers and Protection of the Marine Environment.” Marine Policy 31 (6): 719–729. doi:10.1016/j.marpol.2006.12.009.
- Butler, R. 1980. “The Concept of a Tourism Area Life Cycle of Evolution: Implications for Management of Resources.” The Canadian Geographer/Le Géographe Canadien 24: 5–12. doi:10.1111/j.1541-0064.1980.tb00970.x.
- Cocklin, C. 1988. “Environmental Values, Conflicts and Issues in Evaluation.” Environmentalist 8: 93–104. doi:10.1007/BF02240274.
- Cohen, E. 1988. “Authenticity and Commoditization in Tourism.” Annals of Tourism Research 15: 371–386. doi:10.1016/0160-7383(88)90028-X.
- Dai, F., and J. H. Zhang. 2009. “The Survey Methods in Planning and Design 5 - Cognitive Mapping.” Chinese Landscape Architecture 25: 98–102. doi:10.3969/j.1000-6664.2009.02.014.
- Dai, X. L., C. H. Luo, and X. J. Chen. 2012. “The Creation of Complexity in Chinese Garden.” Applied Mechanics & Materials 209-211: 380–383. www.scientific.net/AMM.209-211.380
- Doxey, G. (1975). “A Causation Theory of Visitor-resident Irritants: Methodology and Research Inferences.” Proceedings of the 6th annual conference of the travel and tourism research association, San Diego: Travel and Tourism Research Association, Whitehall.
- East, D., P. Osborne, S. Kemp, and T. Woodfine. 2017. “Combining Gps & Survey Data Improves Understanding of Visitor Behaviour.” Tourism Management 61 (Aug): 307–320. doi:10.1016/j.tourman.2017.02.021.
- Gu, C. L., and G. C. Song. 2001. “Urban Image Space and Main Factors in Beijing.” Acta GeographicaSinica 56: 64–74. In Chinese.
- Harrison, D. 2005. “Contested Narratives in the Domain of World Heritage.” In The Politics of World Heritage: Negotiating Tourism and Conservation, edited by D. Harrison and M. Hitchcock, 1–10. Clevelon: Channel View Publications.
- Hillier, B., A. Penn, J. Hanson, T. Grajewski, and J. Xu. 1993. “Natural Movement: Or, Configuration and Attraction in Urban Pedestrian Movement.” Environment and Planning. B, Planning & Design 20: 29–66. doi:10.1068/b200029.
- Huang, Y.-H., Stewart, and W. P. Stewart. 1996. “Rural Tourism Development: Shifting Basis of Community Solidarity.” Journal of Travel Research 34 (4): 26–31. doi:10.1177/004728759603400404.
- Ibon, A., P. Beatriz, and E. Marisol. 2016. “Sustainable Cultural Tourism in Urban Destinations: Does Space Matter?” Sustainability 8: 699. doi:10.3390/su8080699.
- Jeong, Y. H., K. D. Jin, and L. M. Jae. 2018. “Spatiotemporal Distribution of Urban Walking Tourists by Season Using GPS-based Smartphone Application.” Asia Pacific Journal of Tourism Research 1–15. doi:10.1080/10941665.2018.1513949.
- Kang, N., S. H. Li, and F. H. Li. 2008. “Study on the Effect of Different Landscapes on Human Psychology.” Chinese Landscape Architecture 24: 69–72. doi:10.3969/j.1000-6664.2008.07.020.
- Kayat, K. P. 2002. “Social Exchanges and Tourism in Langkawi: Rethinking Resident Perceptions.” International Journal of Tourism Research 4: 171–191. doi:10.1002/jtr.375.
- Kim, J., B. Thapa, S. Jang, and E. Yang. 2018. “Seasonal Spatial Activity Patterns of Visitors with a Mobile Exercise Application at Seoraksan National Park, South Korea.” Sustainability 10: 2263. doi:10.3390/su10072263.
- Klarqvist, B. 1993. “A Space Syntax Glossary.” Nordisk Arkitekturforskning 2: 11–12.
- Li, J., and Q. S. Guo. 2003. “A Quantitative Study of Urban Spatial Morphology Based on Syntactic Analysis.” Journal of Wuhan University (Engineering Science Edition) 2: 69–73. doi:10.3969/j.1671-8844.2003.02.017.
- Li, L., J., . Zhang, S. Nian, and H. Zhang. 2017. “Tourists’ Perceptions of Crowding, Attractiveness, and Satisfaction: A Second-order Structural Model.” Asia Pacific Journal of Tourism Research 22 (12): 1250–1260. doi:10.1080/10941665.2017.1391305.
- Li, Y., L. Z. Xiao, Y. Ye, W. T. Xu, and A. Law. 2016. “Understanding Tourist Space at a Historic Site through Space Syntax Analysis the Case of Gulangyu, China.” Tourism Management 52: 30–43. doi:10.1016/j.tourman.2015.06.008.
- Li, Y., J. C. Xie, and Q. Y. Wang. 2018. “Research on the Spatial Behavior Conflict between Tourist Community Residents and Tourists and Its Optimization Strategy: A Case Study of Gulangyu Island.” Geography and Geo-Information Science 34: 98–103. doi:10.3969/j.1672-0504.2018.01.015.
- Luloff, A. E., J. C. Bridger, A. R. Graefe, M. Saylor, K. Martin, and R. Gitelson. 1994. “Assessing Rural Tourism Efforts in the United States.” Annals of Tourism Research 21: 46–64. doi:10.1016/0160-7383(94)90004-3.
- Macbeth, J. 1997. Tourism and the District of Omeo: Final Report of the Omeo District Sustainable Community Project. Western Australia, OAI: Murdoch University, Murdoch. researchrepository.murdoch.edu.au:10022
- Mahmoud, A. H., and R. H. Omar. 2015. “Planting Design for Urban Parks: Space Syntax as a Landscape Design Assessment Tool.” Frontiers of Architectural Research 4: 35–45. doi:10.1016/j.foar.2014.09.001.
- Medina, L. K. 2003. “Commoditizing Culture: Tourism and Maya Identity.” Annals of Tourism Research 30: 353–368. doi:10.1016/S0160-7383(02)00099-3.
- Michael, D., and R. S. Krannich. 1998. “Tourism Dependence and Resident Attitudes [J].” Annals of Tourism Research 24 (4): 783–802. doi:10.1080/01490409509513257.
- Paasi, A. 2003. “Region and Place: Regional Identity in Question.” Progress in Human Geography 27: 475–485. doi:10.1191/0309132503ph439pr.
- Qi, X., and T. Yu. 2019. “The Dilemma and Suggestions for the Protection of Rural Private Ancient Buildings from the Perspective of Property Rights: A Case Study of She Village, Nanjing.” Huazhong Architecture 37: 130–133. (In Chinese).
- Ruse, M. 2012. “Rural Land Conflicts-theory and Practice.” Agricultural Management 14:69–76.
- Sauer, A. 2004. “European Nature Conservation Policy: Challenges for Local Implementation in Germany.” In Landscape Research to Landscape Planning, 173–189. Dordrecht, Netherlands: Springer. doi:10.1007/978-1-4020-5363-4_13.
- Sherif, M., O. J. Harvey, W. R. Hood, C. W. Sherif, and J. White. 1988. The Robbers Cave Experiment: Intergroup Conflict and Cooperation. [Orig. Pub. As Intergroup Conflict and Group Relations]. Middletown, America: Wesleyan University Press. https://muse.jhu.edu/book/1107. 2012.2.1
- Shin, J. C., M. P. Kwan, and D. S. Grigsby-Toussaint. 2020. “Do Spatial Boundaries Matter for Exploring the Impact of Community Green Spaces on Health?” International Journal of Environmental Research and Public Health 17: 7529. doi:10.3390/ijerph17207529.
- Shoval, N., G. Auslander, K. Cohen-Shalom, M. Isaacson, R. Landau, and J. Heinik. 2010. “What Can We Learn about the Mobility of the Elderly in the GPS Era?” Journal of Transport Geography 18: 603–612. doi:10.1016/j.jtrangeo.2010.03.012.
- Shoval, N., and M. Isaacson. 2007. “Sequence Alignment as a Method for Human Activity Analysis in Space and Time.” Annals of the Association of American Geographers 97: 282–297. doi:10.1111/j.1467-8306.2007.00536.x.
- Taczanowska, K., A. Arnberger, and A. Muhar. 2006. Exploring Spatial Behaviour of Visitors in Peri-urban Recreational Areas: Multi-attribute Analysis of Individual Route Profiles. CORP 2006 & Geomultimedia06. Vienna.
- E. C. Tolman, and C. Edward. 1948. “Cognitive Maps in Rats and Men.” Psychological Review 55: 189–208. doi:10.1037/h0061626.
- Trudeau, D. 2006. “Politics of Belonging in the Construction of Landscapes: Place-making, Boundary- Drawing and Exclusion.” Cultural Geographies 13: 421–443. doi:10.1191/1474474006eu366oa.
- Ucieklak-Jeż, P., and A. Bem. 2020. “Does “Rural” Always Mean the Same? Macrosocial Determinants of Rural Populations’ Health in Poland.” International Journal of Environmental Research and Public Health 17: 397. doi:10.3390/ijerph17020397.
- Vaske, J. J., M. P. Donnelly, K. Wittmann, and S. Laidlaw. 1995. “Interpersonal versus Social‐values Conflict.” Lsure Ences 17: 205–222.
- Wait, G. 2000. “Consuming Heritage – Perceived Historical Authenticity.” Annals of Tourism Research 27: 835–862. doi:10.1016/S0160-7383(99)00115-2.
- Xie, J. C. (2017). “Spatial Conflict Identification and Optimization in Tourism Community.” Unpublished master’s thesis, Xiamen: Xiamen University. (In Chinese).
- Zehrer, A., and F. Raich. 2016. “The Impact of Perceived Crowding on Customer Satisfaction.” Journal of Hospitality and Tourism Management 29: 88–98. doi:10.1016/j.jhtm.2016.06.007.
- Zhang, J., and H. G. Xu. 2016. “The Role Conflicts between Hosts and Guests in Home Space in Ethnic Areas, Lijiang, China.” Scientia Geographica Sinica 36: 1057–1065. (In Chinese).
- Zhao, Z. B. 2016. “Review of Research about Rural Tourism Community in China.” Economic Management 38: 166–175. (In Chinese).
- Zhou, G. H., and J. J. Peng. 2012. “The Evolution Characteristics and Influence Effect of Spatial Conflict: A Case Study of Changsha-Zhuzhou-Xiangtan Urban Agglomeration.” Progress in Geography 31: 717–723. doi:10.11820/dlkxjz.2012.06.007.
- Zhuang, Y., L. Z. Zhang, and X. L. Dai. 2012. “Correlation Analysis between the Degree of Integration of Multilevel Commercial Space and the Flow of People.” Journal of Tongji University (Natural Science Edition) 40 (11): 1620–1626. doi:10.3969/j.issn.0253-374x.2012.11.006 (In Chinese).