
 ?Mathematical formulae have been encoded as MathML and are displayed in this HTML version using MathJax in order to improve their display. Uncheck the box to turn MathJax off. This feature requires Javascript. Click on a formula to zoom.
ABSTRACT
To promote the EPC (engineering, procurement, construction) model in public projects has become a key task of China’s construction industry reform. However, the behavioral and strategic choices of stakeholders related to the EPC model will affect its stable development. We establish a tripartite evolutionary game model of government-owner-construction company, and analyze the behavioral strategies and influencing factors of these stakeholders in the development of the EPC model based on actual engineering case data. The results show that (ⅰ) there are six evolutionary stable strategies, formed from different combinations of conditions. Among them, the strategy of government incentive, owner choice, and company upgrading qualification is the most suitable for the development of the EPC model in China; (ⅱ) the relevant parameters have threshold effects, which may affect the behavioral strategies of various stakeholders. Therefore, the standards of government incentive policies must be scientific and reasonable.
Graphical Abstract
1. Introduction
The traditional project delivery method (PDM) is DBB (design-bid-build) model, which is in the order of “design, bid and build”, and is known for its low efficiency and fragmentation (Love et al. Citation2012). A series of improved, alternative PDMs have been developed, such as construction management (CM), design-build (DB), engineering procurement and construction (EPC), and integrated project delivery (IPD). However, even in the United States, where the construction market is relatively developed, the DBB model is still dominant. The design-build project delivery market share and market size report in 2014 noted that the proportion of PDM in the U.S. construction industry that adopted DBB was 52%.
With increasingly complex construction projects and increasing numbers of subjects and disciplines (Franz et al. Citation2017; Mei et al. Citation2017), the demand for an alternative PDM is increasing, especially for government-funded public projects. Due to their long term and strict regulation, public projects in most areas can only use a single DBB model. However, with the increasing demand for sustainable and high-quality development of the construction industry, it has been put on the agenda to change the single PDM in public projects; this is particularly true in China. In 2016, the “Opinions of the Ministry of Housing and Urban-Rural Development on Further Promoting the EPC Development of Projects” stated that it is necessary to deepen the reform of the organization and implementation of construction projects as well as to promote the EPC model, that construction units and government investment projects shall give priority to the EPC model, and that prefabricated buildings should actively adopt the EPC model. In 2017, the “Opinions on Promoting the Sustainable and Healthy Development of the Construction Industry” pointed out that to accelerate adoption of the EPC model of construction projects is a priority of the reform and development of the construction industry. In 2019, the Ministry of Housing and Urban-Rural Development and the National Development and Reform Commission issued the “Notice on the Management Measures for EPC model of Housing Construction and Municipal Infrastructure Projects,” clearly stating that projects with clear construction content and mature technical schemes should adopt the EPC model. A series of policies have established in principle that state-owned and government-funded public projects should actively use the EPC model.
In EPC, “engineering” includes not only the specific design work but the overall planning of a project, as well as the planning and specific work of its implementation, organization, and management (Wang and Zhang Citation2013); “procurement” refers to professional equipment and materials; and “construction” includes, for example, installation, commissioning, and technical training. The EPC model connotes that the enterprise engaged in the general contracting of a project is entrusted to carry out the whole process or several stages of its survey, design, procurement, construction, and trial operation (completion acceptance) according to the contract. The general contractor is fully responsible for the quality, safety, construction period, and cost of the project. Depending on the scope of the contract, its types include turnkey project general contracting (turnkey), design-purchasing-construction general contracting (EPC), design-construction general contracting (DB), design-purchasing general contracting (EP), and purchasing-construction general contracting (PC) (Chen et al. Citation2011; Xia, Chan, and Yeung Citation2011).
Studies have found difficulties in the use and development of the EPC model in public projects, to mainly include legal and market restrictions (Azhar, Kang, and Ahmad Citation2014; Yu, Shen, and Shi Citation2017; Khwaja et al. Citation2018), which are more obvious in China.
Legal restrictions. Although a series of policies have been issued to encourage the use of the EPC model in public projects, they have not been regulated by law. In China, public project owners are mostly local governments and their organizational departments. Due to the strict accountability system, public project owners are more willing to adopt a more mature DBB model to reduce the risks caused by noncompliance with laws and regulations.
Market constraints. The separate operation of design-procurement-construction in China has resulted in a small number of companies with EPC capabilities, which has caused a long-term lack of awareness of its advantages, and a series of problems, including the following: the design and construction units do not trust each other and cannot cooperate; the owner cares about the cost of the construction stage and ignores the cost of the project’s complete life cycle; the design unit charges fees in proportion to the cost and does not consider the reasonable cost of the project; and the construction unit just builds according to the drawings and does not provide professional and operable opinions on the design work.
As mentioned above, the development of the EPC model in public projects is a huge challenge for the Chinese government and construction industry. This complex system involves the interaction of stakeholders such as the government, project owners, and construction-related enterprises. The literature does not adequately discuss the decision-making behavior of core stakeholders in the development of the EPC model. How to promote this model from the perspective of stakeholder behavior synergy is the purpose of this paper. Obviously, the benefits brought by different behavioral decisions constitute the driving force for the behaviors of related parties. We propose an evolutionary game method to analyze the decision-making behavior of government, owners, and enterprises in the development of the EPC model.
The remainder of this paper is organized as follows. Section 2 discusses the literature on the research and evolution of PDM, influencing factors, and decision-making methods, and finds a lack of analysis of PDM from the perspective of the entire construction industry and stakeholders. In Section 3, we establish a government-owner-company tripartite game model based on the problems of developing the EPC model in China’s public projects, and theoretically analyze the equilibrium and stability of the strategic choices of core stakeholders. In Section 4, we simulate the strategic choices of stakeholders, and take the most suitable situation for China as an example to examine the key factors that affect the strategic choice of stakeholders. Section 5 discusses key factors affecting the behavior of stakeholders, countermeasures, and suggestions for the development of the EPC model in public projects in China. Section 6 discusses our conclusions, their limitations, and future prospects.
2. Literature review
Although the development stages and pace of evolution in the construction industry differ around the world, finding how best to encourage the evolution of PDM is a common problem in the construction industry.
2.1. Evolution and restriction of PDM
The literature shows that the evolution of the PDM is produced with the development of technology, social progress and the maturity of the construction industry, and it was a substitute for the traditional DBB model (Gordon Citation1994).
Under the traditional DBB model, the owner has complete control over the design and can obtain contractors with competitive prices. However, the interaction between design and construction is particularly poor, and disputes between the two parties have led to higher costs and extended construction periods. The CM model was introduced to increase the constructability of the design (Mulvey Citation1998). However, this did not significantly reduce the owner’s management workload, and the lack of ability and experience of most owners caused the DB model of a single responsible entity to emerge. What’s more, the alternative PDM has not been rapidly developed quickly enough to truly replace the mainstream status of DBB model. Kent and Becerik-Gerber (Citation2010) pointed out that PDM has developed slowly because the construction industry is accustomed to traditional leadership methods, responsibilities, and opportunities. Azhar, Kang, and Ahmad (Citation2014) maintained that legal, organizational, and technical issues have impeded the use of alternative PDM in public projects. Lena and Sward (2019) believed that the industry’s conservative nature have limited the evolution of PDM. Guo, Li, and Yang (Citation2016) analyzed the problems in the development of EPC in China, including lack of design ability of construction companies, insufficient financing, lack of general contracting management talent, lack of laws and supporting policies, low levels of construction markets, and the current construction enterprise qualification is unreasonable.
2.2. Influencing factors of PDM
Choosing an appropriate PDM can effectively improve project performance, and is an important issue (Zhu et al. Citation2020) whose influencing factors have been analyzed extensively.
Some studies rely on expert knowledge or experience to summarize these factors, which are relatively comprehensive, but lack depth. Other studies have examined the factors that influence the owner’s choice of PDM in actual projects, and have screened out factors that are specific enough but not comprehensive.
Influencing factors include project scale, complexity, uncertainty, clarity of project scope, and flexibility; schedule, cost, and quality performance objectives; clear responsibility; risk control and allocation; price competition; owner’s ability, experience, and willingness to participate and control; attitude toward disputes; market environment; policy and regulation; contractor capacity and quantity; and innovation ().
Table 1. Influencing factors.
2.3. Decision-making method of PDM
Much research has been devoted to the development of decision-making methods to help owners choose an appropriate PDM.
Most studies have constructed multi-attribute decision-making models based on the analytic hierarchy process (AHP), considering project characteristics, owner needs, and the external environment (Cheung et al. Citation2001; Khalil Citation2002; Mahdi and Alreshaid Citation2005; Noorza Citation2020). However, this does not solve the problem of ambiguous selection criteria. Some fuzzy multi-attribute decision-making models have been proposed on this basis (Ng et al. Citation2002; Chan Citation2007; Mostafavi and Karamouz Citation2010), and others have been based on knowledge and experience, using case-based reasoning (Luu, Ng, and Chen Citation2003), artificial neural networks (Chen et al. Citation2011), and other methods.
In developed countries with relatively mature construction industry markets, scholars stress how to choose the right PDM, and not its development from the perspective of the entire construction industry. In fact, although the development of the construction industry differs around the world, how to develop a more integrated and efficient PDM is a common issue. China is in the stage of comprehensive development of the EPC model, which is regarded as the key to the sustainable, high-quality development of the industry. Therefore, it is necessary to discuss how to effectively and scientifically develop the EPC model. We establish a tripartite evolutionary game model for government, project owners, and construction companies, and study the behavioral strategies and influencing factors of these stakeholders.
3. Methodology
3.1. Evolutionary game model
In behavioral science research, game theory has been widely used to explore the behavioral characteristics and strategies of stakeholders (Shan and Yang Citation2019). Traditional game theory is often used to study the strategic confrontation and competition among stakeholders, based on the premise that participants are completely rational, but this is difficult to achieve in reality. Evolutionary game theory considers the bounded rationality of decision makers and focuses on the dynamics of strategy changes, which is helpful to analyze decision behavior in multi-player game situations (Chu et al. Citation2020). It has become a common tool in social governance and enterprise management. In this study, the development of an EPC model depends on the strategic decisions of stakeholders, which makes evolutionary game theory appropriate, as it can provide mathematical solutions for different behavioral strategy situations (Du et al. Citation2020).
Evolutionary game theory combines game theory with analysis methods of evolutionary dynamics, which is closer to the behavioral patterns of realistic decision-making activities. It can more accurately reflect the dynamic equilibrium of the game behavior of bounded rational groups. The key to the evolutionary game model is to determine the mechanism adjustment of learning and strategy. When the rationality of stakeholders is relatively low or group decision-making is involved, the “replicated dynamic” mechanism of biological evolution can be used to simulate their learning and dynamic adjustment process (Shan and Yang Citation2019).
The most general continuous form of replicated dynamic equations is the differential equation,
where is the proportion of strategy
in stakeholder
,
is the expected payoff of strategy
in stakeholder
, and
is the average payoff of stakeholder
. If
reaches a stable state in iteration, then strategy
will be called an evolutionary stable strategy (ESS).
This research promotes the development of the EPC model in public projects in China. Its steps are shown in . We describe the behavioral strategies of key stakeholders, and define the benefits and costs of different behavioral strategies of the government, owners, and construction companies through research hypotheses. On this basis, the perceived benefits of each game player and the replicated dynamic equation are obtained. We analyze the equilibrium strategy and stability of the evolutionary game, and theoretically analyze the conditions for the equilibrium point to become a stable point. Through simulation and empirical analysis, we determine the relationship between the parameters through a real case, verify the stability strategy of the evolutionary game system, and determine the key factors that affect the behavioral strategy of the government, owners, and enterprises.
Figure 1. Research framework.
3.2. Problem formulation
In China, the government encourages public project owners to adopt the EPC model, which has changed the single-PDM situation of public projects. However, due to the limited rationality of stakeholders, the choice and development of the EPC model still face major obstacles.
For public project owners, PDMs have different costs and performance. The EPC model generally uses a fixed-price contract, which includes the cost of the general contractor (Wang and Zhang Citation2013). Therefore, the engineering contract cost of the EPC model usually exceeds that of the DBB model. This discourages owners from adopting the EPC model. However, the EPC model greatly reduces the time and investment of the owner in engineering organization and management-related work, and can achieve faster delivery (Zhu et al. Citation2020). If these are important to public project owners and can generate actual economic value, then the attractiveness of the EPC model to owners will increase.
Because China’s construction industry implements a qualification access system, if a construction company wants to undertake an EPC project, it usually must have all the qualifications to undertake its survey, design, and construction. As China has long implemented the separate operation of design-procurement-construction links, the number of companies with EPC qualifications is small (Yang et al. Citation2017). For most construction companies, to upgrade their qualifications to enable them to undertake EPC projects may require the establishment of new companies or the acquisition of another, which entails a significant investment. They can also contract EPC projects by forming an EPC consortium with other companies. This requires no additional investment, but reduces the owner’s trust in the company’s capabilities.
For the Chinese government, the development of the EPC model is conducive to achieving the high-quality and sustainable development of the construction industry. Therefore, promotion of the EPC model will have good external benefits. As discussed above, to implement the EPC model requires additional expenditure for project owners or construction companies, who lack motivation. The government can consider an incentive mechanism, such as positive incentives (economic subsidies, tax incentives, and credit incentives) or negative incentives (penalties and additional taxes) (Yang et al. Citation2019). At the same time, to implement incentive mechanisms has a certain regulatory cost.
3.3. Assumptions
We make the following assumptions for the analysis of the stakeholder cooperation mechanism of China’s development of the EPC model:
The game model involves three stakeholders with limited rationality: the government, project owners, and construction companies. Since the players all seek the maximum expected benefits under the premise of information asymmetry, they cannot choose the optimal strategy in only one game.
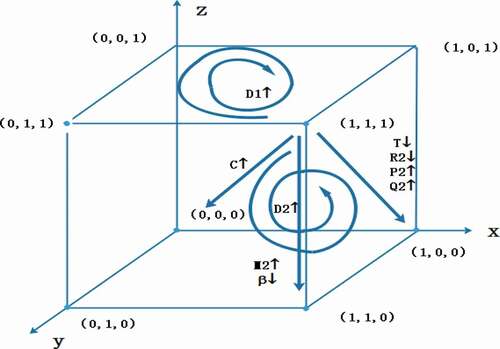
There are two main PDMs for public projects in China: DBB and EPC. Therefore, the owner’s strategic space is (choose EPC, choose DBB), where y and 1 − y are the probabilities that the owner chooses EPC and DBB, respectively. The strategic space for a construction company is (upgrade qualifications, do not upgrade qualifications), with respective probabilities z and 1 − z. The government’s strategic space is (incentive, no incentive), with respective probabilities x and 1 − x.
G represents the social benefits of engineering projects constructed using the DBB model, and B represents the increased social benefits of the EPC model compared to the DBB model. D1 and D2 represent the government subsidies to EPC project owners and construction companies, respectively. C represents the regulatory cost incurred by the government in encouraging the EPC model, and T is the punishment for projects that choose the DBB model under the incentive strategy.
For the owner, the sum of the expenses paid to construct the project, including production, organization, and management cost, is called the project transaction cost. Expenses paid to companies such as for survey, design, and construction at the contract price can be regarded as production costs. All operating and management expenditures other than production costs can be regarded as organizational management costs. For the same project, using the DBB model, the contract price of the project is P1, the organization and management cost is Q1, and the owner’s benefit is R1; using the EPC model, the contract price of the project is P2, the organization and management cost is Q2, and the owner’s benefit is R2, where
.
The difference between DBB and EPC projects is that a DBB project is completed by the survey, design, and construction companies, while these are independently completed by an EPC company for an EPC project. For a DBB project, the proportion of professionally qualified construction companies undertaking the business part is
According to the above assumptions, the payment matrix of the tripartite game is shown in .
Table 2. Payment matrix of tripartite game.
3.4. Evolutionary stable analysis
3.4.1. Replicated dynamic equation
The expected return of the government when it chooses the incentive strategy is
The expected return of the government when it chooses the no-incentive strategy is
Accordingly, the average expected return of the government is
Taking the proportion of the incentive strategy as an example, the replicated dynamic equation of the government can be expressed as
The expressions and
represent the expected return of the owner when choosing the strategies of “choose EPC” and “choose DBB,” respectively, which can be expressed as
and the average expected return of the owner is
Accordingly, the replicated dynamic equation of the owner choosing the EPC strategy can be expressed as
The expressions and
represent the expected return of the construction company when choosing the strategies of “upgrading qualifications” and “not upgrading qualifications,” respectively, and can be expressed as
The average expected return of the construction company is
The replicated dynamic equation of the construction company choosing the strategy of upgrading qualifications can be expressed as
Due to the limited rationality of the government, owner, and construction company, it is difficult for them to make the best choice in a game. Therefore, EquationEquations (5)(5)
(5) , (Equation9
(9)
(9) ), and (Equation13
(13)
(13) ) can be considered to indicate an evolutionary process, forming a tripartite replicated dynamic system. Over iterations, the government, owner, and construction company may find strategies to maximize their benefits, and eventually develop an ESS.
3.4.2. Equilibrium solution
As mentioned above, the game is constantly evolving. Hence the probabilities of any strategies chosen by the government, owner, and construction company are time-dependent, and can be expressed as , respectively. Thus the solution domain
of the replicated dynamic system, consisting of EquationEquations (5)
(5)
(5) , (Equation9
(9)
(9) ), and (Equation13
(13)
(13) ), is
.
Obviously, when all the dynamic equations are set to 0, then the entire dynamic system will tend to be stable, and the government, owner, and construction company are able to choose the optimal strategy. Therefore, the equilibrium points of the tripartite game model can be calculated as \
The equilibrium points can be identified easily by solving EquationEquation (14)(14)
(14) . Among these are eight special equilibrium points:
,
,
,
,
,
,
. All players adopt a pure strategy in each of these equilibrium points, which constitute the boundary of the domain
In addition, an equilibrium point of hybrid strategy (D9) may exist when
We derive
If . i.e., if D9 falls within the domain
, then D9 is an equilibrium point, and otherwise it will be rejected.
3.5. Asymptotic stability
The equilibrium points of the system are described in Section 3.4. However, it is uncertain whether the equilibrium points derived from the replicated dynamic equations constitute an ESS. Only when the equilibrium points simultaneously satisfy both a strict Nash equilibrium and a pure strategy Nash equilibrium will they turn into an asymptotically stable equilibrium point, called a “sink.” Consequently, since D9 is a hybrid strategy, it may not be considered a sink. Moreover, by analyzing the eigenvalues of the Jacobian matrix of the system, its asymptotic stability at the equilibrium point can be found. Among them, that all the eigenvalues of the Jacobian matrix are negative is a necessary and sufficient condition for the asymptotic stability of the system. Thus the Jacobian matrix of the tripartite dynamic game can be calculated as
where
Then, by including the eight equilibrium points D1~ D8 in EquationEquation (17)(17)
(17) , the Jacobian matrices corresponding to all equilibria can be calculated.
For, , the Jacobian matrix is
The eigenvalues of are
. According to the judgmental criterion, when
, then
is the sink, and otherwise it is a saddle point.
Similarly, the Jacobian matrix at is
The eigenvalues of are
, where
shows that equilibria
and
cannot be the sink simultaneously. When
, then
is the sink.
The Jacobian matrix at is
The eigenvalues of are
, where
shows that equilibria
and
, as well as
and
, cannot be the sink simultaneously.
is the sink only if
.
The Jacobian matrix at is
The eigenvalues of are
.
is the ESS only if
, where
shows that equilibria
and
are not the sink when
and
are the sink. According to the assumptions in Section 3.3, it can be found that
represents the cost of transforming a traditional professional construction company to an EPC construction company, and it should be greater than 0. As a result,
, is not asymptotically stable. Similarly, the Jacobian matrices of
have positive eigenvalues, and therefore, all are saddle points.
The Jacobian matrix at is
The eigenvalues of are
.
is a sink only if
. When
, the equilibria
and
are not the sink when
is the sink.
The Jacobian matrix at is
As mentioned above, is a saddle point.
The Jacobian matrix at is
The eigenvalues of are
is the sink only if
. When
, equilibria
and
cannot be the sink simultaneously.
The Jacobian matrix at is
The eigenvalues of are
is the sink only if
.
Based on the above analysis, the conditions of the six equilibrium points that may be the sink are illustrated in , and are of practical significance.
Table 3. Conditions of stability at equilibrium points.
4. Simulation and empirical analysis
Through the above theoretical analysis, six evolutionary stable strategies are identified, which can be obtained when corresponding conditions are satisfied. Among them, indicates that the government does not implement incentive measures, the owners do not choose the EPC model, and the construction enterprises do not upgrade their qualifications.
indicates that the government implements incentive measures, the owners choose the EPC model, and construction enterprises do not upgrade their qualifications.
indicates that the government does not implement incentive measures, the owners choose the EPC model, and construction enterprises do not upgrade their qualifications.
indicates that the government implements incentive measures, owners choose the EPC model, and construction enterprises do not upgrade their qualifications.
indicates that the government does not implement incentive measures, the owners choose the EPC model, and construction enterprises upgrade their qualifications.
indicates that the government implements incentive measures, owners choose the EPC model, and construction enterprises upgrade their qualifications. To intuitively observe the evolutionary trajectories of the stakeholders and their sensitivity to parameters requires the simulation of their strategies, which we did using MATLAB.
4.1. Simulation data
Before the simulation, we investigated the data of a real project in Qingdao and determined the relationships between certain parameters.
A residential development project, the total construction area is 80,000 m2. The project owner adopts the DBB model. For the owner, the project’s survey and design costs are each 1.6 million, and the construction contract price is 208 million. The total fees for agent construction, supervision, and process consulting incurred in project management are 11.81 million. We consulted some professionals with more than 15 years of industry experience, including Senior Consultant, Senior Engineer, Senior Official, Senior Director, Department Manager and Professor. shows their affiliations. It is estimated that if the project adopts the EPC model, the possible production generation (contract price) and organization and management costs will be 219.7 million and 5.1 million, respectively.
Table 4. Interviewees.
If the project bidding is in the EPC model, and the construction company wants to build the project, it can form a consortium with qualified survey and design companies at a cost of 1 million . It will cost a construction company about 1.5 to 15 million to upgrade its qualifications, depending on the level. According to the average profit level of China’s construction industry in 2020, the net profit rates of project survey, design, and construction are 2%, 3.5%, and 3.5%, respectively, and the profit rate of EPC companies is 5%. The cost paid by the owner to the construction enterprise accounts for about 98% of the total project investment.
Based on the above information, we determined the following parameters: P1 = 21, P2 = 22, Q1 = 1.2, Q2 = 0.5, M1 = 0.1, M2 = 0.25,
The investment and construction of this project can bring 10 million in social benefits to the government (e.g., providing jobs, promoting economic development). Compared to the DBB model, EPC can improve the performance level of the project and the satisfaction of all stakeholders, generating social benefits assumed to be worth 5 million. To promote the development of EPC, the government will supervise the behavior of owners and companies, at a cost of 15 million. The subsidy for owners adopting the EPC model for bidding is 5 million, and the subsidy for construction companies to upgrade their qualifications is 5 million. The penalty for owners not adopting the EPC model for bidding is 10 million. We preliminarily determine the following parameters: G = 1, B = 0.5, C = 0.15, T = 0.1, D1 = 0.05, D2 = 0.05.
4.2. Simulation results
To make the equilibrium points in meet the conditions of the evolutionary stable strategy, we assume the parameters of six cases, as shown in . Regardless of the initial strategy, the equilibrium points are ,
,
,
, and
,
is the ESS.
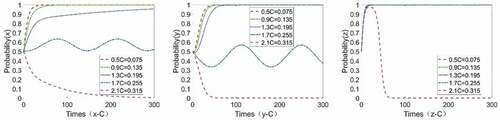
Figure 2. Evolution of government, owner, and company at , Scenario I: C = 0.15, T = 0.1, D1 = 0.05, D2 = 0.05, R1 = 25, R2 = 25.1, P1 = 21, P2 = 22, Q1 = 1.2, Q2 = 0.5, M1 = 0.1, M2 = 0.25,
.
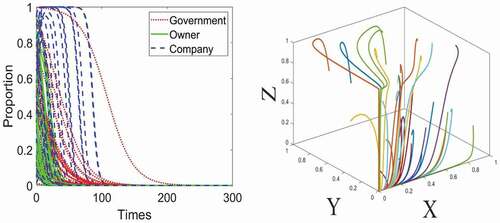
Figure 3. Evolution of government, owner, and company at , Scenario II: C = 0.05, T = 0.1, D1 = 0.05, D2 = 0.05, R1 = 25, R2 = 25.1, P1 = 21, P2 = 22, Q1 = 1.2, Q2 = 0.5, M1 = 0.1, M2 = 0.25,
.
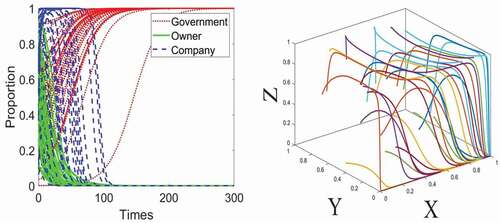
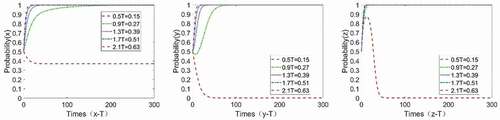
Figure 4. Evolution of government, owner, and company at , Scenario III: C = 0.15, T = 0.1, D1 = 0.05, D2 = 0.05, R1 = 25, R2 = 25.5, P1 = 21, P2 = 22, Q1 = 1.2, Q2 = 0.5, M1 = 0.1, M2 = 1.5,
.
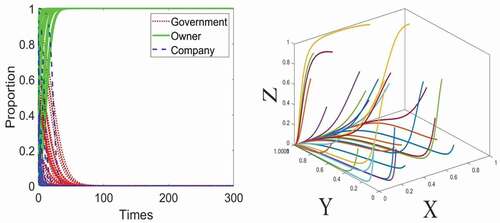
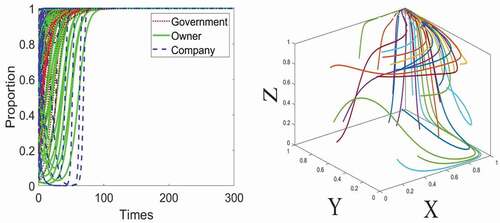
Figure 5. Evolutionary of government, owner, and company at , Scenario IV: C = 0.15, T = 0.3, D1 = 0.05, D2 = 0.05, R1 = 25, R2 = 25.1, P1 = 21, P2 = 22, Q1 = 1.2, Q2 = 0.5, M1 = 0.1, M2 = 1.5,
.
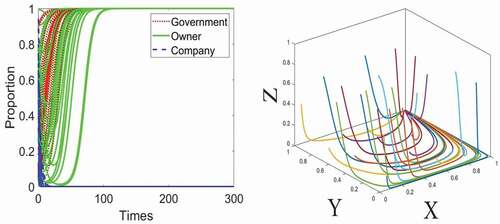
Figure 6. Evolution of government, owner, and company at , Scenario V: C = 0.15, T = 0.1, D1 = 0.05, D2 = 0.05, R1 = 25, R2 = 25.5, P1 = 21, P2 = 22, Q1 = 1.2, Q2 = 0.5, M1 = 0.1, M2 = 0.25,
.
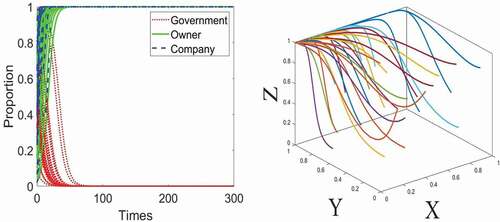
Figure 7. Evolution of government, owner, and company at , Scenario VI: C = 0.15, T = 0.3, D1 = 0.05, D2 = 0.05, R1 = 25, R2 = 25.1, P1 = 21, P2 = 22, Q1 = 1.2, Q2 = 0.5, M1 = 0.1, M2 = 0.25,
.
4.3. Sensitivity analysis
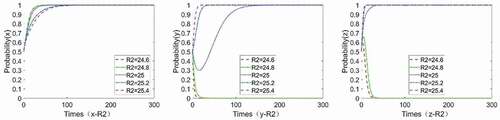
As mentioned above, the promotion and development of the EPC model is important to the reform of China’s construction industry. The government hopes to promote the model’s acceptance by owners and architectural enterprises through active measures. Thus is the stable state to be achieved by the tripartite game system. A sensitivity analysis of the involved parameters will enhance the perception of the research problem. We changed initial parameter values, observed their influence on ESS, and sorted out the crucial factors for
. It should be noted that when we analyze the sensitivity of a parameter, its value should meet the conditions in , while the values of the other parameters are as in scenario VI (). Assume that the initial policy probabilities of the government, owners, and construction companies are 0.5. The sensitivity of their strategic choices to parameters is as follows.
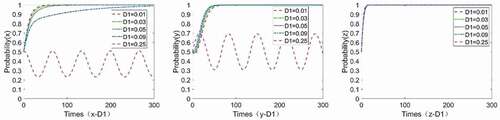
As shown in , as the cost of supervision increases, the government’s ability to subsidize projects and construction companies declines, resulting in a decrease in government incentives, which in turn reduces the owners’ willingness to adopt the EPC model for bidding, and construction companies’ willingness to upgrade to EPC qualifications. The cost of supervision generally has the greatest impact on the government’s strategy, while the impact on construction companies is small. Moreover, the lower the government’s regulatory cost, the faster its incentive strategy will converge. As the cost of supervision increases, the strategies of the government and owners will fluctuate, and the system cannot form a stable strategy. When the cost of supervision further increases to a certain extent, the ESS changes from (1, 1, 1) to (0, 0, 0).
Figure 8. Sensitivity analysis of government, owners, and companies to C.
As shown in , the probability that the owner adopts the EPC model for bidding increases with the punishment. At this time, the construction company will choose to upgrade to the qualifications required by EPC. Punishment measures generally have the greatest impact on the owner’s behavior strategy, and the greater the punishment, the faster that strategy will converge. However, when the penalty for owners who adopt the DBB model for bidding is too small, and the owners think that the DBB model for bidding can still obtain higher returns, the owners will not use the EPC model for bidding, and accordingly, construction companies will not seek to upgrade qualifications. At this time, the ESS changes from (1, 1, 1) to (1, 0, 0).
Figure 9. Sensitivity analysis of government, owner, and companies to T.
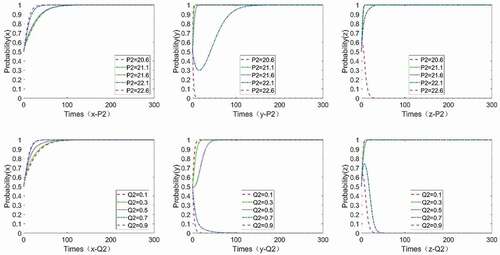
As shown in , subsidies for EPC projects have the greatest impact on the government’s strategies, followed by the owners. Generally speaking, owners’ willingness to adopt the EPC model for bidding will increase as with government subsidies for EPC projects. With the increase in subsidies, the convergence of the government strategy slows down, and the convergence of the owner strategy becomes faster. However, when the subsidy intensity reaches a certain level, the social benefits brought by EPC will not be obvious, thereby reducing the government’s willingness to subsidize the project, and affecting the owner’s strategy. The system will gradually enter shocks and cannot form a stable ESS, so the stability point will not change.
Figure 10. Sensitivity analysis of government, owner, and companies to D1.
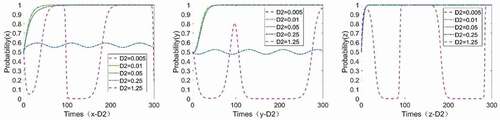
As shown in , the willingness of construction companies to upgrade to EPC qualifications will increase with government subsidies. With an increase in subsidies, the convergence of the government and owner’s strategies generally slow down, and the convergence of the company becomes faster. However, incentives to subsidize construction companies seem to have little impact on their strategies, and they will actually have a greater impact on the strategies of the government and owner, possibly because the effect of the subsidy is not obvious, and the government will continue to increase the subsidy intensity. When the subsidy intensity reaches a certain level, the social benefits will not be obvious, which will reduce the government’s subsidy intensity to construction companies, leading to the lack of enthusiasm of construction companies to upgrade to EPC qualification. The insufficient number of EPC construction companies further reduces the likelihood that the owners will use the EPC model for bidding. In order to support the development of EPC, the government will need to continue to increase subsidies; then, the willingness of construction enterprises to upgrade the EPC qualification will increase, and the number of owners choosing EPC will also increase. When the subsidies reach the level that the government can afford again, the willingness of construction enterprises to upgrade the EPC qualification will decrease with the reduction of government subsidies … and the whole system is oscillating. Therefore, the system still has only one stable point (1, 1, 1).
Figure 11. Sensitivity analysis of government, owner, and companies to D2.
As shown in , as the benefits of EPC projects increase, owners’ willingness to adopt the EPC model for bidding increases, which leads to greater willingness of construction companies to upgrade to EPC qualifications, thereby reducing the possibility of government supervision. The benefits of the EPC model generally have the greatest impact on owners, followed by construction companies. Moreover, the greater the benefits the EPC model brings to owners, the faster the convergence of the corresponding strategies of the owners and construction companies, and the slower the convergence of government strategies. When the profit of the EPC model decreases to a certain extent, the stable point changes from (1, 1, 1) to (1, 0, 0).
Figure 12. Sensitivity analysis of government, owner, and companies to R2.
As shown in , when the EPC model is adopted, an owner facing a higher contract price and management cost is less willing to use it for bidding, and construction companies are less willing to upgrade to EPC qualifications, thereby increasing the possibility of supervision. The contract price and management cost of the EPC model generally have the greatest impact on the owner’s strategy, followed by construction companies. Moreover, the smaller the contract price and management cost of the EPC model, the faster the convergence of the strategies of owners and construction companies, and the slower the convergence of the government’s strategies. To a certain extent, when the EPC model construction contract price and management cost are large, owners are unwilling to choose the EPC model for bidding, which affects the strategy of construction companies. At this time, the system stable point changes from (1, 1, 1) to (1, 0, 0).
Figure 13. Sensitivity analysis of government, owner, and companies to P2, Q2.
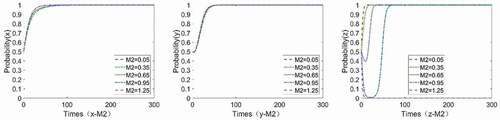
As shown in , the cost of upgrading EPC qualifications has the greatest impact on construction companies. As this cost increases, the willingness of companies to transform decreases. Moreover, the greater the cost of upgrading qualifications, the slower the strategies of construction companies will converge. When this cost increases to a certain level, the stability point changes from (1, 1, 1) to (1, 1, 0), indicating that construction companies are more willing to undertake EPC projects by forming a consortium.
Figure 14. Sensitivity analysis of government, owner, and companies to M2.
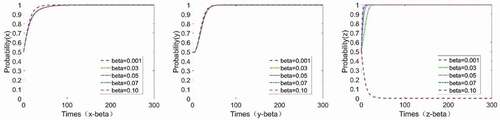
As shown in , the profit rate of EPC projects has the greatest impact on the behavioral strategies of construction companies, and as this increase, so does the willingness of companies to upgrade EPC qualifications. Moreover, the greater the profit rate of EPC projects, the greater the convergence rate of corporate strategies. However, when the profit rate is reduced to a certain level, the stable point changes from (1, 1, 1) to (1, 1, 0).
Figure 15. Sensitivity analysis of government, owner, and companies to β.
5. Discussion
5.1. Key influencing factors
The above sensitivity analysis shows that every parameter involved in the system may be a key influencing factor, which depends on the evolutionary stable state of stakeholders in the system. Among them, C, D1, D2, and T are the key parameters that affect the government strategy; T, R2, P2, Q2, D1, D2, and C will affect the owner’s strategy; and M2, β, R2, P2, and Q2, are the key parameters that affect corporate strategy. Once the key parameters change the stable conditions at (1, 1, 1), the strategies of the stakeholders in the system will change. describes the evolving trend and the key influencing parameters. This gives us the inspiration that the key parameter settings must be reasonable. An inappropriate incentive mechanism will destroy the cooperative relationship between stakeholders, and will play no useful role. Therefore, the introduction of government subsidies and punishment standards must be scientific.
Figure 16. Evolving trend influenced by key parameters.
(1) For the government, the cost of supervision necessary to implement incentives is the most critical factor in its behavioral strategies because, although the demonstration effect and social benefits produced by EPC projects are the fundamental driving force for the government to implement incentive policies, it is difficult to directly quantify economic value for such positive external social benefits. Therefore, the cost of supervision highly affects the government. If the cost of supervision is low, then the government is certainly willing to obtain higher social benefits at a lower cost. However, too high a cost of supervision will directly affect or even change the government’s strategic choice. Therefore, in the early stage of the development of China’s EPC model, to seek ways to reduce supervision costs is the key to influencing the government’s implementation of incentive policies.
(2) For owners, although punishment measures are a better incentive than subsidies, the Chinese government is more inclined to induce rather than to introduce compulsory institutional changes. We do not recommend strict or severe punishment for owners who do not adopt the EPC model. Research also shows that the practice of substituting one model for another is not worth promoting. Although the EPC model will produce good benefits, not all projects show such performance. According to the above results, the benefits of EPC projects are the second most important factor in the strategic choice of owners. Research shows that the benefits of the EPC model include good communication and sharing of information, fewer disputes with better resolution, a shorter construction period, transfer of risks, and better investment efficiency. Many of these benefits cannot be quantified and are easily ignored by owners in decision-making. Therefore, to enable owners to correctly recognize this value is the key to effectively motivating them to choose the EPC model.
(3) For companies, it is not difficult to find that the cost of upgrading to EPC qualification is the key to their decision-making choice. If the EPC model is to be well promoted and developed, there must be a group of excellent EPC companies. However, there are relatively few such companies in China. According to interviews with industry insiders, the acquisition and maintenance of qualifications currently has a large cost, and it is difficult for many small and medium-sized companies to maintain the required technical personnel, office space, and equipment. Therefore, it is necessary to create a good market environment and lower the entry barriers for EPC construction companies.
6. Conclusion
The EPC model has been widely adopted in the world and is important for the high-quality development of China’s construction industry. However, the evolution of the EPC model is complex, and it involves multiple stakeholders. We considered how to promote the development of the EPC model in China’s public projects as a research problem, and established a tripartite game model of government-owner-construction enterprise from the perspective of stakeholders in its development. The results support the following conclusions.
Among the eight equilibrium points obtained by the tripartite game model are six possible stable points:
From the sensitivity analysis, it can be seen that the supervision cost of implementing incentives has an important impact on the behavioral strategy of the government, which should pay attention to reducing the supervision cost when designing incentive schemes. The government’s punishments and the benefits of the EPC model have an important impact on the behavior of owners. A penalty is an effective strategy, but it is more ideal to convince owners of the value brought by the EPC model, which will incentivize them to choose it. The cost required to upgrade to EPC qualification has an important impact on the behavioral strategies of construction enterprises. The government is committed to reducing the market access threshold and costs of the EPC model, which will be conducive to its development.
This study contributes to both the theory and practice of stakeholder decision-making behaviors for the development of the EPC model. A tripartite evolutionary game model is theoretically established to better study the behavioral strategies of stakeholders in the construction industry. We have identified the key factors that influence their behavior in the development of the EPC model, and provided research hypotheses for future empirical studies. Our results emphasize the role of government incentive strategies to promote the development of the EPC model, and provide a theoretical basis for the government to formulate reasonable punishment and reward measures.
This study has several limitations. We cannot validate our conclusion that the government can promote the development of the EPC model in public projects through incentives, although it is consistent with most studies. This is because, at the national level, the Chinese government’s policies are mainly exhortations, and there are no economic incentives. However, to our surprise, with the continuous development of the EPC model, Chinese provinces are starting to introduce economic incentives, such as the “General Contracting Management Measures for Housing Construction and Municipal Infrastructure Projects” issued by Shandong Province on 13 July 2020. However, the effects of policies are not immediately apparent, and it takes time to evaluate them. We will continue to statistically verify their effectiveness. The decision-making behavior of stakeholders in this study is based on maximizing economic benefits, which may not represent behavior in all scenarios. In reality, decision-making may be based on other principles, such as social responsibility and public interest, which should be considered in future research. The tripartite game model constructed in this paper can aid in the analysis of key factors of PDM development in different countries. However, the research object is specific to China and ignores differences from development levels of the construction industry in other countries. The research conclusion can serve as a reference for developing countries or those with an underdeveloped construction industry, but cannot be used directly.
A successful EPC project must have a good benefit and risk distribution mechanism to maximize the synergy of stakeholders. The current EPC model is in the early stage in China. Although there is policy support, the associated management system, methods, and social credit system are not yet perfected. This will have an impact on the behavioral evaluation and decision-making of various stakeholders. It provides a direction for the in-depth study of the influencing factors and mechanisms of the EPC model development in the future.
Disclosure statement
No potential conflict of interest was reported by the author(s).
Additional information
Funding
References
- Azhar, N., Y. Kang, and I. U. Ahmad. 2014. “Factors Influencing Integrated Project Delivery in Publicly Owned Construction Projects: An Information Modelling Perspective.” Fourth International Symposium on Infrastructure Engineering in Developing Countries, IEDC. Procedia Engineering 77: 213–221. doi:10.1016/j.proeng.2014.07.019.
- Bygballe, L. E., and A. Sward. 2019. “Collaborative Project Delivery Models and the Role of Routines in Institutionalizing Partnering.” Project Management Journal 50 (2): 161–176. doi:10.1177/8756972818820213.
- Chan, C. T. W. 2007. “Fuzzy Procurement Selection Model for Construction Projects.” Construction Management and Economics 25 (6): 611–618. doi:10.1080/01446190701209933.
- Chen, Y. Q., J. Y. Liu, B. Li, and B. Lin. 2011. “Project Delivery System Selection of Construction Projects in China.” Expert Systems with Applications 38 (5): 5456–5462. doi:10.1016/j.eswa.2010.10.008.
- Cheung, S.-O., T.-I. Lam, Y.-W. Wan, and K.-C. Lam. 2001. “Improving Objectivity in Procurement Selection.” Journal of Management in Engineering 17 (3): 132–139. doi:10.1061/(ASCE)0742-597X(2001)17:3(132).
- Chu, X., Z. Shi, L. Yang, and S. Guo. 2020. “Evolutionary Game Analysis on Improving Collaboration in Sustainable Urban Regeneration: A Multiple-stakeholder Perspective.” Journal of Urban Planning and Development 146 (4): 4020046. doi:10.1061/(asce)up.1943-5444.0000630.
- Demetracopoulou, V., W. J. O’Brien, and N. Khawaja. 2020. “Lessons Learned from Selection of Project Delivery Methods in Highway Projects: The Texas Experience.” Journal of Legal Affairs and Dispute Resolution in Engineering and Construction 12 (1): 4519040. doi:10.1061/(asce)la.1943-4170.0000340.
- Du, L., Y. Feng, W. Lu, L. Kong, and Z. Yang. 2020. “Evolutionary Game Analysis of Stakeholders’ Decision-making Behaviours in Construction and Demolition Waste Management.” Environmental Impact Assessment Review 84: 106408. doi:10.1016/j.eiar.2020.106408.
- Franz, B., R. Leicht, K. Molenaar, and J. Messner. 2017. “Impact of Team Integration and Group Cohesion on Project Delivery Performance.” Journal of Construction Engineering and Management 143 (1): 1–12. doi:10.1061/(asce)co.1943-7862.0001219.
- Gordon, C. M. 1994. “Choosing Appropriate Construction Contracting Method.” Journal of Construction Engineering and Management-ASCE 120 (1): 196–210. doi:10.1061/(ASCE)0733-9364(1994)120:1(196).
- Guo, H., R. Li, and J. Yang. 2016. “Research on Development Status, Strategic Route and Strategic Measures of EPC in China’s Construction Industry Based on Competitive Strategy Theory.” 2016 International Conference on Smart City and Systems Engineering (ICSCSE), 140–143. doi:10.1109/ICSCSE.2016.76.
- Hashim, M., M. C. Y. Li, N. C. Yin, N. S. Hool, S. M. Heng, and T., . L. Yong. 2006. “Factors Influencing the Selection of Procurement Systems by Clients.” International Conference on Construction Industry, 1–10.
- Kent, D. C., and B. Becerik-Gerber. 2010. “Understanding Construction Industry Experience and Attitudes toward Integrated Project Delivery.” Journal of Construction Engineering and Management 136 (8): 815–825. doi:10.1061/(ASCE)CO.1943-7862.0000188.
- Khalil, M. I. A. 2002. “Selecting the Appropriate Project Delivery Method Using AHP.” International Journal of Project Management 20 (6): 469–474. doi:10.1016/S0263-7863(01)00032-1.
- Khwaja, N., W. J. O’Brien, M. Martinez, B. Sankaran, J. T. O’Connor, and W. B. Hale. 2018. “Innovations in Project Delivery Method Selection Approach in the Texas Department of Transportation.” Journal of Management in Engineering 34 (6): 5018010–5018011. doi:10.1061/(asce)me.1943-5479.0000645.
- Liu, B., T. Huo, Q. Shen, Z. Yang, J. Meng, and B. Xue. 2015. “Which Owner Characteristics are Key Factors Affecting Project Delivery System Decision Making? Empirical Analysis Based on the Rough Set Theory.” Journal of Management in Engineering 31 (4): 5014018. doi:10.1061/(asce)me.1943-5479.0000298.
- Liu, B., B. Xue, T. Huo, G. Shen, and M. Fu. 2019. “Project External Environmental Factors Affecting Project Delivery Systems Selection.” Journal of Civil Engineering and Management 25 (3): 276–286. doi:10.3846/jcem.2019.7460.
- Love, P. E. D., D. J. Edwards, Z. Irani, and A. Sharif. 2012. “Participatory Action Research Approach to Public Sector Procurement Selection.” Journal of Construction Engineering and Management 138 (3): 311–322. doi:10.1061/(ASCE)CO.1943-7862.0000440.
- Luu, D. T., T. Ng, and S. E. Chen. 2003. “A Case-based Procurement Advisory System for Construction.” Advances in Engineering Software 34 (7): 429–438. doi:10.1016/s0965-9978(03)00043-7.
- Mafakheri, F., L. Dai, D. Slezak, and F. Nasiri. 2007. “Project Delivery System Selection under Uncertainty: Multicriteria Multilevel Decision Aid Model.” Journal of Management in Engineering 23 (4): 200–206. doi:10.1061/(asce)0742-597x(2007)23:4(200).
- Mahdi, I. M., and K. Alreshaid. 2005. “Decision Support System for Selecting the Proper Project Delivery Method Using Analytical Hierarchy Process (AHP).” International Journal of Project Management 23 (7): 564–572. doi:10.1016/j.ijproman.2005.05.007.
- Mei, T. T., Q. K. Wang, Y. P. Xiao, and M. Yang. 2017. “Rent-seeking Behavior of BIM-and IPD-based Construction Project in China.” Engineering Construction and Architectural Management 24 (3): 514–536. doi:10.1108/ecam-11-2015-0178.
- Mostafavi, A., and M. Karamouz. 2010. “Selecting Appropriate Project Delivery System: Fuzzy Approach with Risk Analysis.” Journal of Construction Engineering and Management 136 (8): 923–930. doi:10.1061/(asce)co.1943-7862.0000190.
- Mulvey, D. L. 1998. “Project Delivery Trends: A Contractor’s Assessment.” Journal of Management in Engineering 14 (6): 51–54. doi:10.1061/(asce)0742-597x(1998)14:6(51).
- Ng, S. T., D. T. Luu, S. E. Chen, and K. C. Lam. 2002. “Fuzzy Membership Functions of Procurement Selection Criteria.” Construction Management and Economics 20 (3): 285–296. doi:10.1080/01446190210121288.
- Nguyen, P. H. D., D. Tran, and B. C. Lines. 2020. “Fuzzy Set Theory Approach to Classify Highway Project Characteristics for Delivery Selection.” Journal of Construction Engineering and Management 146 (5): 4020044. doi:10.1061/(asce)co.1943-7862.0001829.
- Noorza, E. 2020. “Performance Analysis of Alternative Contracting Methods for Highway Construction Projects: Case Study for Iran.” Journal of Infrastructure Systems 26 (2): 4020003. doi:10.1061/(asce)is.1943-555x.0000528.
- Puerto, C. L. D., D. D. Gransberg, and J. S. Shane. 2008. “Comparative Analysis of Owner Goals for Design/build Projects.” Journal of Management in Engineering 24 (1): 32–39. doi:10.1061/(asce)0742-597x(2008)24:1(32).
- Qiang, M., Q. Wen, H. Jiang, and S. Yuan. 2015. “Factors Governing Construction Project Delivery Selection: A Content Analysis.” International Journal of Project Management 33 (8): 1780–1794. doi:10.1016/j.ijproman.2015.07.001.
- Shan, H., and J. Yang. 2019. “Sustainability of Photovoltaic Poverty Alleviation in China: An Evolutionary Game between Stakeholders.” Energy 181: 264–280. doi:10.1016/j.energy.2019.05.152.
- Touran, A., D. D. Gransberg, K. R. Molenaar, and K. Ghavamifar. 2011. “Selection of Project Delivery Method in Transit: Drivers and Objectives.” Journal of Management in Engineering 27 (1): 21–27. doi:10.1061/(ASCE)ME.1943-5479.0000027.
- Touran, A., K. R. Molenaar, D. D. Gransberg, and K. Ghavamifar. 2009. “Decision Support System for Selection of Project Delivery Method in Transit.” Transportation Research Record 2111 (1): 148–157. doi:10.3141/2111-17.
- Wang, Z., and X. Zhang. 2013. “Disscussion on EPC Project Management Model.” 2013 Fourth International Conference on Intelligent Systems Design and Engineering Applications, 277–279. doi:10.1109/isdea.2013.467.
- Xia, B., A. P. C. Chan, and J. F. Y. Yeung. 2011. “Developing a Fuzzy Multicriteria Decision-making Model for Selecting Design-build Operational Variations.” Journal of Construction Engineering and Management 137 (12): 1176–1184. doi:10.1061/(asce)co.1943-7862.0000381.
- Yang, J., L. Song, X. Cui, and X. Li. 2017. “An Analysis of Promoting Project Delivery Approach Based on Evolutionary Game Theory.” Journal of Engineering Management 31 (4): 6–11.
- Yang, X., J. Zhang, G. Q. Shen, and Y. Yan. 2019. “Incentives for Green Retrofits: An Evolutionary Game Analysis on Public-private-partnership Reconstruction of Buildings.” Journal of Cleaner Production 232: 1076–1092. doi:10.1016/j.jclepro.2019.06.014.
- Yu, T., G. Q. Shen, and Q. Shi. 2017. “Comparing the Performance Quality of Design-bid-build and Design-build Delivery Methods.” Journal of Construction Engineering and Management 143 (4): 4016111. doi:10.1061/(asce)co.1943-7862.0001262.
- Zhu, J. W., L. N. Zhou, L. Li, and W. Ali. 2020. “Decision Simulation of Construction Project Delivery System under the Sustainable Construction Project Management.” Sustainability 12 (6). doi:10.3390/su12062202.