
 ?Mathematical formulae have been encoded as MathML and are displayed in this HTML version using MathJax in order to improve their display. Uncheck the box to turn MathJax off. This feature requires Javascript. Click on a formula to zoom.
ABSTRACT
In this study, a big data analysis model was developed to predict the risks associated with overseas projects and a big data analysis technique. The risk analysis model can estimate the probability-cost interval for a planned project’s final cost by forming a probability density function and project costs through comparative analysis of data for a planned project and data for a previous similar project. This study attempted to collect a vast amount of information from the web and social networking services (SNS) in order to verify whether this information is sufficient to support the use of the web data analysis method used in this model. To this end, it was assumed that regional traffic conditions would be indicated on the web and SNS. In addition, two regions with different traffic conditions were selected, and then traffic-related keywords and words to enable assessment of traffic conditions were examined. Text information including these words was collected and the proportions of positive and negative words were analyzed. Results confirmed that two regions with different traffic conditions also had different numbers of negative words exhibited on the web.
1. Introduction
Construction projects involve potential risks due to their extremely complex and uncertain characteristics (Flanagan, Norman, and Chapman Citation2006; Mills Citation2001; Banaitiene and Banaitis, Citation2012). In particular, overseas construction projects have higher uncertainty in terms of risks because project operators lack the necessary experience for implementing projects at overseas construction sites and have difficulty obtaining sufficient information about their environments (Shuying Citation2009). In specific terms, they do not have accurate information on previous related projects, which makes it impossible to identify and control risk factors under changing conditions (Chen and Yang Citation2020). They are exposed to a wide range of risks that include not only external risks such as politics and the environment, but also internal risks that are inherent in their projects (Zhi Citation1995). These risks frequently change, resulting in the generation of numerous datasets. There is a constant influx of information due to data changes influenced by environmental factors and the increased execution of overseas projects. However, this fact often goes unrecognized, and thus potentially useful information may be considered insignificant and neglected.
Because the vast amounts of information produced in the construction industry (Lee, Jeong, and Ryoo Citation2019), there are many existing studies that investigated cost-relevant risks using big data analytics such as machine learning-based prediction. However, few studies have attempted to forecast the operational cost risk of overseas projects using big data. Therefore, the purpose of this study is development of bigdata analysis model for predicting operational risk in overseas projects.
Overseas construction projects would largely benefit from big data analysis techniques for risk prediction. Business feasibility can be projected using a range of regional information items that becomes available through advanced data storage and sharing technologies as well as websites. The risks of planned projects can be identified by analyzing changing data for influencing factors. There are existing studies that used deterministic models to investigate the project risks. However, many companies still suffer losses from overseas projects due to operational risks. That because the current execution of new projects is merely based on data generated from previous projects or data from participants. Even if various real-time web datasets are stored, they just remain as vast amounts of data without any identification of particular significance. Risks that could be fully managed through big data are neglected and necessary data items are abandoned without being utilized. Therefore, analytical capabilities are required to predict the risks of planned projects through data classification. Most of project’s relevant information is based on texts, and it needs additional big data analytics techniques to identify influencing factors. In response to this need, this study aimed to develop a big data analysis model to predict risks associated with overseas projects. This analysis model estimates risks (project costs) through comparative analysis of web data for a planned project and data generated from a previous similar project. As such, a risk analysis model and a web data-based big data analysis technique for overseas construction projects are proposed in this study.
2. Literature review
Despite project planners’ understanding of risk identification methods and assessment models, they should still pay sufficient attention to selecting an appropriate risk assessment model. To address this, the author proposed a framework to determine an optimal risk assessment model. Dikme developed a cost risk assessment model to decide on proper price increases for bidding (Dikmen, Birgonul, and Han Citation2007). The author developed a general risk model to estimate operational risks that exceed costs and introduced risk assessment procedures using fuzzy logic. In addition, a risk register model was developed to effectively manage risks generated within a construction project. This comprised a platform that enabled the recording of risks throughout a construction project and identification tools as a source of quantitative and qualitative risk data. As a source of data on risk responses, tracking, and control, this model made it possible to implement outcome-based measures and evaluate the efficiency of specific responses. Lee proposed a methodology for extracting potential risks involved in the project owner’s project requirements based on analysis of bidding documents (Lee, Son, and Yi Citation2015. The author developed a method for automatic detection and extraction of project risks before their materialization using text mining techniques. However, this method only allowed identification of project-oriented risks while suffering from limitations in terms of the ability to create a project-oriented dictionary and database. In addition, risk analysis models for various elements of the construction industry’s management scope, including costs (Lee and Kim Citation2003), processes (Nasir, McCabe, and Hartono Citation2003), and exchange rates (Han, Park, and Yeom Citation2013), have been developed.
Ko developed an analysis model to provide stable and highly consistent inputs in the establishment of construction process plans (Ko and Han Citation2015). The author analyzed the applicability of statistical methodologies, and based on the results, built a database for a construction process monitoring system. Lee analyzed existing studies of the analysis of big data and proposed an appropriate big data analysis model for the construction industry. This consisted of a diagram of big data analysis models by which to implement construction projects based on existing big data research patterns. It indicated the range of big data usage in the general construction industry that enabled acquisition of information from construction project-related data and web data using data analysis techniques. However, this model simply presented the construction industry’s big data research patterns without explaining the model’s applicability.
He Zhi developed a method of managing various risks for overseas construction projects(Zhi Citation1995) And Ngo developed a big data and predictive analytics capability assessment tool that can measure construction organizations’ capability in big data and predictive analytics implementation and that also highlights strengths and weaknesses of the organization to provide a benchmark in the process of big data and predictive analytics implementation(Ngo, Hwang, and Zhang Citation2020). This is a study that evaluates the analysis capability, and there was a limit to the risk analysis of the project. Nieto-Morote et. al. presents a risk assessment methodology based on the Fuzzy Sets Theory, which is an effective tool to deal with subjective judgment, and on the Analytic Hierarchy Process (AHP), which is used to structure a large number of risks(Nieto-Morote and Francisco Citation2011). This study is methodologically different from big data analysis. Park et. al. presents the comparative analysis results for the project performance and risk focusing on the large-sized public apartment housing projects(Park et al. Citation2015).
3. Methodology
This study proceeds as follows.
- Constructing a method of classifying data from a huge number of data.
- Proposing quantitative methods to convert the range of influences of various risks.
- Proposing quantitative methods to integrate the various risk influencing factors evaluated.
- Creating a simulation algorithm.
-Verifying the algorithm through the case study
4. Risk analysis models for overseas construction projects
The analysis model developed in this study estimates project costs probabilistically by analyzing factors influencing project risks. In this model, prior to implementation of a planned project, the respective region’s data are collected and analyzed in comparison with the data for a previous similar project.
The analysis model can be divided broadly into the data classification phase and the project cost estimation phase. In the data classification phase, data are collected and classified. As shown in , the data for the previous similar project are imported through the planned project’s information. Here, it is assumed that every item of data from the overseas construction project that had been conducted in the past has been collected and constitutes big data formed using the same analysis method as the current simulation. The collected data require comparative analysis for risk prediction. To this end, the analysis objects should be selected and then the data classified accordingly. The objects should be selected in a manner that includes factors that influence project costs such as transportation, weather, prices, and civil complaints. The collected data are classified to extract necessary items based on selected factors. This data classification process is necessary because the collected data are huge and random in nature. These data are primarily classified by factor and then secondarily classified according to the grades for evaluating traffic conditions. Grade-based classification is needed to estimate the probability density function for risk prediction. For instance, the general evaluation of traffic conditions can be either “good” or “bad.” The answers of “good” and “bad” become the measures for evaluating traffic as well as the grades for data classification. In light of this, five grades of “worst”, “bad”, “normal”, “good”, and “best” are employed for this study and the collected data classified according to these grades. The data from the previous similar project are indicated as “project (n), traffic” because they are regarding traffic-related factors for each project.
Figure 1. Data collection and classification.
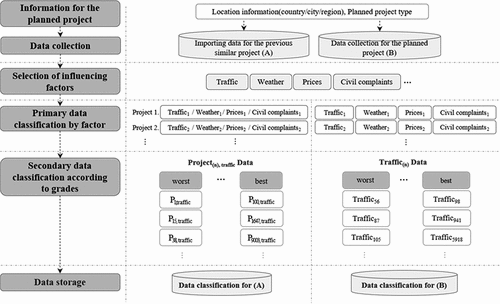
Once every influencing factor in the previous similar project is fully classified, data on the planned project are collected and classified. First, data are collected by inputting the basic information necessary to conduct the project, including location, building usage, and area. The collected data are then classified according to each influencing factor identified from the previous similar project, as well as according to each grade. The planned project’s data are indicated as “traffic(n)”.
After data classification is completed for every influencing factor, simulations are performed to estimate project costs. In the project cost estimation phase, the planned project’s final cost is estimated as per the previous similar project’s probability-cost interval. In this study, the simulation process is explained by choosing “traffic” among the factors influencing construction project costs.
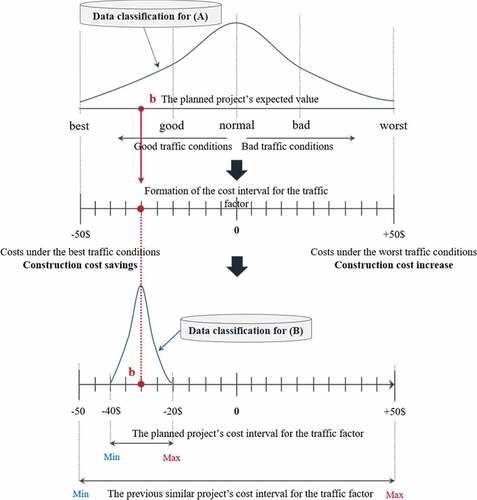
First, factors that influenced the previous similar project are selected as shown in . The data for the previous similar project, earlier classified according to grade, are imported to form the probability-cost interval for the selected factor. These data are formed from the previous project using the same analysis method as the current simulations and indicate the project’s evaluation results and corresponding costs. The classified data form the previous similar project’s probability density function, and the mix-max interval is formed based on cost data corresponding to this function. The previous project’s function for the traffic factor can estimate the traffic factor’s min-max cost interval by forming the cost interval that corresponds to the grades according to traffic conditions. The best traffic conditions lead to the minimum cost and the worst traffic conditions result in the maximum cost. Once the function for the traffic factor is estimated through the previous project’s classified data, the expected value (b) of the probability density function is obtained using the planned project’s classified data. The traffic cost interval can be estimated by substituting b into the previous project’s traffic cost interval, and based on the outcome, form the planned project’s function. The planned project’s traffic cost interval occurs within the previous similar project’s cost interval, formed from all traffic conditions.
Figure 2. The probability-cost interval for the traffic factor.
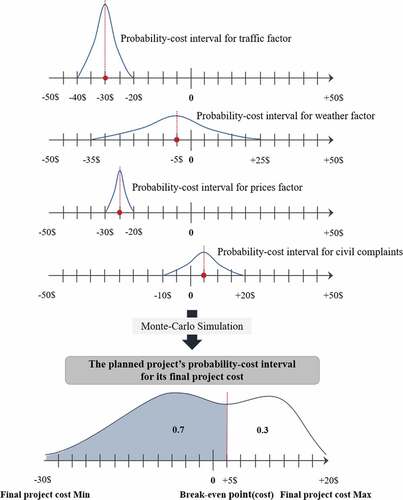
After the probability-cost interval for the traffic factor is formed, the probability-cost interval is then formed through this process for all influencing factors such as weather, prices, and civil complaints, as presented in . Based on this, the probability-cost interval that enables prediction of the final project cost is formed by performing a Monte-Carlo Simulation. This interval makes it possible to estimate the final project cost probabilistically and identify the project’s projected success and failure rates using the probability density function. In other words, when the break-even point is +5$ as in , the planned project should have a 70% probability of making a profit and a 30% probability of not making a profit. This estimation also allows identification of the planned project’s risks (project costs).
Figure 3. Estimation of the probability-cost interval for the final project cost.
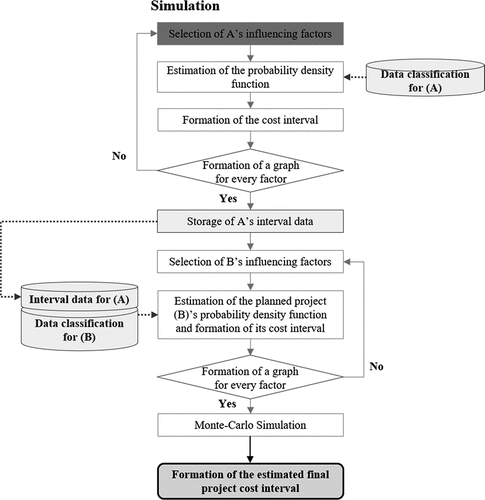
As explained earlier, the planned project’s risks (project costs) can be estimated through the simulation shown in .
Figure 4. The analysis model’s simulation of the estimation of risks (project costs).
Risk analyses for influencing factors using the analysis model developed in this study require long-term data collection with a big data platform. In this study, however, a big data analysis technique is proposed to introduce an analysis model that enables prediction of project costs through short-term big data analysis. The scope of this technique is confined to various types of information related to specific regions of the web and text information on social networking services (SNS).
In the case of a big data analysis performed by selecting the traffic factor, based on average traffic conditions, traffic risks can be divided into negative risks that hinder project execution and positive risks that facilitate projects under good traffic conditions. Here, the accurate definition of average traffic conditions requires a wealth of regional information. In this study, therefore, two comparable regions and two construction projects that were underway in these regions were selected and analyzed. These projects were the Grand Manhattan Hotel Project in the center of Ho Chi Minh, Vietnam and the Nha Be Project in the outskirts, 10 km away from the Grand Manhattan. They are conducted within the same living area and share very similar conditions in various aspects such as the price of raw materials and labor costs. However, they have different traffic conditions. The Grand Manhattan Hotel Project may suffer from poor traffic conditions due to its downtown location, whereas the Nha Be Project should have relatively good traffic conditions. In other words, these two projects are placed under different traffic conditions, and thus are likely to have different risks.
This study assumes that regional traffic conditions during data collection would be indicated on the web or SNS. Regarding the two construction projects, this assumption makes it possible to evaluate their traffic conditions based on the sentences that describe them. Therefore, this study intended to ascertain whether this assumption is true.
First, the amounts of negative words used with traffic-related words in the two regions were examined. If there is a significant difference in the proportion of negative words used in traffic-related sentences in relation to the two regions, the locals may view that the two regions have different traffic conditions. In this way, big data on the web can help identify the traffic conditions of regions in which project operators have no experience. Based on this, the null hypothesis that “two regions with different traffic conditions have no difference in the number of negative words used in sentences that include traffic-related words” was formulated to prove the claim that “two regions with different traffic conditions have a difference in the number of traffic-related negative words shown on the web.” This test should be performed on positive words as well. The null and alternative hypotheses for the test are as follows:
Test 1
Test 2
First, words related to the two regions were examined on webpages and SNS to test these hypotheses. More than 600 of road and building names within 5 km of the project sites such as “Cô Giang”, “Sala Stadium” were examined.
In addition, sentences that included keywords for describing traffic and words for assessing traffic were collected. As shown in , the frequency of positive or negative words that were likely used when traffic conditions were mentioned was also examined among the total words that comprised the sentences. If the two regions showed a significant difference in the proportion of these words used to describe them, they may have differences in both traffic conditions and risks.
Table 1. Words for evaluation by phase.
Generally, when information is randomly extracted from the web, two regions will have different numbers of sentences and words that describe them, and thus comparing the frequency of the collected words is meaningless. Therefore, it is necessary to analyze the proportion, instead of the frequency, of words for testing. Accordingly, for each of the two regions (A: Grand Manhattan Hotel, B: Nha Be), the region’s proportion of positive words was produced by dividing the number of positive words by the total number of words collected for the region. This way, the proportion of each type of words was calculated. As shown in , the collected words were divided into 14 negative and eight positive words, and their respective proportions were analyzed. According to the analysis of the proportion of each type of words, on average, the proportion of positive words used was 0.0288 for region A and 0.0502 for region B, and the proportion of negative words used was 0.0149 for region A and 0.0054 for region B, as shown in .
Table 2. Descriptive statistics.
As noted earlier, this study assumed that different traffic conditions can lead to different expressions in sentences that mention them. Moreover, any significant difference in testing the hypothesis may indicate regional differences in traffic risks. To verify this, a T-test was conducted on the mean proportion of positive or negative words. In addition, a paired t-test was performed on the same word for each of the two regions to minimize the difference between more and less frequently used words. For example, “bad” is generally more frequently used than “worst”, and thus their frequencies can show a large difference. To minimize this gap, the proportion of the word “worst” used for region A was only compared with the same word, “worst”, used for region B. As shown in , the test results for the two regions showed t-values of 2.416 and 3.472, respectively, and p-values of 0.046 and 0.002, respectively, in the two-tail test. Therefore, both the null hypotheses(,
) could be rejected. Accordingly, the earlier claim of “two regions with different traffic conditions have a difference in the number of traffic-related negative words shown on the web” was accepted. This signifies that text information collected from webpages and SNS is useful for risk prediction.
Table 3. Result of paired T-test(2-tailed).
5. Discussion
This study proposed a method of finding the operational risk of a construction project from numerous data on the web such as SNS. This study defined the factors that are related to risk. In addition, risk was evaluated using various texts used together with factors. The factors that influence the risk are summarized as probability distribution. The algorithm proposed in this study using Monte Carlo simulation is valid. However, it was necessary to verify the method of judging regional operational risk using a huge number of data. In the case study, it was investigated whether the risk could be assessed by using the words used together with the influencing factors. This study found that text information collected from webpages and SNS is useful for operational risk prediction. This approach can be effectively used to assess the risk of overseas projects.
6. Conclusion
In this study, a big data analysis model was developed to predict risks associated with overseas projects. This model estimates a planned project’s risks (project costs) by comparing web data for a planned project and a previously conducted project. The analysis model is divided broadly into data classification and project cost estimation phases. Data for the planned and previous similar projects are collected, and then classified by influencing factors. The classified data for the previous similar project form a probability density function that can produce a corresponding cost interval. The probability-cost interval is then formed by substituting the planned project’s data. Once the probability-cost interval is formed for every influencing factor, the probability-cost interval for the final project cost can be estimated through simulations. The data analysis method used for the analysis model developed in this study uses data that can be extracted from various types of information on the web and SNS text information which are related to specific regions. However, it is impossible to identify whether these data are significant enough to be used for the data analysis model. Therefore, this study assumes that regional traffic conditions will be described on the web or SNS to ascertain whether big data collected from the web can represent the traffic conditions of regions in which project operators have no experience.
To this end, two regions with different traffic conditions within the same life zone were selected and words related to the two regions were examined on webpages and SNS. In addition, keywords for describing traffic and words for evaluating traffic conditions were selected and divided into positive and negative words. Text information including these words were then collected and the proportions of positive and negative words were analyzed. Results established that “two regions with different traffic conditions have a difference in the number of traffic-related negative words shown on the web.” Accordingly, this study confirmed the effectiveness of a project risk analysis method analyzing random web data using the keywords of factors that influence the planned project. The present study’s results will be very useful for the execution of overseas projects because its analysis model enables prediction of project costs. In addition, the application of the web data analysis technique proposed in this study will assist in the extraction of significant data through analysis of random information on the web. This study had limitations in data collection. If data is collected over the next few years, the research results will be even more meaningful.
Disclosure statement
No potential conflict of interest was reported by the author(s).
Additional information
Funding
References
- Banaitiene, N., and A. Banaitis. 2012. “Risk Management in Construction Projects.” Risk Management - Current Issues and Challenges 429–448. doi:10.5772/51460.
- Chen, W. L., and C. O. Yang. 2020. “Effective Risk Analysis for Delivering Overseas Engineering Procurement-construction Projects in an Unexplored Market.” IOSR Journal of Business and Management 22(1): 41–55.
- Dikmen, I., M. T. Birgonul, and S. Han. 2007. “1. Using Fuzzy Risk Assessment to Rate Cost Overrun Risk in International Construction Projects.” International Journal of Project Management 25(5): 494–505. doi:10.1016/j.ijproman.2006.12.002.
- Flanagan, R., G. Norman, and R. Chapman. 2006. Risk Management and Construction. 2nd ed. Oxford: Blackwell Pub.
- Han, S. H., H. K. Park, and S. M. Yeom. 2013. “Risk-Integrated Cash Flow Forecasting for Overseas Construction Projects.” KSCE Journal of Civil Engineers 18(4): 875–886. doi:10.1007/s12205-014-0464-8.
- Ko, Y., and S. Han. 2015. “Development of Construction Performance Monitoring Methodology Using the Bayesian Probabilistic Approach.” Journal of Asian Architecture and Building Engineering 14(1): 73–80. doi:10.3130/jaabe.14.73.
- Lee, D., K. Jeong, and B. Y. Ryoo. 2019. “Current Status and Future Opportunities for Big Data Research in the Construction Industry.” International Journal of Innovative Technology and Exploring Engineering 8(8): 744–775. https://www.ijitee.org/wp-content/uploads/papers/v8i8s2/H11240688S219.pdf
- Lee, D. U., and Y. S. Kim. 2003. “A Study on the Cost Risk Analysis Method for Construction Projects.” Korea Journal of Construction Engineering and Management 4(4): 201–2011.
- Lee, J. H., J. H. Son, and J. S. Yi (2015). “Multilevel Project-oriented Risk-mining Approach for Overseas Construction Project’s Preemptive Action.” CIB W78 Conference 2015. Eindhoven, The Netherlands, 336–343.
- Mills, A. 2001. “A Systematic Approach to Risk Management for Construction.” Structural Survey 19(5): 245–252. doi:10.1108/02630800110412615.
- Nasir, D., B. McCabe, and B. Hartono. 2003. “Evaluating Risk in Construction–Schedule Model (ERIC–S): Construction Schedule Risk Model.” Journal of Construction Engineering and Management 129(5): 518–527. doi:10.1061/(asce)0733-9364(2003)129:5(518).
- Ngo, J., B. G. Hwang, and C. Zhang. 2020. “Factor-based Big Data and Predictive Analytics Capability Assessment Tool for the Construction Industry.” Automation in Construction 110: 103042. doi:10.1016/j.autcon.2019.103042.
- Nieto-Morote, A., and R. Francisco. 2011. “A Fuzzy Approach to Construction Project Risk Assessment.” International Journal of Project Management 29(2): 220–231. doi:10.1016/j.ijproman.2010.02.002.
- Park, H. S., D. Lee, S. Kim, and J. L. Kim. 2015. “Comparing Project Performance of Design-build and Design-bid-build Methods for Large-sized Public Apartment Housing Projects in Korea.” Journal of Asian Architecture and Building Engineering 14(2): 323–330. doi:10.3130/jaabe.14.323.
- Shuying, L. 2009. “Risk Management for Overseas Development Projects.” International Business Research 2(3): 193–196. doi:10.5539/ibr.v2n3p193.
- Zhi, H. 1995. “Risk Management for Overseas Construction Projects.” International Journal of Project Management 13(4): 231–237. doi:10.1016/0263-7863(95)00015-I.