
 ?Mathematical formulae have been encoded as MathML and are displayed in this HTML version using MathJax in order to improve their display. Uncheck the box to turn MathJax off. This feature requires Javascript. Click on a formula to zoom.
ABSTRACT
The present study investigated a specific mall in Chengdu with diverse opaque outdoor surface colors (black, dark grey, dark green, navy blue and yellow). It was revealed that different colors had a variation effect and energy-saving mechanism on the cooling energy saving ratio in hourly, daily, monthly and annual dimensions. These results revealed that for the whole year, the annual cooling load exhibited a differential change. For the whole day, as affected by meteorological factors, especially wind speed, and when the solar radiation is the same, the daily cooling energy saving amounts presented two branches. The global horizontal radiation has a significant positive influence on the daily cooling energy saving amount, but the daily cooling energy saving ratio was not significant. At the hourly level, due to the leading role of wind speed and the diffuse radiation-to-global solar radiation ratio, the hourly cooling energy-saving amount and hourly cooling energy-saving rate presented different branches. When the hourly horizontal solar radiation was the same, the lower the wind speed, the greater the cooling energy savings. Furthermore, the higher the diffuse radiation-to-global solar radiation ratio, the greater the cooling energy savings.
Graphical Abstract
1. Introduction
The building envelope is an important part of the interface system that divides the internal and external space of the building, and constitutes the building entity. Approximately 50% of the energy is directly transmitted outdoors through the building envelope (Zhou and Li Citation2020). In summer, a large amount of outdoor heat is transferred inside the building via the external wall, and a significant amount of energy would be consumed to remove the surplus heat (Huang, Hao, and Li Citation2017). The thermal design of the building surface is essential to reducing the energy consumption of air conditioning. Authorities have reported that in commercial buildings, the power demand of air-conditioning systems account for 40%-50% (Li, Yang, and Ning Citation2019).
The coating is composed of colorants and other chemical components. Due to the chemistry and mineralogy of colorants, it also absorbs and reflects different parts of the solar wavelength spectrum (Uemoto, Sato, and John Citation2010). When the coating is applied to the outer surface of buildings, it is directly affected by solar radiation. Meanwhile, the color of the building surface has a significant impact on the thermal performance of the building, because it determines the amount of absorbed solar radiation and its transmission to the building. (N. K. Bansal,S. N. Garg and S. Kothari). Therefore, a color of coating is closely related to solar radiation and building energy consumption.
Building external wall coating has three main functions, including beautifying the building, protect the building from environmental damage and affect the building’s energy consumption. The coating can be defined by its color and material, so the main factors that determine the color and material of building coating are 1. Appearance. 2. Weatherability 3. Energy-saving.Building surface materials are responsible for absorbing solar radiation and partial heat exchange rate with the environment. The passive effect of materials in building envelope is the key factor of heat balance and a possible way to improve building energy efficiency (Yuan, Farnham, and Emura Citation2015). More and more scholars have found that the impact of building coatings on urban heat Island effect, building energy demand, and greenhouse gas production can not be ignored, and have also conducted a lot of researches on it. With the increasingly serious environmental pollution in recent years, building energy conservation has attracted more and more attention. Therefore, coating from the perspective of solar radiation and energy-saving was chosen to study. Through the research, some rational suggestions to architectural designers can be given. Although only the perspective of energy saving is studied, it is equally important to the appearance and the weatherability which determine the color and material of the coating. There is no contradiction between the three factors, and coordination and consideration can be achieved.
The change in building surface albedo has an impact on the building itself, its surrounding environment, and even its urban environment. First, building albedo combined with other factors comprehensively affects outdoor thermal comfort (Shashua-Bar, Tsiros, and Hoffman Citation2012). Increasing the albedo of the building surface can reduce the comfort of the open space around the building and the pedestrians (Taleghani Citation2018; Falasca et al. Citation2019). Second, the researchers simulated the glare of external walls with different albedo, and found that the high reflective external walls in an urban environment can increase the daylight glare probability of pedestrians (Sahar, Mariam, and Rania Citation2019). Researchers have considered that the degree of solar reflected glare produced by different exterior wall surface materials differs. Mirror materials reflect more sunlight, when compared to glazing surfaces (Luisa and Jan. Citation2014). Third, the change in building surface albedo has an impact on the urban canyon heat trap. The selection of materials with different reflection or diffusion characteristics can change the direction of sunlight reflection, thereby changing the energy reflected by the canyon (Castellani et al. Citation2020). In an urban canyon, the color of diffusion materials on the surface of the building envelope changes from deep to light, which reduces the surface temperature and air temperature, thereby alleviating the urban heat Island effect (Morini et al. Citation2018). It can be seen that the key to the influence of surface colors on the building lies in the selection of them. The proper choice can make the color play a positive role in the influence of the building and the environment.
The thermal performance of the building envelope depends on the combination of thermal resistance, insulation thickness, and location, external surface color, etc. At the same time, there is a mutual influence between them, many scholars have carried out relevant research: Yuan et al. researched both the surface reflectivity and insulation thickness of exterior walls for six representative cities of Japan (Yuan. et al. Citation2016). Li et al. considered that high reflective coatings are especially suitable for cooling objects with low thermal resistance (Li et al. Citation2007). Mitja et al. found that solar absorptivity has a significant effect on the total energy use, especially in the case of high thermal transmittance of the enclosure (Mitja et al. Citation2018). The above researches show that: The higher the albedo of the coating, the lower the temperature of the external surface of the wall; moreover, under the same albedo condition, the lower the thermal resistance of the wall, the lower the temperature of the external surface. The coating reduces the external surface temperature by increasing the albedo. However, if the surface insulation layer increases, this effect will be weakened. That is: under the condition of high albedo, the increased insulation thickness (lower heat transfer coefficient) has a negative effect on the cooling load. In other words, for the existing buildings and new buildings with better thermal insulation performance, increasing the external surface reflectance is conducive to alleviating the urban heat Island effect, but the significant reduction of building cooling load and air conditioning energy consumption is weakened.
A surface energy-saving design is an effective approach for commercial buildings to reduce the energy consumption of air conditioning. Domestic and foreign scholars have explored passive energy-saving technology to reduce building energy consumption. The influence of large-area green roofs has been investigated on power consumption (Coma et al. Citation2016). Some studies have compared the thermal properties of a green roof and a common roof of a small concrete room with night ventilation (Jiang and Tang Citation2017). A number of studies have also applied biomimetic strategies to building envelopes, which offers a high potential in reducing energy demand (Al-Obaidi et al. Citation2017). Some researchers have investigated the efficiency of natural ventilated double-skin facades (Souza, Souza, and Rodrigues Citation2018). These studies can effectively reduce the cooling load. However, there is a certain increment in construction cost. Most of these studies did not consider and demonstrate the cost and benefit of passive energy-saving technology.
With the improvement in passive energy-saving technology, scholars have focused more attention on the adaptive behaviour of static strategies based on material properties, including researches on the reflection or absorption characteristics of light that affect the internal structure of materials. Those researches can be divided into four categories, and one of these categories focus on the energy saving effect of ordinary coatings. A study evaluated the thermal performance energy savings improvement that can be obtained by coupling different roof colors with night ventilation (Guo et al. Citation2020). Some researchers analysed the effect and performance of different reflective coatings of building envelopes in the context of indoor thermal comfort and energy efficiency (Mansouri, Belarbi, and Bourbia Citation2019). A concrete roof was studied using different values of solar absorptance and an intermediate layer of phase change materials. The different coatings were found to change the maximum interior surface temperature and cooling load (Triano-Juárez et al. Citation2020). The backside temperature of the board was calculated when the solar reflectance changed, and it was found that changes in solar reflectance have an enhanced impact on the surface temperature range of the tile. Furthermore, there were single and combined effects of orientation and solar absorption on the dynamic thermal characteristics of various wall configurations (Takebayashi, Moriyama, and Sugihara Citation2012). In most of these studies, the researchers reached a consensus that black and white materials have different temperature and energy consumption effects. However, at present, no study has been conducted on the lateral correlation and influence mechanism among the colors of the coating.
In the second category, the researchers investigated the influence of the same color, but different reflective properties of coatings on a sample’s temperature and energy consumption or building surface. Some researchers (Shen, Tan, and Tzempelikos Citation2011; Guo et al. Citation2012; Cozza et al. Citation2015) have conducted experimental comparisons between ordinary coatings and coatings with different reflective properties, and demonstrated the influence on indoor environment, heat gain and building energy consumption. These studies revealed that the increase in coating albedo leads to decreased surface temperature and energy consumption. Furthermore, some researchers reported that prototypes with IR pigments have higher solar reflectance, when compared to standard concrete prototypes. Moreover, these could maintain lower surface temperatures, with respect to non-IR samples (Rosso et al. Citation2017). These researches focused on the influence of the change in building coating materials with different reflective properties on the heat transfer of building envelopes. However, there is lack of research on the different influences between ordinary and reflective coatings on the surface temperature and energy consumption of buildings when the coating color is changed.
The third kind of research focused on the influence of the solar radiation absorptivity on building temperature and energy efficiency. A model was been employed to demonstrate the influence of the solar radiation absorptivity (from 0 to 1) on a south wall. It was found that the optimum value resulted in a maximum time lag of 0.2, and when the solar absorption was 1, the time lag was at the minimum (Kontoleon and Bikas Citation2007). Some researchers compared the monthly and annual thermal loads of simulation buildings in Shanghai without retro-reflective materials coating and with retro-reflective materials coating (Yuan, Farnham, and Emura Citation2015). Other researchers investigated the temperature reduction effect and optical properties over the solar spectrum of two newly developed cool white coatings (Song et al. Citation2013). However, these studies did not combine the solar radiation absorptivity with the composition or color of the material.
The above research did not combine the solar radiation absorptivity with the material’s composition or color. Furthermore, these researches neglected the solar radiation coefficient, which depends on the building materials or coatings, as the carrier. Meanwhile, research on the influence of the solar radiation absorptivity on cooling demand has remained at the macro energy efficiency level throughout the year, and there is a lack of dynamic analyses on the micro-level and other time dimensions.
The fourth kind of research focused on the contrast between reflective coatings and different colors, and common coatings. Some researchers have evaluated the thermal performance of a conventional coating and reflective coating on outdoor test rooms, and calculated the monthly and annual heat gains of the roofs (Hernández-Pérez et al. Citation2018). The thermal performance of acrylic cold coatings on fiber cement specimens has been tested. Compared with unpainted specimens, the heat flow of white cold paint was reduced by 37%, the heat flow of yellow cold paint was reduced by 33%, and the heat flow of brown cold paint was reduced by 26% (Uemoto, Sato, and John Citation2010). The effect of different types of reflective coatings (silver gray, white and black) on the reduction in building surface temperature has been investigated (Synnefa, Santamouris, and Livada Citation2006).
The studies above lack horizontal contrast on the same material with different colors and other components. These researches focused mostly on the influence of the coating color on the surface temperature and heat gain rate, and lacked the analysis on the change in air conditioning cooling demand and energy consumption.
In summary, the existing researches on the impact of coating color change on building energy consumption pay more attention to the macro scale of annual energy consumption, annual cooling load, and heat load. There are also some studies on the impact of monthly energy consumption, but there is no further exploration on the impact of energy consumption. On this basis, this study made an in-depth exploration and studied the change of cooling load from the micro-level, that is, daily or hourly. More studies pay attention to the impact of coating color change on temperature and building energy consumption. On this basis, this study explored the impact of coating color change on building energy conservation. Existing studies focus on the impact of passive energy-saving measures such as changing coating color on the building itself. This research combined energy-saving measures with meteorological factors to explore the environmental factors that can maximize the energy-saving effect when the surface coating color changes.
Therefore, the present study was based on the heat transfer model, in order to reveal the influence and mechanism of building surface color on the building cooling demand with different time dimensions. At the same time, the present study analyzed the building’s weather and environment, and combined this with the coating’s optical properties, in order to investigate the heat transfer mechanism of the building, which can fill the gap in present research.
2. Methodology
2.1. Weather parameters
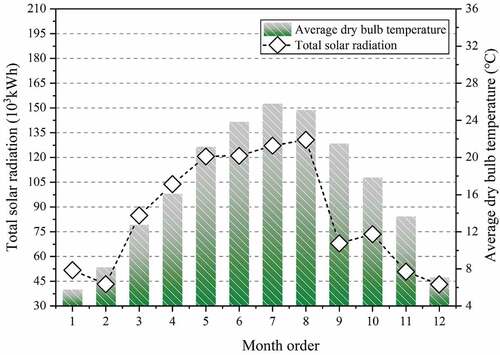
The investigators chose Chengdu as the research focus, according to the Köppen-Geiger climate classification. Chengdu belongs to the subtropical humid climate. Compared to worldwide regions of the same latitude, the temperature in most regions of China is 1.3°C-2.5°C higher in summer (Li Citation2005). shows the monthly solar radiation amount and average dry bulb temperature in Chengdu. This shows that the monthly global solar radiation reaches a peak in August, which is approximately 130.72 kWh/m2. From May to August, the distribution of solar energy is concentrated, and all are above 100 kWh/m2. In January, February, November and December, solar energy is relatively low. Solar radiation, dry bulb temperature, wind speed, and other meteorological data were selected from the energy plus meteorological database (EnergyPlus Weather Citation2019).
Figure 1. Monthly solar radiation and average dry bulb temperature in Chengdu.
2.2. Building objects
The building object selected for the present study is a 4-story large-scale shopping mall with one underground floor, and the building is south orientated. The height of the building is 23.99 m, with story heights of 5.27 m, 5.58 m, 5.27 m and 6.51 m, respectively. The total area of construction is 74,352 m2, and the total area of the envelope is 32,489 m2. The first of which is 18,588 m2. The building plan is shown in . The remaining floor plans are the same as those of the first floor plan. The north and east external walls have no windows due to the architectural design. The elevation is shown in .The exterior and interior environment of the mall is shown in The window glass material is Low-E coated glass. The exterior wall and roof are made of concrete. The heat transfer coefficients of the building envelope and building parameters are listed in . The thermal performance of the building envelope conforms to the relevant energy-saving design standards of public buildings (China Academy Of Building Research Citation2010). The main materials of the roof and external wall are listed in .
Figure 2. (a): Building plan. (b): Building elevation.
Figure 3. (a):The exterior environment of mall (b): The interior environment of mall.
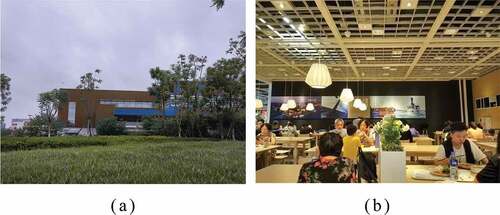
Table 1. Building characteristics and thermal parameters.
Table 2. Main materials of the roof and external wall .
The heat transfer coefficient of the external wall is 1 W/(m2·K) and the roof is 0.6 W/(m2·K). The heat transfer coefficients of the enclosure structure are in accordance with the Design Standard for Energy Efficiency of Public Buildings (China Academy of Building Research Citation2005).
2.3. Spectral characteristics of selected coatings
For non-luminous objects, under the same light source conditions, the color is mainly determined by the reflection, absorption and projection of different wavelengths of light. The essence is to characterize the color information in the visible light band through spectral reflectance (Qiang Citation2013).
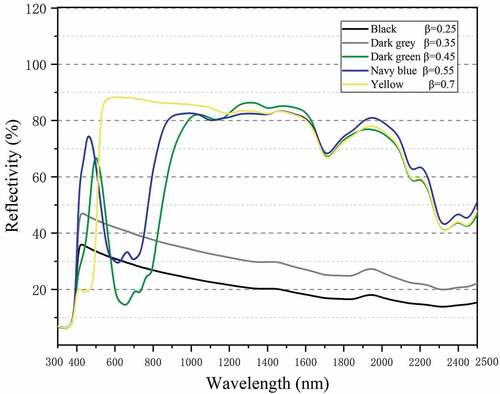
In the building envelope, the sun is the light source of the coating on the opaque surface. The coating color is presented by mixing the monochromatic light of a specific wavelength in the reflected sunlight. Meanwhile, for coating with the same material, but with different colors, due to the absorption of different wavelengths of sunlight, the solar reflectance and solar radiation heat flux would also differ. Five coatings that have different colors, but with the same material (black, dark grey, dark green, navy blue and yellow), were chosen for the analysis. The solar reflectance of the coating samples was tested using a solid UV/Vis/NIR spectrophotometer (Shimadzu SolidSpec-3700; Shimadzu, Japan). The spectra and reflectivities are shown in .
Figure 4. Spectral reflectivity of coatings over the solar spectrum.
2.4. Simulation condition
It was assumed that the indoor air conditioning temperature is set at 26°C in summer. According to the characteristics of commercial buildings, and considering the influence of internal heat sources in summer, the heat gain from lighting was calculated to be 19 W/m2, the heat gain from occupants was calculated to be 93 W per person, the clustering coefficient was 0.89, and the heat gain from equipment was calculated to be 13 W/m2 (Lu Citation2008). The mall is open from 10 am to 10 pm, regardless of the holidays. In order to determine the influence of different colors of coatings on the opaque building envelope, according to relevant standards, the solar radiation reflectance of the coatings were generally measured through experimental methods. Hence, the solar radiation absorptivity was obtained (EquationEquation 1(1)
(1) ).
Where: α is the solar radiation absorptivity (300–2,500 nm) of the sample, β is the solar radiation reflection coefficient (280–2,500 nm) of the sample, and τ is the solar radiation transmittance of the sample. For opaque building surfaces, the transmittance was ignored. Merely absorption and reflection are considered for the heat of solar radiation (EquationEquations 2a(2a)
(2a) and Equation2b
(2b)
(2b) ).
For similar malls, the color of the surface of the opaque envelope varied due to regional cultural differences and the preference of architects. In the present study, merely five representative colors of coating were chosen for the analysis. After spectrum test and calculation, the reflectivities of five coatings are β = 0.25(black), β = 0.35(dark grey), β = 0.45(dark green), β = 0.55(navy blue), β = 0.7(yellow). Substitute them into the formula 2b for calculation, the absorptivity are α = 0.75(black), α = 0.65(dark grey), α = 0.55(dark green), α = 0.45(navy blue), α = 0.3(yellow). Since the long wave radiation in the daytime is very low, when compared to solar radiation, the influence of radiation energy to the sky was ignored for the present study.
2.5. Computing method
The heat balance equation for indoor air was established, the hourly weather data was substituted into the equation, the weather data was placed into the equation, the heat gain of indoor air was calculated, and the heat or cold amount was removed from the room by air conditioning (Q0). This can be obtained through EquationEquation 3(3)
(3) .
Where: QGlass is the heat that directly enters the glass window, Qp is the heat dissipation of the body, QAir is the heat brought in from the outdoor air through the doors and windows, QE is the heat dissipation of indoor equipment, and QS is the heat dissipation of lighting equipment (Long Citation2009).
Among these, QGlass, Qp, QAir, QE and QS were calculated using the traditional heat transfer calculation equation. QBody is the heat transferred through the envelope, which can be expressed through EquationEquation 4(4)
(4) .
Where: Ki is the heat transfer coefficient (W/m2k) of the enclosure structure of each part of the room; Fi is the heat transfer area (m2) of each surface in the room, which is determined by the structure; tSi is the comprehensive temperature outside the envelope (°C), and t is the indoor air temperature (°C). The change in solar radiation absorptivity affects the difference between tSi and t.
For the model, it was assumed that the indoor temperature is stable at 26°C. When TQut<26°C, QAir = 0, TQut>26°C, and QAir was calculated.
Among these:
Where δi is the equivalent thickness (m) of each surface, and λi is the equivalent thermal conductivity (W/(m °C)) of each surface. α0 represents the heat transfer coefficient of the air outside the enclosure (W/(m2 °C)); αI represents the comprehensive heat transfer coefficient of the air inside the room (W/(m2 °C)); t represents the indoor air temperature (°C), assuming that the indoor air temperature are uniform.
Solar radiation heat that directly enters the room through the glass window can be expressed as QGlass, This can be calculated using the following formula:
Where: FGI refers to the transparent area of each glass window (m2); I refers to the total intensity of solar radiation projected onto the glass surface (W/m2); ηi refers to the penetration coefficient of solar radiation through the glass; ρG refers to the solar absorptivity of the glass; CI refers to the shading coefficient, CI = 1 when there is no shading measures.
The heat dissipation QP of the occupant is calculated by the following formula
Where: q refers to the heat dissipation capacity of adult men with different activities, n refers to the number of people in the room, and K refers to the cluster coefficient.
The heat gain from the infiltrated outdoor air is Qair. The total ventilation rate of these two items is nk. Hence:
Where: nk refers to the air exchange rate (times/h), V refers to the room volume (m3), C refers to the specific heat of outdoor air, kJ/kg·°C; ρout refers to the outdoor air density, kg/m3; tout refers to the outdoor air temperature; t refers to the indoor air temperature.
The heat dissipation QE for equipment was calculated using the following equation:
Where: n1 refers to the equipment utilization factor (0–1), n2 refers to the load factor (0–1), n3 refers to the simultaneous utilization factor (0–1), n4 refers to the heat energy conversion factor, and Σ PE refers to the total rated power of the equipment.
The heat dissipation Q5 for lighting equipment was calculated using the following equation:
Where: n5 refers to the simultaneous utilization coefficient for lighting equipment (0–1), n6 refers to the thermal energy conversion coefficient for lighting equipment, and ∑ PS refers to the total power of lighting equipment.
The heat storage capacity of the building envelope is, as follows:
Where: Si refers to the heat storage coefficient of the building envelope, Fi refers to the internal surface area of the building envelope, ρi refers to the density of the building envelope, Ci refers to the specific heat of the building envelope, λi refers to the thermal conductivity of the building envelope, T refers to period h of the heatwave action, and k1 refers to the correction coefficient for the surface temperature increase of the building envelope.
In the simulation analysis, since the floor area of the mall was large, and the size of the windows could be ignored, it was impossible to remove the indoor residual heat and humidity by natural ventilation. Furthermore, since there is no adjacent room, the wall and roof of the building model were directly affected by the external meteorological environment, which ignores the heat transfer of the first floor and heat storage capacity of the enclosure. With the assumption of being under the comprehensive action of external disturbance, internal disturbance and the building envelope, as long as the indoor characteristic temperature is greater than 26°C, there will be a cooling demand.
The present study took black color as the reference value, simulated the dynamic cooling loads of buildings with different colors on the surface, and calculated the daily, monthly and annual cooling load (EquationEquation 12(12)
(12) ). Furthermore, the macro effect and micro energy saving mechanism of different colors on the building’s annual air-conditioning energy consumption were systematically investigated.
Where: R refers to the cooling load reduction ratio; L1 refers to the cooling load or consumption amount when applying a dark gray coating; L2 refers to the cooling load when applying coatings of other colors.
3. Results
3.1. Contrast of macro-energy-saving effects of different coatings colors
Under the condition that the building characteristic parameters and meteorological conditions are exactly the same, the present study changed the solar radiation absorptivity of the building surface to simulate the changes in hourly cooling load, and daily, monthly and annual cooling load. The investigators chose the dark-gray coating as the base case, in order to obtain the energy saving effect of the macro cooling load and micro energy saving change of the hourly cooling load.
3.1.1. Annual energy consumption comparison
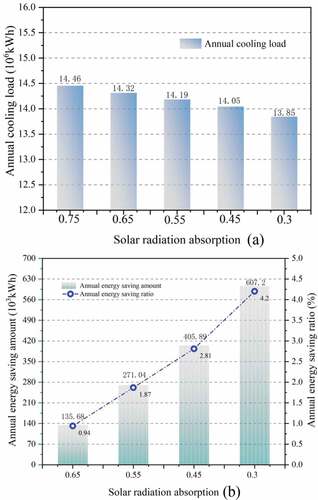
represents the variations of annual cooling consumption when the opaque surface of the building was painted with different colors. Different choices of coating color can lead to changes in annual cooling consumption, accordingly. For example, the maximum annual cooling consumption was 194.48 kWh/m2 per year when black coating was applied, and the minimum annual cooling consumption was 186.28 kWh/m2 when yellow coating was applied, with a difference of 8.20 kWh/m2. Furthermore, it can be observed that when the solar radiation absorptivity of the building coating decreased, the annual cooling consumption of the building also decreased. presents the change in annual cooling energy saving amount and cooling energy saving ratio. When the color of the building surface coating was changed from dark to light, the annual macro level cooling energy saving amount and cooling efficiency gradually increased. For example, when α = 0.65 (dark grey), the cooling energy saving amount was 1.82 kWh/m2 per year, and a cooling energy saving ratio of 0.94%. When α = 0.3 (yellow), the cooling energy saving amount was 8.17 kWh/m2 per year, with a cooling energy saving ratio of 4.2%. The annual cooling energy saving amount of the yellow coating was 4.48 times of that of the dark grey coating. It should be stressed that in the design of the building surface, the selection of surface color has a significant impact on the energy saving of air conditioning throughout the year.
Figure 5. (a): Change in annual cooling load with different colors on the building surface. (b): Effect of color change on the building surface on annual cooling energy saving amount and cooling energy saving ratio.
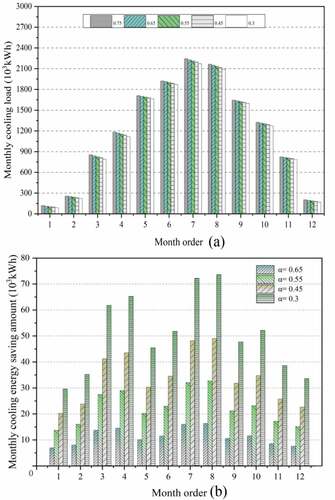
shows the variation of the monthly cooling load of buildings with different colors on opaque surfaces. These results confirm that due to the large heat source, there is cooling demand even in winter months. When the color of the surface was changed from dark to light, the cooling consumption each month decreased to a different extent. The maximum cooling consumption for the black coating in July was 2,244.07 × 103 kWh, while the lowest cooling consumption in January can reach as low as 88.85 × 10³ kWh when the surface is painted with yellow coating.
3.1.2. Comparison of monthly cooling energy saving amount
presents the monthly change in cooling energy saving amount when painting in different colors. The following can be observed: (1) As the solar radiation absorptivity of the coating decreases, the monthly cooling energy saving amount of the building increases. (2) When the color of the coating was changed from dark-grey (α = 0.65), dark-green (α = 0.55) and navy blue (α = 0.45) to yellow (α = 0.3), the cooling energy saving amount increased. Compared with yellow, the difference with navy blue was at the minimum, while the difference with dark grey was at the maximum, and the ratio of the monthly cooling energy saving amount varied within 1.1–2.5. The difference between yellow and dark-grey was the greatest: from March to November, the cooling energy saving amount for the yellow coating was 4.5 times of that of the dark-grey coating, and this can reach up to 4.38 times in February, when the cooling saving capacity is the smallest. (3) The cooling energy saving amount fluctuates throughout the year, and has the same trend as the change in solar radiation: months with low temperature and low solar radiation (January, February and December) have a low energy saving amount, while for months with high temperature and solar radiation (July and August), this amount is high. (4) In comparing ), it is not difficult to determine that regardless of the color of the building, the monthly change in regularity of the cooling load was almost similar to the average temperature, while the variation in monthly cooling energy saving amount was obviously different. For example, when the surface is yellow, the cooling load in March and April would be significantly less than that in May and June, but the cooling energy saving amount would significantly be greater than that in May and June, which is 66.39 mWh: 65.27 × 10³ kWh in April, 45.46 × 10³ kWh in May, and 51.81 × 10³ kWh in June. This mechanism is further discussed below.
Figure 6. (a): Monthly cooling load changes with different colors on the building surface. (b): Comparison of cooling monthly cooling energy saving amount when the surface is in different colors. (α is the solar radiation absorptivity).
3.2. Micro energy-saving mechanism
3.2.1. Daily perspective
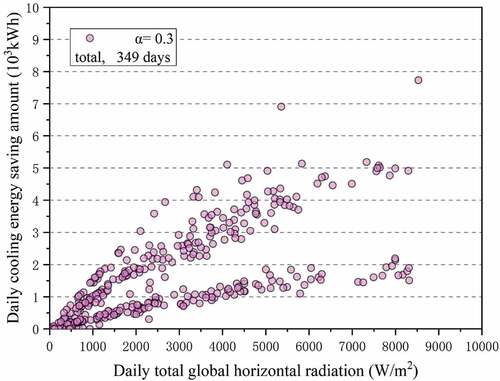
The change in energy saving effect caused by different coating colors need to be observed, not only from the macro level, but also from the daily and hourly micro levels, and combined with meteorological conditions. In order to avoid tediousness, the present study only presented the yellow case as an example, with the black case still used as a comparative basis. presents the change in daily cooling energy saving amount with the daily total global horizontal radiation when the surface is yellow. One point represents the data of a day. There are 349 days that require cooling in the mall for the whole year. The following can be observed: (1) There are 349 cooling energy saving spots in the whole year. With the increase in daily total global horizontal radiation within the range of 0–9,000 W/ m2, the daily cooling energy saving amount changes within the range of 0–8 × 10³kWh, and this exhibits an increasing trend. For days with a zero or lower accumulated value of daily solar radiation, the daily cooling energy saving amount is relatively low. For the days with a larger accumulated value of daily solar radiation, the daily cooling energy saving amount is relatively high, the maximum daily cooling demand can be reduced by 7.73 × 10³kWh, and the energy saving effect is impressive. (2) When the daily accumulated solar radiation is similar, the difference in daily cooling energy saving amount may be significant. The larger the daily solar radiation, the more significant the difference becomes. Further observation shows that there are two kinds of obvious branches: one branch is the gradual increase in scatter points, while the other branch is the rapid increase in scatter points, forming two nearly straight lines with different slopes. Other scatter points are located between the two lines.
Figure 7. Changes in daily cooling energy saving amount with daily total global horizontal radiation. (α is the solar radiation absorptivity).
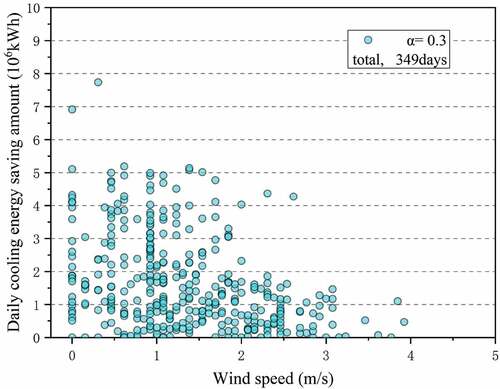
shows the change rule of the daily cooling energy saving amount with the daily average wind speed. There are 349 days of cooling energy savings for the whole year. These results demonstrate that the value changes with wind speeds ranging within 0–4 m/s, and fluctuations within 0–8 × 10³kWh. (1) In addition to days with static wind, as the daily average wind speed increases, the daily cooling energy saving amount gradually decreases. For every 1 m/s increase in daily average wind speed, the daily cooling energy saving amount would decrease by 20.32%-37.77%. (2) Under the same daily average wind speed, there are days with very low cooling energy savings, and these days have a common feature: the accumulated solar radiation is low, which is within 700 W/m2. (3) For days with large cooling energy savings (), these must have the common feature of high solar radiation and low daily average wind speed. (4) These points are dense in the area, with a low daily average wind speed, and shows that the reasonable optimization of the mall surface color has a better cooling effect for an inland city, such as Chengdu.
Figure 8. Changes in daily cooling energy saving amount with average wind speed.(α is the solar radiation absorptivity).
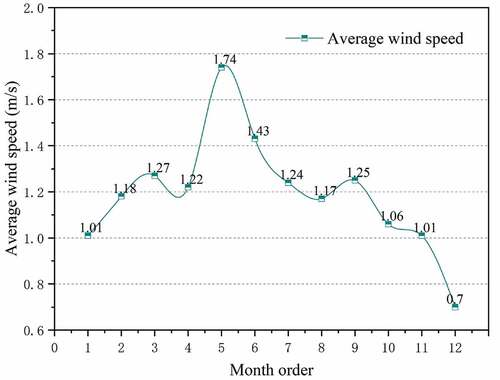
shows the monthly average wind distribution in Chengdu. The wind speed in May and June in Chengdu was significantly higher than that in March and April. Although solar radiation is higher than that in March and April (), the monthly cooling load was also higher (). However, when the buildings were painted with yellow coating, the monthly cooling energy saving in March and April were higher than that in May and June (). The low average wind speed in March and April plays an important role.
Figure 9. The change of monthly average wind speed in Chengdu.
3.2.2. Hourly level
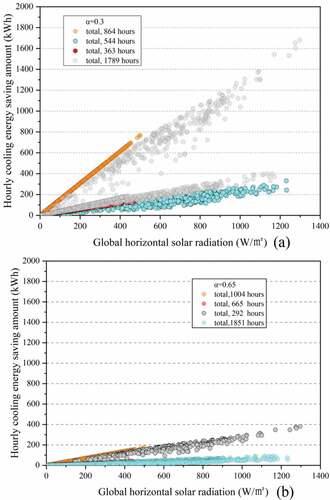
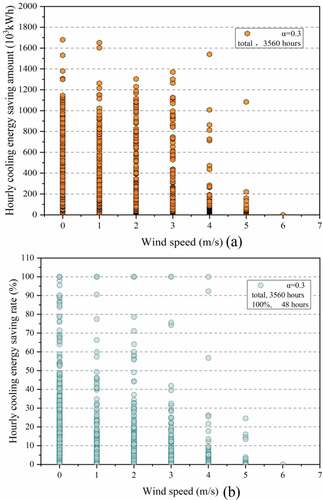
) present the change in mall cooling energy savings with the global horizontal radiation, when applying yellow and dark-grey coatings, respectively. For the 8,760 hours of the whole year, the number of hours when the mall has cooling demand is 3,560 hours. The following can be determined: (1) With the increase in hourly solar radiation, the cooling energy savings increase to different degrees. (2) Under the same hourly solar radiation, the variation in cooling energy savings may be significant, and when the solar radiation intensity increases, the difference is also greater. These scatter points were clustered into two branches, in which one branch had relatively high cooling energy savings, and the other branch had relatively low cooling energy savings. (3) Further findings revealed that the number of relatively high cooling energy saving points was 2,653 hours, and the number of relatively low cooling energy saving amount point was 807 hours. (4) It is easy to explain that due to the decrease in solar radiation absorption ratio caused by the application of the yellow coating, the larger the solar radiation, the more pronounced the cooling energy saving effect became. However, further studies are needed to determine the mechanism that causes the significant difference in hourly cooling energy saving amount under the same solar radiation intensity.
Figure 10. (a): The change of cooling energy saving amount with the global horizontal radiation when applying yellow coating. (b):The change of cooling energy saving amount with the global horizontal radiation when applying dark grey coating. (α is the solar radiation absorptivity).
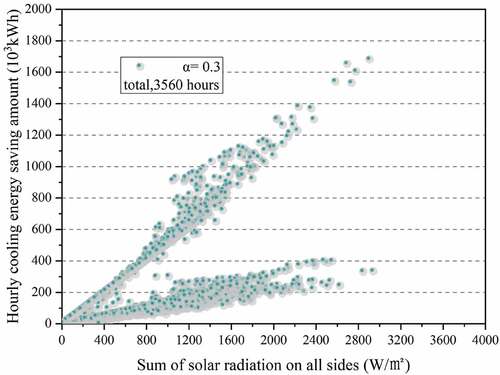
In order to further reveal the aforementioned mechanism, five groups for time with the same global horizontal radiation were selected for comparison. presents the month, date and hour of these five groups of data, and the corresponding outdoor dry bulb temperature, wind speed, global horizontal radiation, cooling energy saving amount, and ratio of diffuse radiation to the global solar radiation at each moment. It can be observed that the global solar radiation of each group at two moments is exactly the same, but the cooling energy saving amount is significantly different. These results indicate the following: (1) Under the same level of global solar radiation, the cooling energy saving amount was higher at one moment, and lower at the other moment. (2) When the cooling energy savings was high, the wind speed was generally low, and the ratio of diffuse radiation to global solar radiation was relatively high. The reason was as follows: the diffuse radiation-to-global solar radiation ratio was high, which means that the absorption of the building exterior wall becomes higher with the increase in solar radiation, the cooling load increases, and the cooling energy saving decreases. (3) The coupling effect of the outdoor air temperature and horizontal solar radiation is very complex. presents the change in hourly cooling energy saving with the hourly global solar radiation on each facade when the building surface was painted with a yellow coating.
Table 3. The impact of meteorological factors on the cooling energy saving amount.
This is actually the result of changing the abscissa in . The figure further reveals the relationship between the cooling energy savings by changing the color of the building surface coating and the global solar radiation of each facade. This focuses on the essence of the problem better than that in . However, this cannot clearly show the mechanism of the two divergent lines.
Figure 11. The change of hourly cooling energy saving amount with the global solar radiation of each facade. (α is the solar radiation absorptivity).
presents the change in hourly cooling energy savings with wind speed, when the building surface is painted with a yellow coating. It can be observed that there are many static and low wind speed moments in Chengdu. With the increase in wind speed, the maximum value of the cooling energy savings obviously decreases. Under the same wind speed, there are moments when the cooling energy savings is low, and the solar radiation corresponding to these times is weak.
Further statistics show that the number of static wind hours in Chengdu for the whole year is 1,200 hours, which only accounts for 33.71% of the total, but the cumulative cooling energy saving is 318.45 × 10³kWh, accounting for 52.45% of the total. The number of windy hours is 2,360, accounting for 66.29% of the total number of hours, and the cumulative cooling energy savings is 288.74 × 10³kWh, accounting for only 47.55% of the total cooling energy savings amount in the whole year. In times where there is an energy saving effect, and although the static wind moment is lesser than the windy moment, the total cooling energy saving amount for static wind moment was 9.33% (29.74 × 10³kWh), which was greater than that for the windy moment. It was shown that the contribution of energy-saving performance when changing the color of the building surface plays a dominant role in static wind or slow wind moments. The deep reason is that wind speed can affect the external heat transfer of buildings. That is, the higher the wind speed, the greater the convective heat transfer coefficient. Solar radiation causes the temperature of the building surface to rise, while the wind promotes the heat exchange, thereby reducing the temperature of the surface. The lower the wind speed, the smaller the heat transfer coefficient. Especially when the wind speed is zero, low wind speed does not promote the heat transfer. Hence, the impact on indoor energy consumption is increased. Under the same solar radiation intensity, the wall surface temperature was higher, and the cooling load was greater at low wind speed. Therefore, the cooling load difference between black and yellow coatings (cooling energy saving amount) was larger.
Figure 12. (a): The variation of hourly cooling energy saving amount with wind speed. (b): The variation of hourly cooling energy saving ratio with wind speed.(α is the solar radiation absorptivity).
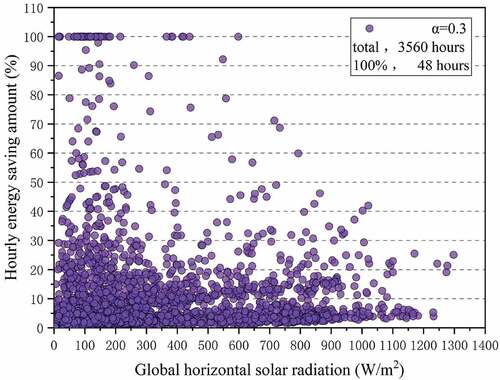
presents the variation in hourly cooling energy saving ratio with the global horizontal solar radiation when the mall is painted with a yellow coating. As shown in the figure: (1) The number of hours that require cooling can reach as high as 3,560 hours in the mall. With the change in global solar radiation within the range of 0–1,300 W/m2, the energy saving efficiency varied within the range of 0–100%, when yellow coating was applied. (2) There were 3,194 points where the cooling energy saving ratio gathered within the range of <20%, and 366 points where the high cooling energy saving ratio distributed within the range of >20%. (3) There were a few points with an extremely high cooling energy saving ratio. Furthermore, 53 points were above 90%, and 48 points reached 100%. (4) With the increase in global solar radiation, the number of energy-saving points decreases. According to further statistics, the global solar radiation for 51 points with an extremely high cooling energy saving ratio was below 500 W/m2. These results indicate that the cooling effect is significant when the global horizontal solar radiation is low. However, further studies are needed to determine whether other meteorological factors affect the energy saving effect.
Figure 13. The variation of hourly cooling energy saving ratio with global horizontal radiation. (α is the solar radiation absorptivity).
In order to demonstrate the impact of other meteorological factors on the air conditioning cooling energy saving ratio, the variation of hourly energy saving ratio with wind speed under a yellow coating is presented in . As shown in the figure:
(1) The cooling energy saving ratio points are distributed in two parts, in which the wind speed is zero and the wind speed is greater than zero. The number of total effective energy-saving hours is 3,560, in which 1,200 hours was for static wind and 2,360 hours was for windy times.
(2) The average cooling energy saving ratio was 15.22% during the static wind period and 4.95% during the windy period. The average energy-saving effect was 3.07 times of that of the blowing time.
(3) Although the number of static wind hours was lesser than that of windy hours, the average energy-saving effect of the static time was significantly higher than that of the windy time. The higher the wind speed, the lower the energy-saving ratio. When the wind speed reached 6 m/s, there was no energy saving effect. This shows that the micro energy-saving effect of changing the surface color of the mall was the best for static wind conditions.
4. Discussion
4.1. Energy saving performance of cities with different wind speeds
presents the average wind speed of eight typical cities with a subtropical humid climate in the dry and warm winter. The data was calculated using the energy plus meteorological database (EnergyPlus Weather Citation2019).
Table 4. The average wind speed(m/s) of eight typical cities in hot summer and cold winter zone.
Hefei has the highest average wind speed in summer, and Chengdu has the lowest value. Therefore, although these were located in the same climate area, the effect of the color of the building coating on the cooling energy saving amount was greater in Chengdu, when compared to Hefei.
It should be noted that the effect of the color change of the building coating on the energy consumption of air conditioning is more significant in inland cities with low wind speeds. For inland cities with more static wind or low wind speed, it is more important for architects to optimize the surface color of public buildings, which can in turn achieve remarkable energy saving effects without significant cost. Therefore, considering the multiple effects of the same energy-saving measure, it is particularly important to choose energy-saving measures according to local conditions.
4.2. Comparison of research results
Through the comparison of research objectives and results, it was revealed that a number of scholars have tested or simulated the color and material reflectance of building roofs or facades, and obtained clear research results. Xamánb et al. investigated the heat gain of roofs with different colors. The results revealed that the daily heat gain of a white roof was 59–80% lower than that of a gray roof, while the net heat gain of a red roof was 22% higher. Kai L. Uemoto et al. tested the thermal performance of small wooden box models under different colors of cold roof, and reported that compared with samples without coating, the heat flow decreased by 37% for the white wooden box, decreased by 33% for the yellow wooden box, and decreased by 26% for brown wooden box. Hui Shen et al. reported that in summer, the albedo of architectural coatings increases from 32% to 61%, resulting in an average decrease of 6°C on the external surface temperature of the west wall, and a reduction of 2.62 kWh of power consumption per day. A. Libbra et al. calculated that when the color of the tiles changed, the solar reflectance changed from 0.55 to 0.49, which reduced the solar gains by 30%.
The academic and application value of this paper is that this research has the load characteristics of large public buildings. If it is applied to other buildings, some working conditions need to be changed, such as staff heat dissipation, heat source density, fresh air exchange, etc. Although the assumptions have changed when applied to other buildings, the research methods are also applicable. The load change trend at the macro and micro levels is the same, the influence trend of color change on building energy saving effect is the same, and the deep-seated influence mechanism studied in this paper also exists.
4.3. Limitations of the study
(1) Due to the large area of the building roof used for the present study, it was found through calculation that compared with buildings with a black roof and facade, if the roofs were painted in yellow, the annual cooling energy-saving rate of the buildings would be 2.54%, while if the facades were painted in yellow, the annual cooling energy-saving rate of the buildings would become 1.67%. It can be observed that the roof has the greatest impact on the performance of the building in the present study. However, in reality, the situations are more complicated. Different proportions of roof and facade, different building orientation, and different areas of east, west, north and south facades would have different effects on building energy consumption. (2) The present study investigated coatings with the same composition, but different colors. However, the change in the composition of the material itself and the roughness of the material surface would have different effects on the solar absorptivity, for the application of buildings with different volumes, shapes, and functions, the impact of surface coatings on energy saving, which can be further analyzed. These above limitations are the direction that needs further analysis.
5. Conclusion
The color change of opaque building coating leads to the difference in energy-saving effect. In the present study, the mechanism and principle were comprehensively analysed when combined with meteorological factors, not only from the macro-level observation of the whole year, but also from the micro-level of daily and hourly:
1) At the annual level, the influence of the choice of different color coatings on the annual energy load was obvious. Compared with the black coating, the yellow coating can save 4.2% of cooling load.
(2) When the solar radiation absorptivity of the building coating decreased, the cooling energy consumption of each month exhibited a decreasing trend. On the contrary, compared with the black coating, the cooling energy consumption increases monthly. Among these, the maximum monthly cooling energy saving amount for the yellow coating can reach 4.5 times higher than that for the dark-gray coating. Furthermore, it was found that the monthly variation principle for cooling loading was almost similar to the monthly average outdoor temperature, while the monthly cooling energy saving amount presented a huge difference.
(3) From the micro-level, compared with the black coating, when yellow coating was applied, the accumulated solar radiation was the largest, and the cooling energy saving amount was the largest on the day (saving 7.73 × 10³kWh of cooling demand). At the same time, the daily cooling energy saving amount rises with the increase in solar radiation, which is a unified trend. However, when the daily cumulative solar radiation is the same, the difference in daily cooling energy saving amount may be very large. The larger the daily solar radiation is, the more obvious the difference is. The reason is, as follows: in months with higher solar radiation intensity, the cooling load was higher, but the cooling effect was lower, and the wind speed was relatively higher in these months. It is found through the daily analysis that except for days of static wind, with the increase in average wind speed, the cooling energy saving amount gradually decreased. That is, for every 1 m/s increase in daily average wind speed, the average cooling energy saving amount falls by 20.32%-37.77%. For the days with a large cooling energy saving amount, there is a common characteristic of high solar radiation and low average wind speed. Through the hourly analysis, it is found that under the same level of global horizontal solar radiation, when the cooling energy savings was high, the wind speed was generally low, and the diffuse radiation-to-global solar radiation ratio was relatively high. Although the static wind hours were lesser than windy hours, the cooling energy saving amount with static wind was 9.33% more than that during windy moments.
(4)It can be observed that after changing the color of the opaque building surface, there was a different distribution in energy saving effect, which is due to the strong influence of meteorological conditions. That is, wind speed plays a dominant role. Among the factors that affect the energy consumption of building air conditioning after changing the color of opaque building skin, solar radiation intensity has a positive effect on the cooling effect, and the diffuse radiation-to-global solar radiation ratio and wind speed had a negative effect. In the subtropical humid area, when the solar radiation intensity was high, the diffuse radiation-to-global solar radiation ratio was low, the time for static wind was frequent, and the cooling effect can reach an ideal degree.
Disclosure statement
No potential conflict of interest was reported by the author(s).
Additional information
Funding
References
- Al-Obaidi, K. M., M. Azzam Ismail, H. Hussein, and A. M. Abdul Rahman. 2017. “Biomimetic Building Skins: An Adaptive Approach.” Renewable and Sustainable Energy Reviews 79: 1472–1491. doi:10.1016/j.rser.2017.05.028.
- Bansal, N. K., S. N. Garg, and S. Kothari. 1992. “Effect of Exterior Surface Colour on the Thermal Performance of Buildings.” Building and Environment 27: 31–37. doi:10.1016/0360-1323(92)90005-A.
- Beatrice, C., A. M. Gambelli, A. Nicolini, F. Rossi, et al. 2020. “Optic-energy and Visual Comfort Analysis of Retro-reflective Building Plasters”. Building and Environment 174: 106781. doi:10.1016/j.buildenv.2020.106781.
- China Academy Of Building Research. 2010. Energy-saving Design Standards for Residential Buildings in Hot Summer and Cold Winter Areas. Beijing: China Building Industry Press.
- China Academy of Building Sciences. 2005. Design Standard for Energy Efficiency of Public Buildings. Beijing: China Construction Industry Press.
- Coma, J., G. Pérez, C. Solé, A. Castell, and L. F. Cabeza. 2016. “Thermal Assessment of Extensive Green Roofs as Passive Tool for Energy Savings in Buildings.” Renewable Energy 85: 1106–1115. doi:10.1016/j.renene.2015.07.074.
- Cozza, S., M. Alloisio, A. Comite, G. Di Tanna, and S. Vicini. 2015. “Nir-reflecting Properties of New Paints for Energy-efficient Buildings.” Solar Energy 116: 108–116. doi:10.1016/j.solener.2015.04.004.
- Morini, E., B. Castellani, S. De Ciantis, E. Anderini, and F. Rossi. 2018. “Planning for Cooler Urban Canyons: Comparative Analysis of the Inflfluence of Façades Reflflective Properties on Urban Canyon Thermal Behavior.” Solar Energy 162: 14–27. doi:10.1016/j.solener.2017.12.064.
- EnergyPlus Weather. Accessed 17 October 2019. https://www.energyplus.net/weather-download/north_and_central_america_wmo_region_4/USA/CA/USA_CA_China.Lake.NAF.746120_TMY/all
- Falasca, S., V. Ciancio, F. Salata, I. Golasi, F. Rosso, and G. Curci. 2019. High Albedo Materials to Counteract Heat Waves in Cities: An Assessment of Meteorology, Buildings Energy Needs and Pedestrian Thermal Comfort.” Building and Environment 163. doi: 10.1016/j.buildenv.2019.106242.
- Guo, R., Y. Gao, C. Zhuang, P. Heiselberg, R. Levinson, X. Zhao, and D. Shi. 2020. “Optimization of Cool Roof and Night Ventilation in Office Buildings: A Case Study in Xiamen, China.” Renewable Energy 147: 2279–2294. doi:10.1016/j.renene.2019.10.032.
- Guo, W., X. Qiao, Y. Huang, M. Fang, and X. Han. 2012. “Study on Energy Saving Effect of Heat-reflective Insulation Coating on Envelopes in the Hot Summer and Cold Winter Zone.” Energy and Buildings 50: 196–203. doi:10.1016/j.enbuild.2012.03.035.
- Hernández-Pérez, I., J. Xamán, E. V. Macías-Melo, K. M. Aguilar-Castro, I. Zavala-Guillén, I. Hernández-López, and E. Simá. 2018. “Experimental Thermal Evaluation of Building Roofs with Conventional and Reflective Coatings.” Energy and Buildings 158: 569–579. doi:10.1016/j.enbuild.2017.09.085.
- Huang, M., X. Hao, and C. Li. 2017. “Heat and Mass Transfer of Evaporative Wall and Its Cooling Load Calculation.” Procedia Engineering 205: 2762–2770. doi:10.1016/j.proeng.2017.09.874.
- Jiang, L., and M. Tang. 2017. “Thermal Analysis of Extensive Green Roofs Combined with Night Ventilation for Space Cooling.” Energy and Buildings 156: 238–249. doi:10.1016/j.enbuild.2017.09.080.
- Kontoleon, K. J., and D. K. Bikas. 2007. “The Effect of South Wall’s Outdoor Absorption Coefficient on Time Lag, Decrement Factor and Temperature Variations.” Energy and Buildings 39: 1011–1018. doi:10.1016/j.enbuild.2006.11.006.
- Li, H. 2005. “Skin of the Green Architecture–A Practical Research on Utilizing Swiss Experience to Nanjing District.” City Building 10: 24–27.
- Li, W., L. Yang, and B. Ning. 2019. “Effect Evaluation of Chiller-side Strategies in Demand Response of Chinese Commercial Buildings.” Energy Procedia 158: 2549–2554. doi:10.1016/j.egypro.2019.02.002.
- Li, Z., H. Zhang, J. Geng, X. Du, and M. Zhao 2007 . “Analysis on the Effect of the High-reflective Coat on the Air-conditioned Wall.” Paper presented at the Shanghai Refrigeration Society 2007 academic annual meeting, Shanghai, China, December 18.
- Long, E., ed. 2009. Gene Theory of Building Energy Consumption and Building Energy Conservation Practice. China: Science Press.
- Luisa, B., and W. Jan 2014. “2014 Solar Reflected Glare Affecting Visual Performance.” Proceedings of 8th Windsor Conference 2014: Counting the Cost of Comfort in a Changing World, UK, April 2014, London: Network for Comfort and Energy Use in Buildings
- Mansouri, O., R. Belarbi, and F. Bourbia. 2019. “Albedo Effect of External Surfaces on the Energy Loads and Thermal Comfort in Buildings.” Energy Procedia 139: 571–577. doi:10.1016/j.egypro.2017.11.255.
- Mitja, K., P. Luka, I. Nataša, and K. Roman. 2018. “A Theoretical Study on a Coupled Effect of Building Envelope Solar Properties and Thermal Transmittance on the Thermal Response of an Office Cell.” Solar Energy 174: 669–682. doi:10.1016/j.solener.2018.09.042.
- Qiang, L. 2013. Research on Key Issues for Spectral-based Inkjet Color Reproduction. P, R. China: Wuhan University.
- Rosso, A. L., V. L. Pisello, C. Castaldo, F. Fabiani, M. F. Cotana, and W. Jin. 2017. “New Cool Concrete for Building Envelopes and Urban Paving: Optics-energy and Thermal Assessment in Dynamic Conditions.” Energy and Buildings 151: 381–392. doi:10.1016/j.enbuild.2017.06.051.
- Sahar, A., E. Mariam, and L. Rania. 2019. “The Negative Impact of Solar Reflections Caused by Reflective Buildings’ Facades: Case Study of the Nasher Museum in Texas.” IOP Conference Series. Earth and Environmental Science 297 (1): 12048. doi:10.1088/1755-1315/297/1/012048.
- Shashua-Bar, L., I. X. Tsiros, and M. Hoffman. 2012. “Passive Cooling Design Options to Ameliorate Thermal Comfort in Urban Streets of a Mediterranean Climate (Athens) under Hot Summer Conditions.” Building and Environment 57: 110–119. doi:10.1016/j.buildenv.2012.04.019.
- Shen, H., H. Tan, and A. Tzempelikos. 2011. “The Effect of Reflective Coatings on Building Surface Temperatures, Indoor Environment and Energy consumption—An Experimental Study.” Energy and Buildings 43: 573–580. doi:10.1016/j.enbuild.2010.10.024.
- Song, Z., W. Zhang, Y. Shi, J. Song, J. Qu, J. Qin, T. Zhang, Y. Li, H. Zhang, and R. Zhang. 2013. “Optical Properties across the Solar Spectrum and Indoor Thermal Performance of Cool White Coatings for Building Energy Efficiency.” Energy and Buildings 63: 49–58. doi:10.1016/j.enbuild.2013.03.051.
- Souza, L. C. O., H. A. Souza, and E. F. Rodrigues. 2018. “Experimental and Numerical Analysis of a Naturally Ventilated Double-skin Façade.” Energy and Buildings 165: 328–339. doi:10.1016/j.enbuild.2018.01.048.
- Synnefa, A., M. Santamouris, and I. Livada. 2006. “A Study of the Thermal Performance of Reflective Coatings for the Urban Environment.” Solar Energy 80: 968–981. doi:10.1016/j.solener.2005.08.005.
- Takebayashi, H., M. Moriyama, and T. Sugihara. 2012. “Study on the Cool Roof Effect of Japanese Traditional Tiled Roof: Numerical Analysis of Solar Reflectance of Unevenness Tiled Surface and Heat Budget of Typical Tiled Roof System.” Energy and Buildings 55: 77–84. doi:10.1016/j.enbuild.2011.09.023.
- Taleghani, M. 2018. “The Impact of Increasing Urban Surface Albedo on Outdoor Summer Thermal Comfort within a University Campus.” Urban Climate 24: 175–184. doi:10.1016/j.uclim.2018.03.001.
- Triano-Juárez, J., E. V. Macias-Melo, I. Hernández-Pérez, K. M. Aguilar-Castro, and J. Xamán. 2020. “Thermal Behavior of a Phase Change Material in a Building Roof with and without Reflective Coating in a Warm Humid Zone.” Journal of Building Engineering 32: 101648. doi:10.1016/j.jobe.2020.101648.
- Uemoto, K. L., N. M. N. Sato, and V. M. John. 2010. “Estimating Thermal Performance of Cool Colored Paints.” Energy and Buildings 42: 17–22. doi:10.1016/j.enbuild.2009.07.026.
- Lu,Y. 2008. Practical Heating and Air Conditioning Design Manual. Beijing: China Construction Industry Press.
- Yuan, J., C. Farnham, and K. Emura. 2015. “Development of a Retro-reflective Material as Building Coating and Evaluation on Albedo of Urban Canyons and Building Heat Loads.” Energy and Buildings 103: 107–117. doi:10.1016/j.enbuild.2015.06.055.
- Yuan., J., C. Farnham, K. Emura, and M. A. Alam. 2016. “Proposal for Optimum Combination of Reflectivity and Insulation Thickness of Building Exterior Walls for Annual Thermal Load in Japan.” Building and Environment 103: 228–237. doi:10.1016/j.buildenv.2016.04.019.
- Zhou, L., and C. Li. 2020. “Study on Thermal and Energy-saving Performances of Pipe-embedded Wall Utilizing Low-grade Energy.” Applied Thermal Engineering 176: 115477. doi:10.1016/j.applthermaleng.2020.115477.