
 ?Mathematical formulae have been encoded as MathML and are displayed in this HTML version using MathJax in order to improve their display. Uncheck the box to turn MathJax off. This feature requires Javascript. Click on a formula to zoom.
ABSTRACT
In-situ production of precast concrete (PC) members is affected by various factors, such as cost, time, quantity, lead-time, number of molds, production cycle, number of cranes, and yard stock area. Particularly, the yard stock area constitutes over 84% of the total required area, considerably larger than the production area. This is important because in-situ production is not applicable if the yard stock area is not satisfied. However, most existing studies related to in-situ production of PC members have focused on the production area, and no study has specifically focused on the yard stock area. Therefore, research on in-situ production, considering various influencing factors centering on the yard stock area, is required. This study developed a system dynamics-based integrated management model of production and yard stock for in-situ production. Cost reduction up to 739,000 USD was demonstrated possible in a case project, wherein the yard stock area was 5,941m2. The influencing factors of in-situ production can be numerically controlled in the proposed model. It is thus possible to perform an effective simulation study and obtain appropriate values of the yard stock area, which varies during the project, under various scenarios based on the real site situations.
1. Introduction
In the construction industry, productivity during the construction phase may potentially be improved by considering factory production. However, in this field, the application of automation or robotics to manufacture parts in factories has been challenging and therefore scarce (Pan and Pan Citation2016, Citation2019). The fabrication is limited by challenges (Lim and Kim Citation2020b) such as those concerning the use of space in factories (Pan and Pan Citation2019), complex interfaces (Pan, Gibb, and Dainty Citation2012), non-uniform quality (Hwang, Shan, and Looi Citation2018), dependence on existing methods (Mao et al. Citation2015), complex scheduling (Arashpour et al. Citation2016), and high cost (Pan et al. Citation2018).
In-situ production of precast concrete (PC) members follows the same process as in-plant production in the order of installing reinforced bars, pouring concrete, curing, and stacking. If the cured PC member is partially damaged on the surface after being stacked, the quality and finishing are checked manually. In other words, when PC members are manufactured at a factory, the production process is mostly manpowered, similar to in-situ production, rather than involving automation or robotics (Oh Citation2017). This is because even if PC columns and beams of the same size are designed, the rebar arrangement is not designed with the same PC members. Thus, for the members to be manufactured, checked, and installed in the same manner as the design drawing, manual work is required.
Applying in-situ production of PC members reduces the cost by up to 39.4% compared with in-plant production (Hong et al. Citation2014; Lim Citation2016). If PC members are produced in the field under similar production conditions quality equivalent to or higher than that of in-situ production can be achieved (Lim et al. Citation2011a, Citation2011b; Jung and Lee Citation1992; Lee et al. Citation2011a). Accordingly, in-situ PC production exhibits advantages in terms of convenience, quality, cost, and time (Li and Love Citation2000; Osman, Georgy, and Ibrahim Citation2003; Ning, Lam, and Lam Citation2010; Abdul-Rahman, Wang, and Eng Citation2011).
As regards the research on in-situ PC production, Lee (Citation2012) developed an in-situ production management model for composite PC members and proposed cost, quality, process, resources, and safety management as management factors. Won et al. (Citation2013) studied the energy efficiency of in-situ PC production based on steam curing and derived calculation formulas and predictions for required input thermal energy to provide required information for practical application. Hong et al. (Citation2014) analyzed factors affecting the in-situ production of PC members based on production management and layout and stated that 14.5%–21.6% of the construction cost was reduced compared with in-situ production. Lim et al. (Citation2020b) introduced the detailed process of in-situ production based on an experimental study and derived the cost reduction ratio according to the quantity ratio. Lim and Kim (Citation2020a) calculated CO₂emission using the life cycle assessment (LCA) method through a case study of in-situ production and derived the reduction ratio of CO₂emission according to the quantity ratio. However, these studies focused on the production area, and no study specifically focused on the field area.
The available space that can be secured at the construction site comprises in-situ production and yard stock areas of PC members. The yard stock area is typically more than five times the production area. This is an important influencing factor because in-situ production is not applicable if the yard stock area is not satisfied. In addition, based on the research conducted mainly focusing on the production area, it is necessary to conduct a detailed study on the matters to be considered along with the yard stock area. Therefore, it is necessary to study yard stock management, which includes the calculation of yard stock area and stacking rules of the produced PC members. The objective of this study was to develop an integrated management model of production and yard stock for in-situ PC production. This study is limited to large areas and heavy buildings, that is, a floor height of approximately 10 m or more, a large floor area of 10,000 m2 or more, and a unit member weighing 10 tons or more. And this study is limited to the in-situ production of PC beams. shows steps of this study as follows:
Figure 1. Research process.
1) reviewing the influencing factors for in-situ PC production related to the yard stock area using the literature;
2) defining the concept of production and the yard stock area of PC produced in-situ and deriving area equations;
3) developing an algorithm to calculate the yard stock area for in-situ PC production;
4) establishing stacking rules for yard stock;
5) developing an integrated management model for production and yard stock using Expert Powersim Studio 10; and
6) evaluating the management model to a case project.
2. Related work
PC construction method has been progressing with the development and investment of new technologies worldwide (Kang and Kim Citation2006), and the demand for this method is increasing owing to the recent trend of large warehouse facilities. Large-scale warehouse facilities require prompt construction to recover investment costs (Oh Citation2017) and reduce the construction management expenses, which include labor costs, equipment costs, and overhead expenses, by shortening the construction period and exploiting the economic benefits of early operation. Hence, it is recognized that PC structure is more advantageous than RC structure for large warehouse facilities (Park et al. Citation2007, Citation2011; Song et al. Citation2005). Large warehouse facilities require long columns and beams of 5–10 m; therefore, a considerable scale of temporary construction is required. Thus, the capital-intensive PC method is currently advantageous as the cost of equipment and materials is decreasing and labor cost is increasing (You et al. Citation2001; Yoon, Hong, and Yoon Citation2010; Hong, Kim, and Kim Citation2010).
As the PC method generally involves production of the members in a factory and moving them to the construction site (Son et al. Citation1997; Lee Citation1994), shifting a PC member with a large unit and a long span is disadvantageous in terms of transportability. If the PC member is not transported according to the assembly order owing to various problems, such as issues in communication between the site managers and factory workers, additional space for storage would be required at the site. In addition, internal and external damage to the member can occur in the process of stacking, moving, and unloading for transportation. However, the in-situ production of the 5–10 m long columns and beams required for large warehouse facilities can avoid these problems. In-situ production refers to the production of PC members only inside the site, and proceeds in the same order as in-plant production: setting of manufactured rebar, pouring concrete, and curing. And in-situ production requires only small-scale resources in terms of equipment, curing facilities, and manpower and yard stock management is the most important aspect in in-situ production.
With regard to the research on the simulation of in-situ PC production, Lim (Citation2018) analyzed various risk factors for in-situ production and applied the developed risk management model to the case project. Lim, Kim, and Kim (Citation2020a) analyzed the factors that influence the calculation of in-situ production quantity and applied the developed simulation model to six scenarios to derive an appropriate quantity. Lim and Kim (Citation2020b) defined various influencing factors of in-situ production, derived an objective function, and developed an optimization model to minimize the environmental load. However, there has been no study on the simulation of influencing factors related to the yard stock area.
As for studies on the open storage yard at the construction site, Yun, Yu, and Kim (Citation2011) calculated the economic order quantity, considering the additional area for the storage yard based on the theory of manufacturing. Lee, Yu, and Kim (Citation2007) collected data on material procurement based on interviews with managers and established a dynamic material information database to present the procurement process at the construction site. Lee et al. (Citation2008) calculated the economic quantity for rebar based on a fixed ordering system that considers the size of the storage yard. Kim, Kim, and Kang (Citation2004) compared and analyzed the models that determine the order quantity of various materials for construction work and determined the appropriate order quantity and analyzed the inventory cost by identifying the most suitable method. Thomas et al. (Citation2003) analyzed the relationship between the material inventory and labor productivity performance by comparing the two factors in the rebar assembly and installation process and suggested the appropriate material inventory level. They studied the procurement and storage of required materials based on the theory of the manufacturing industry for proper inventory management in the construction site.
However, these studies differ from the studies of production and yard stock management pertaining to the in-situ production of PC members. The layout and operation strategy of PC members significantly influence the storage system and are important for the design of the open storage yard. However, the concept and storage process for the yard stock management of in-situ PC production have not been accurately defined. Therefore, this study focused on the integrated management of production and yard stock centered on yard stock management, considering that PC members are produced and erected over time and the yard stock area varies accordingly.
3. Influence factor analysis based on system dynamics
For in-situ PC production, there is a limitation in employing static analysis in that the assumption of the independent variable unilaterally (Moon Citation2001) affecting the dependent variable does not hold owing to the complexity of the relationship among influencing factors (Choi, Kim, and Kim Citation2015; Hyari, Shatarat, and Khalafallah Citation2017; Gransberg and Riemer Citation2009; Yeh Citation1998). For example, when PC members are produced in-situ in a limited space (Abdul-Rahman, Wang, and Eng Citation2011; Li and Love Citation2000; Osman, Georgy, and Ibrahim Citation2003; Ning, Lam, and Lam Citation2010) of a construction site, the influencing factors mutually interfere, and they proceed simultaneously with yard stock (Lim and Kim Citation2020b). All the processes must be performed in accordance with the erection plan of PC members, and a production plan that can be supplied in the just-in-time (JIT) method must be established. In other words, various influencing factors affect each other as time progresses.
System dynamics is a methodology for understanding complex systems and explains the changes in the system over time, focusing on the causal and feedback relationships (Kim, Moon, and Kim Citation1999; Forrester Citation1987). Thus, this methodology can overcome the limitations of static analysis. In-situ PC production is affected by eight factors, namely cost, time, quantity, lead-time, number of molds, production cycle, number of cranes, and yard stock area (Lim Citation2018). Among them, quantity, lead-time, number of molds, and number of cranes significantly influence the yard stock area. Therefore, this study, which is based on system dynamics, placed focus on these four influencing factors as well as the yard stock area. shows a causal loop diagram that illustrates the aforementioned influencing factors.
Figure 2. Causal loop diagram to estimate the yard stock area.
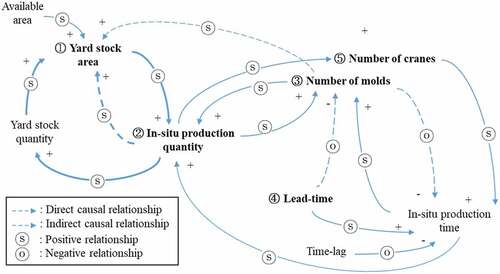
Details of each influencing factor are as follows:
Yard stock area: As the production time of PC members consumes a lot of time compared with the erection time, the produced members are stacked on the site before erection. The required total area for in-situ production comprises the required production and yard stock areas. In other words, the required yard stock area excludes the required production area from the required total area EquationEquation (1)
(1)
where ARYS is the required yard stock area (m2), ART is the required total area (m2), ARP is the required production area (m2), and AA is the available area (m2).
In-situ production quantity: The members produced in-situ comprise PC beams. Quantity affects yard stock quantity, and as yard stock quantity increases, the required yard stock area increases. Hence, quantity indirectly affects the yard stock area. The required yard stock area increases in proportion with the area of a PC member and the yard stock quantity. In addition, in-situ production quantity can be increased as the available yard stock area increases.
Number of molds: The number of molds increases as the in-situ production quantity increases, and the number of molds affects the production area. Moreover, the number of molds affects the in-situ production quantity; thus, they affect each other. The material of the mold used in the example site is the same steel mold used in factories (Lim and Kim Citation2020a). The steel mold applied to in-situ production is the same specification manufactured by the company manufacturing and supplying materials to the plant. The steel mold is reused at least 50 times. As the number of molds increases, the number of PC members produced at one time increases, and thus, the yard stock area increases. The mold type varies according to the size of PC members.
Lead-time: When applying in-situ production, an additional process plan is required with the overall construction plan. Lead time is the period of in-situ production before PC members are erected and defines the period from the start of PC production to the start of PC erection. Considering the curing period, PC members must be produced in advance as all the PC members cannot be produced during the erection period. In other words, 100% of PC members produced during lead time must be stacked. Thus, the yard area directly affects the lead time, but the numerical effect cannot be explained. Lead time must be secured because the production period of PC members is longer than the erection period of PC members. As the lead time increases, the required number of molds decreases. However, it does not decrease by more than a certain percentage because the completion date must be observed.
Number of cranes: PC members produced and transported are erected using the lifting equipment. The large building covered in this study has a large floor area and a low number of floors, making it difficult to use a tower crane; therefore, a mobile crane with excellent lifting capacity and maneuverability is used (Lim and Kim Citation2020a). The crane must cover the working area because the crane moves the module related to steel mold and lifts and erects the PC members. Moreover, when the crane establishes an appropriate arrangement plan according to production and the yard stock area, no additional time is required. In other words, the larger the yard stock area, the more efficient crane arrangement should be. Furthermore, there is the management effect on the yard stock area, but the numerical effect cannot be explained.
4. Production and yard stock management
4.1. Concept of production and yard stock area
The production area is the formwork module area, and the yard stock area is the area that is stored until in-situ PC members are erected. As the production area is smaller than the yard stock area, it is important to secure the yard stock area for in-situ PC production. The yard stock area is calculated based on the calculation of the number of yard stock members hourly, daily, and weekly. As all the PC beams cannot be produced with the same mold, the yard stock area for each member type is different and must be calculated separately. The yard stock area of each member is calculated based on the area of each mold type.
In general, in-situ PC production planning requires a production process that satisfies the erection plan, and the area of the mold layout is calculated considering the yard stock space. shows that the required area for the production module is 104 m2, and the required area for the yard stock module is 287 m2. As shown in , the required production area includes boilers for steam curing and a curing membrane. A space of 0.5 m is secured around each production module for the safety and passage of workers. As shown in , the standard was established as a basic module to stack 10 PC beams in 3 layers. In the case of stacking on the floor of the building, not on the ground level, the stacking is carried out in one layer. This is a stack of 30 PC members and requires an area of 847m2. The overall production area is calculated by multiplying the number of molds and the unit production area, as shown in EquationEquation (2)(2)
(2) , and can be calculated by summing the area for all the mold types. In addition, as shown in EquationEquation (3)
(3)
(3) , the yard stock area is calculated by multiplying the number of yard stock members with each mold type and the area with each mold type and summing the obtained values.
Figure 3. Production and yard stock layout for PC beam production.
where ARP is the required production area(m2); NMi is the number of i-type mold(ea), ARYS is the unit production area of i-type mold(m2); ARYS is the required production area(m2); QYSi is the number of yard stock member for i-type mold(ea); AYSi is the unit yard stock area of i-type mold(m2), and i is the number of mold types (1, …, n).
In the field, the number of yard stock members is calculated according to hours, days, and weeks. The number of yard stock members does not include the number of erection members, considering the number of production members. Therefore, the number of yard stock members at the time of construction completion is zero. At time j, the number of yard stock members of the i-type mold is the value that excludes the number of erection members of i-type mold, considering the number of production members of the i-type mold EquationEquation (4)(4)
(4) .
where QYSij is the number of yard stock members of i-type mold for the j period (ea), QPij is the number of production members of i-type mold for the j period (ea), Qij is the number of erection members of i-type mold for the j period (ea), i is the number of mold types (1, …, n), and j is the unit work time for simulation (1, …, m).
4.2. Algorithm for yard stock area
As it is impossible to apply in-situ production when the yard stock area is insufficient, the core factor of the in-situ PC production management is the yard stock area calculation that reflects field conditions. Thus, an algorithm to determine the yard stock area through feedback routine was developed in this study. In the planning and construction stages where the in-situ production is in progress, the management of the yard stock area is required based on the site situations. shows a process to calculate the yard stock area.
Figure 4. Calculation algorithm for the yard stock area.
Details of the detailed algorithm are as follows:
Calculation of the available area
The in-situ production quantity is calculated based on the erection plan, and the available area is derived to calculate the area within the working radius of a crane. Available areas are all areas except for the area where PC members are erected, path to move equipment, workspace, temporary facilities, and production area. Hence, the available area should be calculated according to the progress of the construction EquationEquation (5)(5)
(5) . In this study, the available area was calculated weekly; however, in the actual site, the daily available area can be calculated by reflecting the site situation.
where AAj is the available area for the j period (m2), AT is the total construction area (m2), AEj is the erection area for the j period (m2), AOWj is the other work area for the j period (m2), APj is the production area for the j period (m2), and j is the unit work time for simulation (1, …, m).
As shown in , construction was performed considering 14 RC cores at the actual site. As a 10-m floor wall of warehouse facilities had to be poured concrete, the concrete work was divided into two parts, considering the lateral pressure. Moreover, as the core of this case project is applied reinforced concrete, the core must be poured concrete to be combined with PC columns and beams. Thus, the core has to be constructed together according to the erection plan of PC members. In addition, the construction of the steel structure of the ramp section is carried out with PC work, and the workspace for ramp work is excluded while calculating the available area.
Figure 5. Core location of the case project.
shows the process of core construction. The core construction can be divided into first core construction and second core construction based on concrete pouring. In the first core construction, when scaffold construction and the erection of PC columns of a core are completed, wall reinforcement, formwork, and primary concrete pouring are sequentially performed. For second core construction, when scaffold construction and the form and rebar work of wall, stair, and girder are completed with the erection of PC beams, the rebar work of slab and secondary concrete pouring remains in progress. Then, one core construction is completed, and each core is completed according to the construction schedule.
Figure 6. Core construction process.
Satisfying area requirement
The production and yard stock areas are calculated using EquationEquations (2)(2)
(2) and (Equation3
(3)
(3) ), respectively. If the sum of the production and yard stock areas is smaller than the available area, a production-erection-yard stock schedule is established. However, if the available area is not sufficient, additional area must be secured.
Any additional area
When there is a shortage of yard stock area for in-situ production quantity, additional space must be found on the site. The available area is calculated by summing the working area of the construction that is being carried out at the same time as the in-situ PC production. However, if it is difficult to determine additional area, in-situ production quantity will be reduced.
Reduction of in-situ production quantity
In the case of the yard stock process, it is decided according to the conditions of the site to be produced in-situ. If the yard stock of PC members cannot be secured on the site, the problem must be solved by the in-plant production of other members. In other words, it is necessary to reduce the in-situ production quantity. If the required yard stock area is not sufficient within the site after review, the number of yard stock members is reduced for some members. A suitable production method can be selected for each project based on the advantages of in-situ production and in-plant production.
Creation of a production-erection-yard stock schedule
A production-erection-yard stock schedule is created by reducing the in-situ production quantity. shows a production-erection-yard stock schedule of 10 weeks with a lead-time of 5 weeks. First, PC members are produced, and when the number of erected members is excluded, the number of yard stock members is estimated. For example, at period W + 2, the number of members produced in periods W + 1 and W + 2 is accumulated, and the number of yard stock members is 80. At W + 6, the number of stocked members is 160, excluding the number of erected members (80) from the accumulated production members (240) over 6 weeks. The periods W + 1 to W + 5 denote the lead-time for production, and W + 10 is the time-lag for erection. The production period can be calculated as the sum of lead time for in-situ production and erection period excluding time lag (Na and Kim Citation2017).
Figure 7. Production-erection-yard stock schedule.
Simulating yard stock
Yard stock simulation is conducted based on the shop drawing and production schedule. Using the queue and stack theory, the stacking rules are created, and detailed plans for yard stock have been established. In the case of a three-layer yard stock, erection order is different from in-situ production order. Therefore, various stacking rules are required for yard stock simulation. To manage the order of production and erection, Rule 1 for yard stock in the section view was established (). The PC members of the storage yard are sequentially stacked from the first to nth stacking yard.
Figure 8. Stacking rules of PC beams.
Rule 1 shows production and erection as first in first out (FIFO) from left to right using the queue method and as first in last out (FILO) from top to bottom using the stack method (Yoon Citation1997; Kim Citation2005). As yard stock on the fourth floor is applied to a one-layer stacking, an additional yard stock plan is not required. In the case of yard stock consisting of a n × m matrix in a stack method for rows and a queue method for beams, the PC location of the production and erection orders for yard stock rule 1 is determined as expressed in EquationEquation (6)(6)
(6) . The total number of PC members in one stacking yard can be obtained by multiplying the number of stacking layers and beams.
where pij is the production number of members of the ith row and jth beam, eij is the erection number of members of the ith row and jth beam, i is the number of rows (1, …, n), and j is the number of beams (1, …, m).
While the stacking and erection directions of produced members are the same according to stacking rule 1, stacking rule 2 implies that the stacking and erection directions are opposite. shows yard stock rule 2 EquationEquation (7)(7)
(7) . Rule 2 defines production and erection pertaining to FILO from left to right and from top to bottom using the stack method. When the rows and beams are part of a stacking yard comprising an n × m matrix of a stack method, the location of the stacking and production orders can be expressed as follows:
where pij is the production number of members of the ith row and jth beam, eij is the erection number of members of the ith row and jth beam, i is the number of rows (1, …, n), and j is the number of beams (1, …, m).
Satisfying quantity requirement
The feasibility of yard stock simulation is judged on whether it can be applied to in-situ production. If it is not satisfied, the quantity is reduced, and the simulation is performed again. As the yard stock area is changed according to the quantity scale, it is necessary to derive an appropriate quantity.
where AA is the available area (m2), ARP is the required production area (m2), Creq is the required cost (USD), Cavail is the available cost (USD), Treq is the required time (month), and Tavail is the available time (month).
Application in the site
The yard stock area calculation and simulation are completed through feedback routine using the algorithm. If correction is needed according to the changes in site conditions during construction, it can be solved using each step of this algorithm.
5. Development of the integration management model
The integration management model was developed using Powersim Studio 10 Expert. This model can be simulated using influencing factors such as in-situ production quantity, lead-time, number of molds, and number of cranes (). Random values were presented following the probability distribution of each influencing factor based on Monte Carlo simulation (Lim and Kim Citation2020b). The probabilistic method of Monte Carlo simulation was applied to overcome the mathematical limitations of the deterministic method (Eretec Citation2005; Maio et al. Citation2000).
5.1. Production management model
The mold type designed according to the size of PC beams was applied as the simulation model, and the production simulation model created for one of the mold types is shown in . In , the in-situ production schedule is calculated based on lead time, time lag, erection start date, and erection completion date. It is a weekly simulation model and thus requires information pertaining to the production cycle and the number of working days per week. When the number of production cycles per a week is calculated, the number of productions is used to the calculation of the number of molds together with the total quantity and in-situ production time (B). Lim, Kim, and Kim (Citation2020a) calculated the quantity according to the limited yard stock area. However, a model was developed to weekly calculate the number of PC members according to the erection plan based on the in-situ production quantity among the overall quantity (C). Production quantity per week can be calculated using the number of production counts per week and the number of molds, and the accumulated production members were calculated using production quantity per a week (D). The production area for mold type 1 can be calculated using the calculated number of molds and unit production area (E). The production area of each zone can be obtained from the sum of production areas of each mold type, and the total production area for the project can be obtained from the summation of all the zones.
Figure 9. Production area estimation simulation model (mold type 1 for in-situ production).
5.2. Yard stock management model
shows the yard stock area estimation simulation model for zone A. This model was developed considering the work area of other constructions that affect PC construction when in-situ production is applied to the site. It calculated the weekly yard stock quantity by the weekly erection quantity from ) and the accumulative production quantity, and derived the total erection area of zone A using number of layers and the unit erection area (A). The total area of the formwork, concrete work, steel framework, and temporary facilities required for core construction is summed to calculate the area of the work that proceeds simultaneously with the in-situ production of PC members (B). The area of independent steel structure work is calculated (C). The total work area of other constructions is calculated by summing other work areas related to and not related to the in-situ production of PC members. The required yard area of zone A based on the sum of the yard stock area by each mold type is calculated, and the required production area of zone A based on the sum of the production area by each mold type is calculated. Finally, if the sum of the total required area is less than the available area, it is recalculated (D).
Figure 10. Yard stock area estimation simulation model (Zone A for in-situ production).
6. Simulations and results
6.1. Selection of a case project
The selected case project is a scale of 4 stories, with a PC structure for 2–4 stories, a reinforced concrete structure for the core, and a steel structure for the roof. Thus, this study is limited to 2–4 floors of the PC structure. During analysis, the number of beams was 1284. The PC beam is 0.5–1.3 m wide, 1.0–2.6 m high, and 11.0–23.0 m long, and its volume is 11.0–34.8 . A mold type, applied to the case project, is derived by considering the size of PC members. As the same member size can be applied to the same mold, three mold types of beams are applied according to the member size. The number of beams produced based on mold type is as follows: type 1–96, type 2–960, and type 3 (I-girder) – 196.
6.2. Simulation scenario
In-situ production is determined based on the calculation of construction period and cost, and the quantity can be calculated based on the yard stock area. The in-situ production period is assumed to be satisfactory as it is used while calculating the in-situ production quantity based on the construction preparation stage. In this study, eight quantity scenarios were set as constraints for the case of repeatedly reducing the quantity owing to the lack of the yard stock area. One type of member was selected to analyze the relationship of the yard stock area with PC members, and the majority of the members were beams. To analyze the change according to the PC member ratio, random ratios were applied: 1%, 3%, 5%, 10%, 50%, 75%, 87%, and 100% (). To examine the yard stock area and cost for a small number of PC members, a simulation was performed that set a small proportion of members such as 1%, 3%, and 5%.
Table 1. Quantity scenarios for simulation.
6.3. Calculation of the maximum yard stock area
The maximum yard stock area and cost in terms of the quantity is compared based on scenarios. As the yard stock area varies based on period, the available area must be secured by deriving the highest value within the yard stock area. By conducting the simulation model developed in this study, the yard stock area for the quantity of each scenario was calculated. The Monte Carlo simulations were performed 1000 times, and the results of each scenario were compared. The yard stock areas of scenarios (1)–(8) were 59, 181, 520, 936, 3367, 4576, 5044, and 5941 m2, respectively (). If the yard stock area of scenario (8) covered 100%, scenarios (1)–(7) covered 0.99%, 3.05%, 8.75%, 15.75%, 56.7%, 77.02%, and 84.90%, respectively. The graph is shown in , and It was derived that the yard stock area increases as the quantity increases.
Figure 11. Results analysis of yard area and cost for quantity.
Table 2. Comparison of results based on scenarios.
Although scenario (3) showed the highest cost reduction ratio of 23.03%, it incurred only 40,000 USD. However, the reduced cost of scenario (8) was the highest at 739,000 USD, and the cost reduction ratio was 21.38%. In other words, it can be seen that in-situ production can reduce the cost by over 20.12% compared with in-plant production. Moreover, the reduced cost proportionally increases along with the number of members. The high cost-reduction rate is owing to the fact that the same number of members was produced in-situ and was not considerably affected by other factors, such as additional work required by different sizes of members.
As shown in , when the number of PC members in scenario (1) is 10, the in-situ production has incurred 38.72% higher cost than in-plant production. As per the analysis, in-situ production is preferred for a large number of PC members, but in-plant production is preferred for a small number of PC members. The reason is that when the number of PC members decreases, the number of steel molds that is reused decreases, resulting in an increase in the in-situ production cost as the manufacturing cost of steel molds is high. In addition, it is possible to derive that the cost reduction ratio does not increase as the quantity increases. Lim et al. (Citation2020b) estimated that in-situ production has a maximum savings of 39.4% compared with in-plant production. However, as described in this study, the cost reduction ratio has a maximum reduction effect of 23.03% and does not increase beyond a certain level. Therefore, even if in-situ production quantity is increased, the cost reduction ratio and reduced cost would not increase.
Scenario (8) derived a maximum yard stock area of 5,941 m2 during the period W + 6. The reason for showing the highest yard stock area at W + 6 is that the produced PC members during the lead time of 6 weeks were accumulated, and the number of yard stock members started to decrease as the erection of PC members at the period W + 7. That is, the lead-time was 5 weeks, during this period only in-situ production and yard stock were conducted, and no PC member was installed. shows the weekly site plan after PC member erection starts. Crane A was placed in zone A, crane B in zone B, and crane C in zone C. For a large precast concrete structure with a large floor area, a construction plan should be established in accordance with the safe working path, considering the productivity of mobile cranes. In the case site, PC erection was performed with three mobile cranes (two cranes weighing 550 tons each and the other weighing 450 tons). An in-situ production and yard stock plan were established within the working radius of these cranes. Three cranes were applied because two cranes are impossible to be used in consideration of time, and four cranes is impossible to be used in consideration of cost. As shown in , mobile cranes can perform erection while moving. If PC members are produced within the working radius of cranes, an additional horizontal movement of the members is not required. In other words, the transportation process of members during the yard stock period is omitted by an efficient construction plan, and there is no cost involved.
Figure 12. Weekly site plan.
) shows the production and yard stock status at W + 6. The production areas of zones A, B, and C are 245, 280, and 280 m2, respectively, and the yard stock areas of zones A, B, and C are 1794, 2067, and 2080 m2, respectively. The total yard stock members were 460. In the case of a large building, as considered in this study, the in-situ production of PC members can be carried out at a limited place within the working radius of the crane for easy erection. As the erection of each floor, it is checked whether production and yard stock areas in zones A, B, and C are secured, and the crane location is changed according to the erection schedule of PC members. In this study, the first floor was maximally utilized for production and yard stock area. And the 2nd, 3rd, and 4th floors can be used if space is insufficient. The core and PC structures must be simultaneously poured with concrete to unify the structure. The PC members are erected excluding the working path in consideration of the core construction process shown in . The reason is that PC members should not be erected in the passage to supply materials and equipment necessary for core construction. When the core construction was completed, it was erected from PC columns on the first floor.
In the production area of (a) and (b), the number of molds in zones A, B, and C is 8, 8, and 7, respectively. And in , production was completed in zone C, and the number of molds in zone A and B were 8 and 8, respectively. In ), as production was completed in zone A, the number of molds in zone B was 8. This means that the time-leg period started as the production of PC members in zone A and zone C was completed and only erection was conducted. In addition, in , the production area of PC members has to be moved to because it is difficult to produce in the same place as the erection area is added. Comparing the production area of zone A in and (c), the movement is clearly visible. This shows that the production area was moved to an extra space after PC members stacked within the crane radius were erected. If the amount of production and yard stock members increases when applied to in-situ production, PC members can be produced and stacked on the second floor of the building by moving the production area in consideration of the core construction. In this study, only the mold type that has the most members among the beams was selected and applied, so the production and yard stock space was sufficient. Therefore, it was not necessary to use the floors on the 2nd, 3rd, and 4th floors as the yard stock area, and only the A zone used the floors on the 2nd floor in Figure (a) and (b), and 3rd floor in Figure (c) as the production area.
The case study conducted in this study was used only yard stock rule 1 of ) due to sufficient yard stock space and working radius of cranes. shows the yard stock quantity of Zone A in and (b) were calculated during W + 6 and W + 8. The yard stock members were calculated to be 92 and 60, respectively, and PC members were stacked using the initial yard stock simulation data produced by the shop drawings and production schedule as shown in ). And ) shows that 32 of the 92 yard stock members have been erected and 60 yard stock members remain.
Figure 13. Yard stock of PC beams.
7. Discussion
Several prior studies have verified that it is possible to secure the quality and economic feasibility of in-situ production (Hong et al. Citation2014; Lim Citation2016; Oh Citation2017; Lee et al. Citation2011b). Lim et al. (Citation2020b) stated that few in-plant-produced members were reproduced owing to cracks, size breakage problems, and different rebar arrangements based on shop drawings. This study was conducted under the assumption that there were no problems with cracks, breakages, size, and strength quality standards of PC production and erection guidelines according to Korea Concrete Institute (KCI) when in-situ production was applied to the actual field. In addition, according to an interview with an official of the PC factory, it was confirmed that the factory owner would not sign a contract if the official did not earn a profit of 20% or more of the production cost. The reason is that this cost could not cover the overhead of factory management (Lim Citation2018).
In-situ production targets thin parts such as columns and beams, and the simulation of this study was performed for PC beams. PC slabs, such as Rib-Plus Slab (RPS) and double T slabs, require a large space during production; therefore, in-plant production is more advantageous than in-situ production (Lim et al. Citation2020b). In addition, to increase the reuse of molds, this study assumed that the size of a PC member and the details of a reinforcing bar arrangement were similar and the PC member was produced in the field with one mold type. In fact, when applying in-situ production, the mold types of the same size are not used. As beams and columns of various sizes are produced, different results are derived in this study. In other words, when members with different sizes and different reinforcing bar details are applied, the cost reduction ratio can be different.
In general, even if PC columns and beams of the same size are designed, the rebar arrangement is not completely same. Therefore, if PC members are designed with the same rebar arrangement for in-situ production, cost can be reduced, and management will be easier. In addition, the case project of long-span and heavy-loaded buildings in this study can easily secure the yard stock area owing to the long distance between columns. However, different results can be derived depending on the site characteristics and building size.
In this study, when a small number of PC members were produced in situ, the cost of in-situ production was higher than that of in-plant production. In general, when the in-plant production quantity decreases, the unit price of a PC member increases. But this study was not applied owing to the difficulty of obtaining cost data from PC factory. In other words, a higher ratio than the actual ratio was derived because the unit price pertaining to in-plant production according to the changed quantity of in-situ production was not reflected. In future studies, practical utility should be maximized by investigating a realistic cost considering the unit price pertaining to in-plant production according to the in-situ production quantity.
8. Conclusion
This study developed an integrated simulation model for production and yard stock management based on system dynamics using Powersim Studio 10 Expert. This model can dynamically predict, control, monitor, and manage four major influencing factors affecting yard stock area for in-situ production. And eight scenarios were set and applied. The conclusions of this study are as follows.
First, using the simulation of the integrated management model, it was confirmed that in-situ production was able to reduce cost by up to 739,000 USD compared with in-plant production. In addition, it was shown that a cost reduction of over 20.12% is possible. Using the integrated management model, the yard stock area under various scenarios was quickly and easily calculated. And it was revealed that the reduced cost increased in proportion to the number of members when one mold type member was produced in-situ. Further, the cost reduction ratio has a maximum reduction effect of 23.03% and does not increase more than a certain ratio.
Second, when the quantity was 10 members, the in-situ production incurred 38.72% higher cost than the in-plant production. Thus, it was analyzed that the smaller the number of members, the more advantageous is the in-plant production than the in-situ production. This is because the number of reused steel molds decreases if the number of PC members decreases. As the manufacturing cost of steel molds is high, the in-situ production cost increases.
Third, the yard stock area was calculated by reflecting the areas of other works, i.e., core construction, that were simultaneously in progress. The yard stock area for the maximum cost saving was 5941 m2. It was confirmed that the proposed integration management model can support decision-making on whether or not in-situ production can be applied to the field.
Fourth, in ) and (c), it is difficult to produce PC members in the same place because the erection area is added, so the production area has to be moved. However, the production and yard stock space were sufficient because only one mold type was selected and applied in this case study, so it was moved only once. However, if the production area on the first floor is insufficient due to increasing PC production members, the floors on the 2nd, 3rd, and 4th floors will be usable as the yard stock area. In addition, using the yard stock simulation data produced in the planning stage, showed that 32 of 92 yard stock members were erected and 60 yard stock members remained. Using this, it will be applicable to the case of stacking PC members produced in the field at the actual site.
The developed model can control the influencing factors of in-situ production and can quickly and easily simulate the time-varying factors during the project to derive an appropriate value according to the situation. It is possible to establish and review the construction plan of in-situ production using the proposed model at the initial stage of the project. If there is a change in the relationship between the influencing factors in future according to the various conditions at the construction site, the influencing factors can be redefined. In addition, it is necessary to study the development of models in terms of risk analysis and explore yard stock management in detail, for instance, considering storage yard management. In future, it is necessary to analyze the relationship between the storage yard and cranes and investigate schedule management.
Disclosure statement
No potential conflict of interest was reported by the author(s).
Additional information
Funding
Notes on contributors
Jeeyoung Lim
Jeeyoung Lim is a researcher at Department of Architectural Engineering, Pusan National University in South Korea. She was a lecturer and a researcher at California State University Long Beach in USA. She studied Construction Engineering and Management at the department of architectural engineering, Kyunghee University in South Korea. She had joined three Korean construction firms, Iksungtech Co., Ltd, Kunwon Architects & Engineers Corp., Universe Top Engineering Architects for 5 years. She has concentrated on the research such as development of sustainable construction technology and management, production technology of free-form concrete panels, cost management of precast concrete, simulation, optimization, and risk management.
Dae Young Kim
Dae Young Kim is an associate professor at Department of Architectural Engineering, Pusan National University in South Korea. He was an assistant professor at Department of Architectural Engineering, Dongeui University in South Korea. He was a researcher at Center for Transportation Research in USA. He studied Construction Engineering and Management at Department of Architectural Engineering, University of Texas at Austin. He was a consultant at Texas Governor's Division of Emergency Management for construction project development support and advice. He has concentrated on the research such as evaluating and managing the social and economic feasibility.
References
- Abdul-Rahman, H., C. Wang, and K. S. Eng. 2011. “Repertory Grid Technique in the Development of Tacit-Based Decision Support System (TDSS) for Sustainable Site Layout Planning.” Automation in Construction 20 (7): 818–829. doi:10.1016/j.autcon.2011.02.004.
- Arashpour, M., R. Wakefield, B. Abbasi, E. W. M. Lee, and J. Minas. 2016. “Off-site Construction Optimization: Sequencing Multiple Job Classes with Time Constraints.” Automation in Construction 71: 262–270. doi:10.1016/j.autcon.2016.08.001.
- Choi, J., H. Kim, and I. Kim. 2015. “Open BIM-based Quantity Take-off System for Schematic Estimation of Building Frame in Early Design Stage.” Journal of Computational Design and Engineering 2 (1): 16–25. doi:10.1016/j.jcde.2014.11.002.
- Eretec. 2005. Crystal Ball Training Manual. Eretec.
- Forrester, J. W. 1987. “Lessons from System Dynamics Modeling.” System Dynamics Review 3 (2): 136–149. doi:10.1002/sdr.4260030205.
- Gransberg, D. D., and C. Riemer. 2009. “Impact of Inaccurate Engineer’s Estimated Quantities on Unit Price Contracts.” Journal of Construction Engineering and Management 135 (11): 1138–1145. doi:10.1061/(ASCE)CO.1943-7862.0000084.
- Hong, W. K., S. K. Kim, and S. I. Kim. 2010. “Load Carrying Capacity of Structural Composite Hybrid System (Green Frame).” The International Journal of the Korea Institute of Ecological Architecture and Environment 10 (1): 25–31.
- Hong, W. K., G. Lee, S. Lee, and S. Kim. 2014. “Algorithms for In-situ Production Layout of Composite Precast Concrete Members.” Automation in Construction 41: 50–59. doi:10.1016/j.autcon.2014.02.005.
- Hwang, B. G., M. Shan, and K. Y. Looi. 2018. “Key Constraints and Mitigation Strategies for Prefabricated Prefinished Volumetric Construction.” Journal of Cleaner Production 183: 183–193. doi:10.1016/j.jclepro.2018.02.136.
- Hyari, K. H., N. Shatarat, and A. Khalafallah. 2017. “Handling Risks of Quantity Variations in Unit-price Contracts.” Journal of Construction Engineering and Management 143 (10): 04017079. doi:10.1061/(ASCE)CO.1943-7862.0001393.
- Jung, H. T., and M. S. Lee. 1992. “A Study on the Site-production Possibility of the Prefabricated PC Components.” Proceeding of the 1992 Autumn Annual Conference of the Architectural Institute of Korea 12 (2): 629–636. Seoul, Korea.
- Kang, S. M., and O. J. Kim 2006. “Domestic and Foreign Present Situation Analysis of a PC Method.” Daelim Technology Research Institute, Architecture (Spring) 28–37.
- Kim, D., T. Moon, and D. Kim. 1999. System Dynamics, Daeyoung Book, 13–59. Seoul, Korea.
- Kim, K. Y. 2005. Inventory Management for Logistics Bases. Hyomin.
- Kim, S. H., G. H. Kim, and K. I. Kang. 2004. “A Study on the Effective Inventory Management by Optimizing Lot Size in Building Construction.” Journal of the Korea Institute of Building Construction 4 (2): 73–80. doi:10.5345/JKIC.2004.4.3.049.
- Lee, G. J. 2012. “A Study of In-situ Production Management Model of Composite Precast Concrete Members” PhD diss. Kyung Hee University.
- Lee, G. J., J. K. Joo, S. H. Lee, and S. K. Kim. 2011b. “A Basic Study on the Arrangement of In-situ Production Module of the Composite PC Members.” Proceeding of the 2011 Autumn Annual Conference of the Korea Institute of Building Construction 11 (2): 29–30. Seoul, Korea.
- Lee, G. J., S. H. Lee, J. K. Joo, and S. K. Kim. 2011a. “A Basic Study of In-Situ Production Process of PC Members.” Proceeding of the 2011 Autumn Annual Conference of the Architectural Institute of Korea 31 (2): 263–264. Seoul, Korea.
- Lee, J. M., J. H. Yu, and C. D. Kim. 2007. “An Economic Order Quantity (EOQ) Determination Method considering Stock Yard Size.” Proceeding of the 2007 Autumn Annual Conference of the Korea Institute of Construction Engineering and Management 549–552 Seoul, Korea.
- Lee, J. M., J. H. Yu, C. D. Kim, K. J. Lee, and B. S. Lim. 2008. “Order Point Determination Method considering Materials Demand Variation of Construction Site.” Journal of the Architectural Institute of Korea 24 (10): 117–125.
- Lee, M. S. 1994. “A Study on the Composition and Flexible Planning of the Component Housing.” Journal of the Architectural Institute of Korea 10 (5): 3–11.
- Li, H., and P. E. Love. 2000. “Genetic Search for Solving Construction Site-Level Unequal-Area Facility Layout Problems.” Automation in Construction 9 (2): 217–226. doi:10.1016/S0926-5805(99)00006-0.
- Lim, C. 2016. “Construction Planning Model for In-situ Production and Installation of Composite Precast Concrete Frame.” PhD diss. Kyung Hee University.
- Lim, C., J. K. Joo, G. J. Lee, and S. K. Kim. 2011a. “Basic Analysis for Form System of In-situ Production of Precast Concrete Members.” Proceeding of the 2011 Autumn Annual Conference of Construction Engineering and Management 12 (1): 137–138. Seoul, Korea.
- Lim, C. Y., J. K. Joo, G. J. Lee, and S. K. Kim. 2011b. “In-Situ Production Analysis of Composite Precast Concrete Members of Green Frame.” Journal of the Korea Institute of Building Construction 11 (5): 501–514. doi:10.5345/JKIBC.2011.11.5.501.
- Lim, J. 2018. “A Risk Management Model for In-situ Production of Precast Concrete Members Focused on Time and Cost Using System Dynamics.” PhD diss. Kyung Hee University.
- Lim, J., and J. J. Kim. 2020b. “Dynamic Optimization Model for Estimating In-Situ Production Quantity of PC Members to Minimize Environmental Loads.” Sustainability 12 (19): 8202. doi:10.3390/su12198202.
- Lim, J., and S. Kim. 2020a. “Evaluation of CO2 Emission Reduction Effect Using In-situ Production of Precast Concrete Components.” Journal of Asian Architecture and Building Engineering 19 (2): 176–186. doi:10.1080/13467581.2020.1726763.
- Lim, J., S. Kim, and J. J. Kim. 2020a. “Dynamic Simulation Model for Estimating In-situ Production Quantity of PC Members.” International Journal of Civil Engineering 18 (8): 935–950. doi:10.1007/s40999-020-00509-4.
- Lim, J., K. Park, S. Son, and S. Kim. 2020b. “Cost Reduction Effects of In-situ PC Production for Heavily Loaded Long-span Buildings.” Journal of Asian Architecture and Building Engineering 19 (3): 242–253. doi:10.1080/13467581.2020.1740095.
- Maio, C., C. Schexnayder, K. Knitson, and S. Weber. 2000. “Probability Distribution Function for Construction Simulation.” Journal of Construction Engineering and Management 126 (4): 285–292. doi:10.1061/(ASCE)0733-9364(2000)126:4(285).
- Mao, C., Q. Shen, W. Pan, and K. Ye. 2015. “Major Barriers to Off-site Construction: The Developer’s Perspective in China.” Journal of Management in Engineering 31 (3): 04014043. doi:10.1061/(ASCE)ME.1943-5479.0000246.
- Moon, K. J. 2001. “A Study on the Sustainability of an Urban System: By the Application of A System Dynamics Model” PhD diss., Pusan National University.
- Na, Y. J., and S. K. Kim. 2017. “A Process for the Efficient In-situ Production of Precast Concrete Members.” Journal of the Regional Association of Architectural Institute of Korea 19: 153–161.
- Ning, X., K. C. Lam, and M. C. K. Lam. 2010. “Dynamic Construction Site Layout Planning Using Max-Min Ant System.” Automation in Construction 19 (1): 55–65. doi:10.1016/j.autcon.2009.09.002.
- Oh, O. J. 2017. “A Model for Production and Erection Integration Management of Large Scale PC Structures Using System Dynamics.” PhD diss. Kyung Hee University.
- Osman, H. M., M. E. Georgy, and M. E. Ibrahim. 2003. “A Hybrid CAD-Based Construction Site Layout Planning System Using Genetic Algorithms.” Automation in Construction 12 (6): 749–764. doi:10.1016/S0926-5805(03)00058-X.
- Pan, M., T. Linner, W. Pan, H. Cheng, and T. Bock. 2018. “A Framework of Indicators for Assessing Construction Automation and Robotics in the Sustainability Context.” Journal of Cleaner Production 182: 82–95. doi:10.1016/j.jclepro.2018.02.053.
- Pan, M., and W. Pan 2016. “Advancing Formwork Systems for the Production of Precast Concrete Building Elements: From Manual to Robotic.” In Proceedings of 2016 Modular and Offsite Construction (MOC) Summit, 2–9. Banniff, AB, Canada.
- Pan, M., and W. Pan. 2019. “Determinants of Adoption of Robotics in Precast Concrete Production for Buildings.” Journal of Management in Engineering 35 (5): 05019007. doi:10.1061/(ASCE)ME.1943-5479.0000706.
- Pan, W., A. G. F. Gibb, and A. R. J. Dainty. 2012. “Strategies for Integrating the Use of Off-site Production Technologies in House Building.” Journal of Construction Engineering and Management 138 (11): 1331–1340. doi:10.1061/(ASCE)CO.1943-7862.0000544.
- Park, H., S. Park, K. Hong, and S. Kim. 2011. “Development of Residential PC Prefabricated Building Structure System.” Construction Engineering and Management 12 (1): 11–16.
- Park, J. H., S. J. Kim, M. S. Paik, S. H. Lee, B. K. Park, and S. J. Jung 2007. “An Experimental Study on Strength Characteristics of Mass Concrete Cast with High-strength Concrete for Precast Application.” In Proceeding of the 2007 Autumn Annual Conference of the Korea Concrete Institute, 585–588. Seoul, Korea.
- Son, C., J. Son, C. Kim, J. Kim, B. Anh, S. Hwang, K. Kwak, S. Kim, and T. Je. 1997. Development of Production-Translation-installation Integrated System for the Large Panel P.C. Construction. Korea Land and Housing Corporation.
- Song, K. J., U. K. Lee, S. H. An, and K. I. Kang. 2005. “PC Production Schedule Optimization Model Using a Genetic Algorithms and Random Keys.” Proceeding of the 2005 Autumn Annual Conference of the Architectural Institute of Korea 25 (1): 487–490. Seoul, Korea.
- Thomas, H., M. Horman, R. Minchin Jr., and D. Chen. 2003. “Improving Labor Flow Reliability for Better Productivity as Lean Construction Principle.” Journal of Construction Engineering and Management 129 (3): 251–261. doi:10.1061/(ASCE)0733-9364(2003)129:3(251).
- Won, I., Y. Na, J. T. Kim, and S. Kim. 2013. “Energy-Efficient Algorithms of the Steam Curing for the in Situ Production of Precast Concrete Members.” Energy and Buildings 64: 275–284. doi:10.1016/j.enbuild.2013.05.019.
- Yeh, I. C. 1998. “Quantity Estimating of Building with Logarithm-neuron Networks.” Journal of Construction Engineering and Management 124 (5): 374–380. doi:10.1061/(ASCE)0733-9364(1998)124:5(374).
- Yoon, D., W. Hong, and T. Yoon. 2010. “Half Slab Construction for Eco-friendly Composite Frame System.” Proceeding of the 2010 Autumn Annual Conference of the Korea Institute of Building Construction 10 (2): 15–18. Seoul, Korea.
- Yoon, S. 1997. Inventory Management Methods and Applications, 25–29. Sigongsa.
- You, Y. C., K. D. Choi, K. H. Kim, and L. H. Lee. 2001. “Mechanical Bar Anchorage of the PC in Beam-column Joint.” Journal of the Architectural Institute of Korea 17 (5): 35–42.
- Yun, J. S., J. H. Yu, and C. D. Kim. 2011. “Economic Order Quantity(EOQ) Determination Process for Construction Material considering Demand Variation and Stockyard Availability.” Korea Journal of Construction Engineering and Management 4 (2): 73–80. doi:10.6106/KJCEM.2011.12.1.33.