
 ?Mathematical formulae have been encoded as MathML and are displayed in this HTML version using MathJax in order to improve their display. Uncheck the box to turn MathJax off. This feature requires Javascript. Click on a formula to zoom.
ABSTRACT
The present study aims to reveal the deterioration law and service life of concrete durability in the saline soil area of western China. For this purpose, the indoor accelerated tests with multiple damage factors including compound salt erosion, dry-wet cycle, freeze-thaw damage, and solar radiation were designed. The deterioration mechanisms of concrete durability were analysed from both macroscopic and microscopic aspects. The Birnbaum-Saunders (B-S) model was selected for modeling, and parameters were estimated by various methods such as moment estimation method (MEM), inverse estimation method (IMEM), quantile estimation Method (QEM), regression estimation method (REM), and maximum likelihood method (MIM). The results showed that under the action of multiple damage factors, the surface of the concrete gradually becomes rough and pitted from the initial smooth and flat surface. As the concrete’s interior gel is not dense, rod-shaped, and needle-shaped corrosion products were formed. For the two-parameter model, the reliability curve, density curve, and failure rate curve obtained by the QEM differ the most from the other 5 types of parameter estimation methods. When the MEM is used for parameter estimation, the difference between the two-parameter model and the three-parameter model under the same reliability level is relatively small.
1. Introduction
The durability of concrete is a direct manifestation of the comprehensive effect of its material properties and the external service environment. It is required to have the ability to maintain a good appearance within the specified time of design (Lin Citation2014), which is one of the critical contents of concrete reliability (Yu, Lie Ning, and Li Citation2017; Yang, He, and Yan Citation2019). However, in the actual service environment, especially the saline soil environment in western China, under the combined effects of climate and environment, concrete structures’ service life often fails prematurely before reaching the design life (Hongxia et al. Citation2015; Hongliang etal. Citation2015; Xiaoping et al. Citation2014) brings significant safety hazards to users. Therefore, starting from the damage factors of the concrete structure, designing a durability test closer to the actual service environment, and carrying out a quantitative study on the durability life on this basis, it is of great significance for improving the service life and safety of the concrete structure (Li et al. Citation2016; Van Belleghem et al. Citation2017). Aiming at the durability quantification of concrete materials and structures, scholars have carried out various researches. Based on Fick’s law, Gao Zirui established a chloride ion transport model considering diffusion, bonding, and electric field migration and realized the time and space quantification of chloride ions in fly ash concrete (Zirui et al. Citation2016). In a recent study, Tang Yujuan obtained the gas diffusion model of concrete pore structure from the capillary bundle geometric model and quantitatively analyzed the influence of water saturation, water-binder ratio, temperature, and other factors on the gas diffusion of concrete (Xiaobao, Tang, and Guangji Citation2015). In the experimental study, Pang Long combined environmental factors and loads to obtain an environmental load model; while evaluating marine concrete’s life in ports, he also compared with existing international quantitative models and pointed out an improved method (Pang et al. Citation2016). In response to the durability life-based model of concrete, Parichatprecha proposed using a neural network for quantitative analysis of the durability of high-performance concrete and established a life prediction model considering the water-binder ratio, fly ash content, and silica fume content (Parichatprecha and Nimityongskul Citation2009). On the other hand, Li used the finite element method to realize the relationship between the deterioration of concrete and the mechanical indexes under the condition of freeze-thaw cycles (Li and Gu Citation2010). In order to simulate the damage and deterioration of reinforced concrete structures caused by corrosion and fatigue loads, Ma conducted a series of fatigue crack growth tests of steel bars in air and solution environment, taking full account of cyclic loading, concrete cracking, seasonal environmental changes, stress concentration, and many other factors that have an impact on the mechanical properties of concrete structures, and then established a life prediction model and a constitutive relationship model that quantitatively describes the mechanical behavior of the reinforcement after fatigue (Yafei et al. Citation2020, Citation2021).
Besides, Wang Jiabin and others also focused on the quantitative durability model for concrete carbonization, corrosion salt erosion, and steel rust expansion problems and predicted the service life (Yunzhe, Kaifeng, and Bin Citation2020; Kwon etal. Citation2016; Wei et al. Citation2018), which greatly enriched the quantitative theory of durability life. However, the majority of the researchers focused on the deterioration analysis and life prediction of a specific erosion environment in which concrete is exposed, as well as ways for slowing down the deterioration rate of concrete materials in that environment. The actual service environment of concrete structures is usually very complicated, and often eroded and deteriorated by multiple damage factors. The prediction models proposed in a specific corrosive environment are only for a durability index of concrete, and these prediction models can only be calculated with the help of computers. There are simplifications and complete idealizations in the setting of boundary parameters. It is not completely objective and comprehensive to evaluate the overall performance and real life of concrete materials, and the improvement suggestions put forward also have certain limitations.
Different from the above life quantification model based on material properties, the B-S distribution function is a mathematical model combining mathematical statistics and probabilistic reliability, which can well describe the reliability level of products in different acceleration environments to realize the quantification of product properties. Especially for damage degradation caused by periodic fatigue damage, its applicability is stronger, and this distribution function has been used in medical, electronic products, etc. (Barriga et al. Citation2020; Xiaoling, Ronghua, and Gu Citation2020). Compared with the traditional Weibull distribution model, the B-S distribution model can not only use failure data for product performance evaluation but also use degradation data for quantitative prediction. At the same time, only a small number of samples are needed to estimate the relevant parameters, while the traditional Weibull distribution and normal distribution require a large number of samples to achieve more accurate parameter estimation (Jianyin et al. Citation2006). Based on this, this paper designs a multi-damage factor indoor accelerated test to maximize the simulation of the macroscopic damage, degradation law, and microscopic corrosion mechanism of concrete under multiple corrosive salt erosion, dry-wet cycles, and freeze-thaw cycles. Based on a small sample of life data, the B-S distribution model will use to discuss the applicability of the two-parameter and three-parameter B-S model, compare and analyze the influence of each parameter estimation method on the durability life evaluation results. At the same time, a reliability model with stronger engineering applicability, simpler parameter estimation and more accurate evaluation results should be found to evaluate the life of concrete in the accelerated environment more accurately. It is expected to provide a reference for the quantification, life evaluation, prediction research, and durability design of concrete durability degradation in the western saline soil area.
2. Experimental scheme designs
This paper selects the Xining City of Qinghai Province, which has typical saline soil characteristics and western climate characteristics to fully reveal the erosion characteristics and deterioration law of concrete in the west of the saline soil environment China. The indoor accelerated test under an artificial climate environment was designed to simulate the process of concrete from integrity to deterioration in the western saline soil environment. Simultaneously, in the process of the deterioration of concrete specimens, the life data of different strength grades were collected, and the B-S distribution was used for modeling; the reliability trajectory of the concrete specimens under the action of various erosion factors was obtained. Combining with the degradation index’s deterioration characteristics, the erosion degradation law and durability of concrete in the Western saline soil environment were analyzed. The matching ratios used for forming three strength grades of concrete in the test are shown in , the cement used in this research was ordinary Portland cement produced by Qilianshan Cement Plant, and the fly ash was Grade II fly ash produced by Lanzhou Second Thermal Plant. The water-reducing agent was from Lanzhou Hualong Commercial Concrete Company, the coarse and fine aggregates with good gradation and relevant indicators such as mud content meet the specification requirements. The specimen size was a prism of 100 mm×100 mm×400 mm, cured in a standard curing room after molding.
Table 1. Mix proportion of formed concrete (kg/m3).
The saline soil area in western China has a harsh environment with a complex and changeable climate, especially the solar radiation is much stronger than the eastern coastal area, whereby the temperature difference between day and night is significant, and there are many corrosive ions. The concrete structure’s service life in this area is deteriorated by the combination of seasonal alternation and corrosion salt, and the deterioration rate is higher. The research group has set exposure points in many western regions. This paper uses the Xining area with typical saline soil characteristics and semi-arid climate in the northwest inland continental plateau as a reference for designing accelerated indoor experiments. Through tracking and analyzing the temperature, precipitation, and soil quality in the area, the indoor accelerated test system was designed with special consideration of the abundant solar resources in the Xining area. The comprehensive effects of solar radiation, dry-wet, freeze-thaw, and composite salt erosion were introduced in the test, and the artificial climate environment was created indoors to simulate the corrosion and deterioration of concrete in the four seasons of the year. The specific test system is shown in . Simultaneously, to shorten the test period and based on the corrosion degradation mechanism of concrete, the accelerated stress level design was carried out according to the type of corrosion ion and content in the saline soil. The composite salt solution was configured with 5 times the corrosion ion’s content in the saline soil; the soil quality report and compound salt solution concentration are shown in .
Figure 1. Indoor accelerated test system of concrete in the saline soil area.
Table 2. Saline soil quality report and compound salt solution concentration.
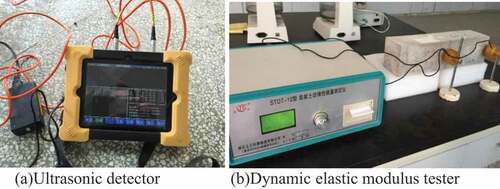
According to the test system shown in , the accelerated concrete test that simulates the climate environment was carried out; the ultrasonic sound velocity and dynamic elastic modulus of the concrete prism specimens were tested every 7 days until the end of each environment. The ultrasonic wave velocity measuring instrument and dynamic elastic modulus measuring instrument used in this research are shown in . In order to facilitate the collection of failure data, judge whether the specimen is damaged or not, and to avoid the influence of instrument and other reasons on the test results in each measurement, the relevant provisions in the code for concrete durability structure were combined. Through the normalized dynamic elastic modulus evaluation parameter ξa and damage evaluation parameter ξb, the concrete durability performance was tracked and evaluated. Two types of evaluation parameters were used to collect the life of concrete specimens under the action of comprehensive factors. The dynamic elastic modulus evaluation parameter ξa and the damage evaluation parameter ξb are shown in EquationEquations 1(1)
(1) –Equation2
(2)
(2) (Hongxia et al. Citation2016; Qiong et al. Citation2018):
In the formula, Vt and Et respectively refer to the ultrasonic sound velocity and dynamic elastic modulus value of the concrete after a certain damage period, V0 and E0 respectively refer to the ultrasonic sound velocity and dynamic elastic modulus value of the concrete before the acceleration test starts. When ξ is between 0 and 1, it is considered that the specimen has deteriorated. When ξa is less than 0 or ξb is greater than 1, the concrete specimen is deemed a failure.
Following the indoor accelerated test, which was conducted in accordance with the aforementioned durability test plan, the durability evaluation parameters of formula 1 and formula 2 were used to collect the lifetime of the three types of concrete under the action of multiple damage factors, and the B-S model was used based on the life data. Through the reliability curve, density curve, and failure rate curve, the durability life of concrete under the action of multiple damage factors was evaluated.
Figure 2. Non-destructive testing equipment used in the test.
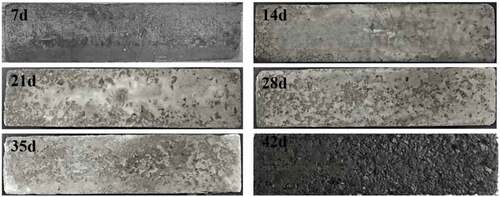
At the same time, focusing intently on the change of the specimen surface morphology under different cycle periods, the surface morphology of C30 concrete with the most serious damage is shown in . It can be seen that as the cycle time increases, the surface of the specimen has gradually changed from the initial level and smoothness to rough and pitted. The cement paste gradually falls off from the surface of the test specimen, and the exposed area of the aggregate increases with the increase of erosion time. By 42 days, the surface of the entire specimen had become uneven, and the surface slurry had fallen off.
Figure 3. C30 concrete surface morphology changes under different cycle periods.
3. Analysis of accelerated test results
The value of ultrasonic sound velocity and dynamic elastic modulus value obtained from every 7 days test during the test process was introduced into EquationEquations 1(1)
(1) –Equation2
(2)
(2) , the dynamic elastic modulus evaluation parameter ξa and the damage evaluation parameter ξb of concrete under different deterioration periods are shown in . To better observe the changing trend of the durability index of different strength grades of concrete under the action of multiple damage factors, the dynamic elastic modulus evaluation parameters and the damage evaluation parameters are linearly fitted. It can be observed from that with the extension of the erosion cycle, the dynamic elastic modulus evaluation parameter ξa shows a fluctuating downward trend, which indicates that the performance of concrete gradually deteriorates. This results from the combined effects of chemical corrosion caused by chloride, sulfate, carbonate, and magnesium salts; physical crystal destruction caused by the dry-wet cycles; the combined effect of the temperature stress, and the expansion stress caused by the freezing-thawing. It was also observed that among the three types of specimens, the ξa value of C30 concrete and its fitting curve are always below the other two types of concrete, which indicates that the degradation rate of C30 concrete is faster than that of C40 and C50 concrete under the comprehensive action of four seasons’ damage factors.
Figure 4. Evaluation parameters of dynamic elastic modulus.
Figure 5. Evaluation parameters of damage degree.
According to the criterion of ξa value, it can be seen that the failure time of the concrete is around 35 days to 42 days, while the failure time of C40 and C50 concrete is 77 days to 84 days and 105 days, respectively. From the damage evaluation parameter ξb value, it can be seen that under the simulated four-season damage environment, the ξb value of each concrete shows a gradually increasing trend, and the ξb value of C30 concrete fluctuates the most, while the ξb value of C50 concrete fluctuates slightly and increases linearly, and C40 concrete is somewhere in between. It shows that the higher the strength level, the better the corrosion resistance of concrete under the coupling action of multiple damage factors, and the longer the damage failure time. According to the criterion of ξb value, the failure time of C30, C40, and C50 concrete is around 49 days, 63 days, and 105 days, respectively. Comparing the two types of evaluation indicators, the value of the damage evaluation parameter ξb of C40 and C50 concrete is more stable and basically increases linearly, while the values of C30 concrete ξa and ξb have large fluctuations, and at some time of damage, the value of evaluation parameters will rebound significantly.
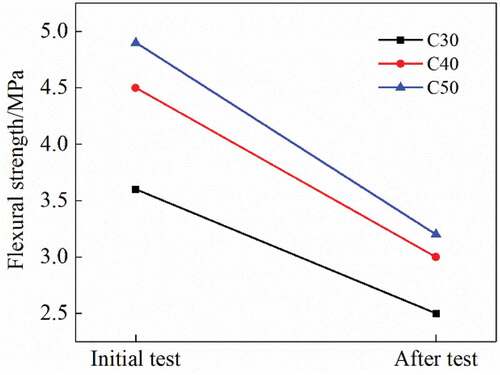
After the non-destructive durability test, the concrete’s flexural strength was tested and the flexural strength values of different strength grades were obtained compared with the initial values, as shown in . It can be seen from the figure that the mechanical properties of concrete have undergone significant changes after a large cycle of simulating four-season damage. Compared with the initial flexural strength of concrete, C30, C40, and C50 concrete’s flexural strength decreased by 30.6%, 33.3%, and 32.6%, respectively. At the end of the test, the concrete durability specification has reached the failure destruction standard.
Figure 6. Flexural strength of concrete before and after the accelerated test.
To better explore the damage of concrete materials caused by various damage factors, after the mechanical test of the concrete, the JSM-5600LV low-vacuum scanning electron microscope produced by Japan Electron Optics Corporation was used to microscopically inspect the most severely damaged C30 concrete. The SEM image is shown in . Also, a D8ADVANCE X-ray diffractometer was used to analyze the phase of the C30 concrete sample, and the XRD phase results are shown in . It is observed from the SEM image that the interior of the concrete is no longer dense, and there are many holes and cracks, and a large number of needle-like, rod-like, and fries-like corrosion products are generated at the defect, which produces extremely strong expansion stress on the concrete hole wall. From the SEM diagram, it can be seen that these corrosion products include swelling products such as gypsum, ettringite, Friedel’s salt, calcium carbonate, and non-gelling substances such as magnesium hydroxide and moissanite. These corrosion products together cause great damage to the gel material inside the concrete.
Figure 7. C30 concrete SEM.
Figure 8. XRD results of C30 concrete.
From both the macroscopic and microscopic test results, it can be seen that in the indoor large-cycle test, that simulates the environment of the saline soil area and the seasonal climate change, the concrete is subjected to the combined effects of various damage factors, and its macroscopic mechanics, durability, and microstructure have undergone great changes. The main reason is that the concrete is not a completely dense whole but a three-phase metastable system formed by the hydration of cementitious materials, aggregates, and cement. After hardening, many capillary pores and micro-cracks are inevitably formed inside the concrete, which provides penetration and diffusion channels for the invasion of corrosive ions. At the same time, the cement stone formed by the hydration of the cementitious material contains a large amount of hydrated calcium silicate, calcium aluminate hydrate, calcium hydroxide, and other easily corrosive products, which will interact with corrosive ions in the environment and change the chemical composition of the components inside the concrete. Therefore, after the accelerated test starts, the Cl−, SO42-, CO32-, HCO3- and Mg2+ in the corrosive solution first enter the concrete through the capillary pores of the concrete and then undergo a complex chemical reaction with the cement hydration products to form ettringite, gypsum, corrosion and expansion products such as calcium carbonate and Freidel’s salt produce large expansion stress on the surrounding concrete pore walls. At the same time, it will also consume the alkaline Ca(OH)2 in the concrete and promote the continuous decomposition of the hydrated calcium silicate gel, and the internal pH value of the concrete will continue to decrease. In addition, at low temperatures, when carbonate and sulfate exist simultaneously, more destructive carbonthiocarbonite will be generated in concrete, which not only consumes the gel material but also generates non-cohesive corrosion products, then greatly damages the bonding performance of the gel material inside concrete (Daosheng et al. Citation2018; Wang, Niu, and Song Citation2019).
Secondly, during the dry-wet cycle, the water in the concrete pores evaporates continuously. When the corrosion salt concentration is greater than the solubility, crystals will precipitate out, which will cause greater crystallization pressure on the concrete pore walls. For calcium sulfate and sodium sulfate, up to 10 water molecules can be combined to produce stronger crystallization pressure, causing cracks to appear on the surface of the test specimen. The longer the erosion time, the greater the number of wet and dry cycles, hence, the greater the number of cracks. At the same time, ultraviolet radiation accelerates the rate of water evaporation, making the salt in the surface pores easier to crystallize and solidify. Moreover, the dry-wet cycle provides a stronger power for corrosive ions to enter the deep inside of the concrete, and more corrosive ions are transported to the inside of the concrete, resulting in greater physical crystallization stress damage and more gel consumption. When entering the freeze-thaw cycle stage, the water entering the concrete pores constantly changes between liquid and solid. The frost heaving force and osmotic pressure produced by periodic freezing and thawing continuously accumulate damage to the concrete pore wall, which makes the deterioration of concrete increasingly aggravated. During the test, the combined effects of various damage factors make the compactness of the concrete material continue to decrease, the dynamic elastic modulus decreases, the degradation rate greatly increases, and the failure rate is faster.
4. B-S reliability model theory
Assume that the life t of concrete in the accelerated life test of saline soil obeys the B-S distribution; α, β and θ are the shape parameter, scale parameter, and position parameter B-S distribution, respectively. The density function f(t), reliability function R(t), and failure rate function h(t) of the three-parameter B-S distribution can be expressed as (Balakrishnan and Kundu Citation2019):
Where Ф(·) denotes the standard normal distribution function.
In particular, when the position parameter θ is zero, the above-mentioned three-parameter B-S distribution model becomes a two-parameter B-S distribution model. To fully compare the influence of the B-S model and each parameter estimation method on the life analysis results, and find a simple, efficient and applicable parameter estimation method, the moment estimation method, inverse estimation method, quantile estimation Method, regression estimation method and maximum likelihood method were used to estimate the parameters of the two-parameter B-S distribution model. The moment estimation method and the quantile method were used to estimate the parameters of the three-parameter B-S distribution model (Jantakoon and Volodin Citation2019; Balakrishnan and Alam Citation2019; D’Anna etal. Citation2016; Ho Citation2012). Due to the article’s length, part of the derivation process was omitted, and the final calculation equations were mainly presented. It is assumed that Ti is the life obtained in the accelerated test of concrete, where i = 1,2,3 … … n, the life samples of different strength grades collected through the durability evaluation index are shown in .
Figure 9. Sample of concrete accelerated life data.
The population mean E(T) was estimated by the sample mean value, and the population variance Var(T) was estimated by the sample variance S2. According to the moment estimation idea, two sets of moment estimation equations are obtained, as shown in Equationequations 6(6)
(6) –Equation7
(7)
(7) , where 6 is recorded as Moment estimation method 1 and formula 7 is recorded as moment estimation method 2.
According to the idea of inverse estimation, the inverse estimation equation of B-S distribution is obtained as shown in EquationEquation 8(8)
(8) :
The quantile estimation method mainly uses the median for parameter estimation, and the sample size is slightly different for odd and even numbers, as shown in EquationEquation 9(9)
(9)
The regression analysis method mainly uses least squares for parameter estimation, and the analytical expression is shown in time 10:
The maximum likelihood estimation method is the most classic parameter estimation method in statistics. Based on the maximum likelihood principle, this method uses the density function of the distribution function and the sample’s information to maximize the probability of the sample appearing in the field of observations. In recent years, based on computer science, it has been developed into a helpful parameter estimation method. In this paper, through partial derivation and simplification of the likelihood function, the maximum likelihood parameter estimation equations are obtained as shown in Equationequation 11(11)
(11) :
The estimated parameters of the two-parameter B-S distribution model obtained by the above six methods are shown in . It can be observed from the table that the estimation values of shape parameters obtained by the quantile method are significantly larger than those obtained by the other five types of methods. In order hand, the estimation values of scale parameters are smaller than those obtained by the other five types of methods, which may be related to the small number of samples for parameter estimation.
Table 3. Estimated values of two-parameter B-S model parameters.
Apart from the two-parameter B-S distribution model, the three-parameter B-S distribution model is more challenging to solve the likelihood equations due to the addition of location position parameters, which significantly increases parameter estimation difficulty, so the moment estimation method and the quantile method were selected for parameter estimation. The calculation formulas are shown respectively in EquationEquations 12(12)
(12) –Equation13
(13)
(13) . At the same time, compared with the moment estimation method and quantile estimation method of the two-parameter model, the parameter calculation formulas 6–7 and formula 9 found that the parameter estimation formula of the three-parameter model is complex, and the difficulty of parameter estimation is greatly increased. However, it also can be seen that the key to parameter estimation is the position parameter. All parameters can be obtained by solving the transcendental equation of position parameters, substituting shape parameters and scale parameters respectively, the results are shown in .
Table 4. Estimated values of three-parameter B-S model parameters.
5. Reliability evaluation and life prediction
5.1. Analysis of reliability results of two-parameter B-S model
The estimated values of the parameters obtained in were introduced into EquationEquations 3(3)
(3) –Equation5
(5)
(5) , and the concrete reliability life curve, density curve, and failure rate curve under different parameter estimation methods are shown in . It can be observed from the figure that the reliability life curve presents an obvious three-stage change feature; that is, the reliability of the first stage is maintained at 1.0. At this stage, the various damage factors have a combined effect, and the amount of concrete deterioration will accumulate. At this time, the concrete has good corrosion resistance, and the damage caused by the accumulation of quantitative changes did not cause significant damage to the durability of concrete. In the second stage, the reliability decreases rapidly. In this stage, the accumulation of quantitative change has caused a qualitative change, and the concrete performance is damaged dramatically. The corrosion resistance of concrete itself is insufficient to resist external damage; the reliability decreases with the increase of time in the comprehensive effect of various damage factors. In the third stage, the concrete’s reliability is completely reduced to zero, which indicates that the concrete performance degrades seriously and fails. At the same time, it is observed that the higher the concrete strength level, the longer the first stage duration is, and the longer its reliability life. This is mainly because the higher the concrete strength level, the better the cementation performance between aggregates and the internal pores, the less the internal pores are, the higher the compactness is, and the stronger the anti-corrosion ability is. The degraded damage produced by each damage factor requires a more extended period of quantitative change to accumulate before a qualitative change occurs. It can be seen from the figure that the duration of the first stage of C30, C40, and C50 concrete is about 880 hours, 1840 hours, and 2360 hours respectively, and the reliability life is 1240 hours, 2240 hours, and 2870 hours respectively.
The reliability curve of the quantile parameter estimation method is quite different from the reliability curves of the other five types of estimation methods, and the reliability curve is relatively lagging. Under the same reliability level, its reliability life is shorter than that obtained by the other five types of estimation methods, and the difference in the reliability curves of the other five types of parameter estimation methods is smaller. It is observed from the partially enlarged reliability curve that among the five relatively similar parameter estimation methods, the difference between the regression estimation method and the two types of moment estimation methods is the smallest, and the reliability curves basically coincide completely. The difference between the inverse Gaussian estimation method and the moment estimation method is the biggest, and its reliability curve is always on top of the remaining 4 types of reliability curves. In addition, the difference between the maximum likelihood method and the moment estimation method is relatively small, and the reliability curve is between the moment estimation method and the inverse Gaussian estimation method. On the whole, except for the quantile estimation method, the other methods can better realize the parameter estimation of a small sample of the concrete accelerated test. At the same time, considering the difficulty and convenience of parameter estimation of each method, it is suggested that the moment estimation method can be directly used in the project to realize the rapid estimation of the parameters of the B-S reliability evaluation model.
The density curve shows that the B-S reliability model is different from the single-peak symmetry of the standard Weibull distribution density curve. The density curve is asymmetric, reaching its peak during the accelerating decline of reliability, and the longer the peak time, the higher the concrete strength grade. Peak times for the three types of specimens are 1207 hours, 2229 hours, and 2848 hours. At the same time, it is observed from the enlarged graph of the peak density curve that the density curve of the quantile estimation method is the most different from the density curve of the other five parameter estimation methods, and the density peak value and curve span are the smallest among the six parameter estimation methods. The density curve difference between the maximum likelihood method and the moment estimation method is the smallest, and the peak and span of the density curve are basically the same. The density curve near the peak of the regression estimation method is between the quantile method and the moment estimation method, and its density curves are quite different from the density curves of the five types of parameter estimation methods.
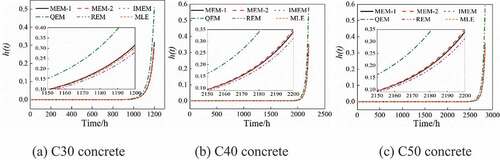
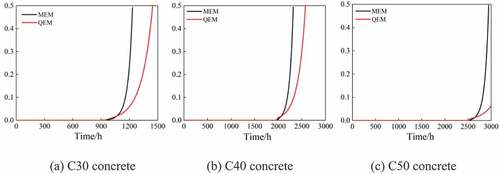
The failure rate is an intuitive reflection of concrete’s failure rate under the combined effects of various damage factors. The failure rate curve can be observed that the failure rate curve changes in two stages; that is, as the damage period increases, the initial failure rate remains zero, indicating that the concrete’s performance is good. The accumulation of damage quantity has not caused the qualitative change, and it increases in a power-type acceleration at the later stage, indicating that the performance of concrete is degraded under the action of multiple damage factors, and its anti-erosion ability is insufficient. The longer the erosion time is, the faster the damage degradation rate will be until failure. Simultaneously, according to the change form of the failure rate curve, the degradation of concrete under the comprehensive action of multiple damage factors belongs to consumption type failure (Xie et al. Citation2012). The higher the concrete strength grade is, the stronger the anti-corrosion ability is, and then later, the second stage appears. Moreover, among the six types of parameter estimation methods, the failure rate curves of the quantile estimation method and the regression estimation method in the second stage are quite different from the failure rate curves of the other 4 types of estimation methods. Among them, the quantile method has the largest difference and the largest failure rate at the same time, while the moment estimation method and the maximum likelihood method have the smallest difference, and the failure rate curve in the second stage is basically the same.
Figure 10. Concrete reliability curves under different parameter estimation methods.
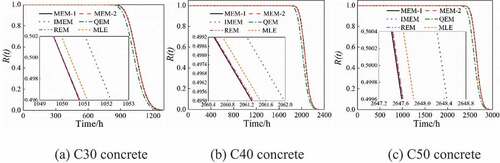
Figure 11. Concrete density curves under different parameter estimation methods.
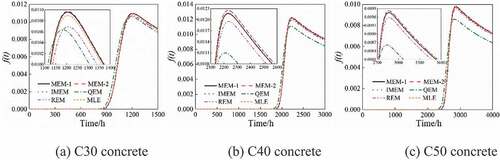
Figure 12. Failure rate curve of concrete under different parameter estimation methods.
5.2. Analysis of reliability results of the three-parameter B-S model
The estimated values of the parameters in are brought into EquationEquations 3(3)
(3) ~ Equation5
(5)
(5) , and the reliability life curve, density curve, and failure rate curve of concrete under the three-parameter B-S model are obtained as shown in . It can be observed from that the reliability life curve of the three-parameter B-S model also changes in three stages. The transition from the first stage to the second stage is significantly different from the two-parameter B-S model; that is, the transition of the two-parameter model is smoother, while the transition of the three-parameter model has obvious time nodes, so the transition is faster. Comparing the two three-parameter models’ parameter estimation methods, it can be observed that the reliability curve obtained by the MEM method has a shorter duration in the first stage than the reliability curve obtained by the QEM method. The MEM method’s life curve enters the third stage earlier than the QEM method, so its reliability reduction rate in the second stage is greater. It is observed from the density curve that the density curve of the three-parameter model also presents a single-peak asymmetric shape. The higher the concrete strength grade is, the later the peak appears, and the peak point time and peak extreme value of the MEM method are more significant than those of the QEM method. It is observed from the failure rate curve that, similar to the two-parameter model, the failure rate curve of the three-parameter model for each strength grade of concrete under the combined action of multiple damage factors also shows a two-stage change. However, under the same damage period, the failure rate obtained by the MEM method is higher than that by the QEM method, which indicates that the later reliability decrease rate is more remarkable, which is consistent with the conclusion obtained through the reliability curve and the density curve.
Figure 13. Concrete reliability curves under different parameter estimation methods.
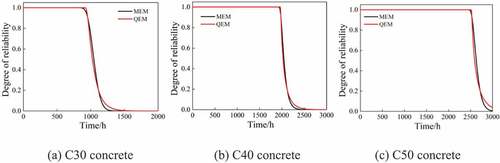
Figure 14. Concrete density curve under different parameter estimation methods.
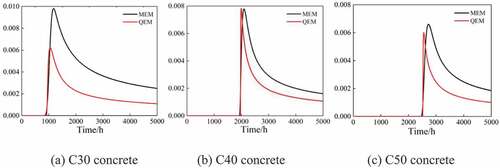
Figure 15. Concrete failure rate curve under different parameter estimation methods.
5.3. Comparative analysis of two-parameter and three-parameter B-S model
In order to compare the difference between the two-parameter B-S model and the three-parameter B-S model, analyze the relationship between the reliability level and time, and find the best model and parameter estimation method, the reliability life of concrete under different reliability levels has been sorted as shown in . Considering the influence of parameter estimation methods on the results, the moment estimation method and quantile estimation method used in both types of models are taken as examples. From the perspective of the reliability life of different reliability levels under the MEM parameter estimation method, when the reliability level is greater than 0.9 or less than 0.1, the three-parameter model’s reliability life is slightly longer. When the low-reliability level is in the range of 0.9 to 0.1, the reliability life of the two-parameter model is slightly longer. The difference in the reliability life of the two types of models under the same reliability level is small and only changes between 2 hours to 16 hours, which shows that the two models can well reflect the reliability changes of concrete in the multi-damage factor accelerated life test.
Table 5. Reliability life of two types of B-S models under different reliability levels.
It can be seen from the QEM parameter estimation method that when the reliability level is 0.5, the reliability life value of the two-parameter model is the same as that of the three-parameter model. When the reliability level is lower than or greater than 0.5, the three-parameter model has a longer reliability life, and the further away from the 0.5 reliability level, the greater the difference in the reliability life of the two models. When the reliability level is 0.1, the difference value reaches the maximum, and the reliability life difference values of C30, C40, and C50 concrete obtained by the two models are 51 hours, 63 hours, and 100 hours respectively. Comparing the reliability life values of different reliability levels under the two types of methods, it can be found that the reliability life results obtained by the MEM method in the two types of models are less discrete than the results obtained by the QEM method. Therefore, to make the results of concrete reliability evaluation in accelerated life tests more accurate, it is not recommended to use the quantile estimation method for parameter estimation, regardless of the two-parameter or three-parameter models. Simultaneously, the difference of reliability life value between the two-parameter model and the three-parameter model under different reliability levels is small when the moment estimation method is used. Therefore, considering the engineering applicability and the difficulty of parameter estimation, the two-parameter model can be directly used to evaluate concrete reliability under the comprehensive action of multiple damage factors.
6. Conclusion
Through the above research and analysis, the following conclusions can be drawn:
Under the action of multiple damage factors in the simulated saline soil area, the compound salt entering into the concrete and hydration products produce expansive crystals such as ettringite, gypsum, and corrosion products such as non-cementitious brucite, Breeze and ultraviolet radiation promote the evaporation of surface water, dry-wet cycles aggravate physical crystal destruction, freeze-thaw cycles produce expansion-contraction stress and osmotic pressure to form negative pressure in the internal pores of the concrete, as the number of cycles increases, the dynamic elastic modulus evaluation parameter fluctuates down, the damage evaluation parameter fluctuates, and the concrete gradually fails.
Birnbaum Saunders’s distribution model can well describe the reliability of concrete under the combined action of multiple damage factors, the reliability curves of the two-parameter model, and the three-parameter model change in three stages. The first stage is the process of damage quantity change accumulation. The second stage is the accelerated deterioration of concrete durability caused by damage quantity change accumulation. The third stage is a concrete failure.
In the accelerated life test of concrete, the Birnbaum Saunders distribution model’s density curve shows a single peak asymmetry, and the failure rate curve changes in two stages; the failure rate increases in a power type at the later stage of damage deterioration. According to the failure rate curve, the damage type of concrete in the simulated saline soil environment in four seasons belongs to the depletion type.
Compared with the two-parameter model, the three-parameter B-S model’s reliability curve transits more quickly from the first stage to the second stage; it is recommended to use the MEM method to estimate the parameters of the three parameters B-S model.
In the two-parameter B-S model, the reliability curves obtained by the MEM, IMEM, REM, and MLE are very close and coincide. However, the reliability curve obtained by the QEM is slightly different from the reliability curve obtained by the above method; it is recommended to use the QEM to estimate the parameters of life data samples in the accelerated concrete tests.
Under the MEM, the reliability lifetime difference between the two-parameter model and the three-parameter model at the same reliability level is small. Considering the engineering applicability and the difficulty of parameter estimation, the two-parameter model can be directly used to evaluate concrete reliability under the comprehensive action of multiple damage factors.
Disclosure statement
No potential conflict of interest was reported by the author(s).
Additional information
Funding
Notes on contributors
Chenggong Lu
Chenggong Lu, Ph.D. Candidate, School of Civil Engineering, Lanzhou University of Technology., Lanzhou 730050, China. Research interests include durability of concrete structures in harsh environment.
Zhiqiang Wei
Zhiqiang Wei, Professor, Master's and Doctoral supervisor of School of Science, Lanzhou University of Technology, Lanzhou 730050, China. Research interests include building functional materials.
Hongxia Qiao
Hongxia Qiao, Professor, Master's and Doctoral supervisor of School of Civil Engineering, Lanzhou University of Technology., Lanzhou 730050, China; Western Center of Disaster Mitigation in Civil Engineering of Ministry of Education, Lanzhou University of Technology., Lanzhou 730050, China. Research interests include Durability of Concrete, Magnesium Cement Reinforced Concrete, Recycled Aggregate Concrete and Fiber, and Nano-concrete research. ORCID: https://orcid.org/0000-0002-0289-1949. Corresponding Author, E-mail Address: [email protected]
Theogene Hakuzweyezu
Theogene Hakuzweyezu, Postgraduate student, School of Civil Engineering, Lanzhou University of Technology., Lanzhou 730050, China. Research interests include the durability of concrete structures and Nano-Modified concrete Research. ORCID: https://orcid.org/0000-0002-4297-1273
Guobin Qiao
Guobin Qiao, Postgraduates, School of Civil Engineering, Lanzhou University of Technology., Lanzhou 730050, China. Research interests include numerical simulation of ion transport in concrete.
Kan Li
Kan Li, Ph.D. Candidate, School of Civil Engineering, Lanzhou University of Technology., Lanzhou 730050, China. Research interests include cement-based repair materials.
References
- Balakrishnan, N., and D. Kundu. 2019. “Birnbaum-saunders Distribution: A Review of Models, Analysis and Applications.” Applied Stochastic Models in Business and Industry 35 (1) 4–49 .
- Balakrishnan, N., and F. M. A. Alam. 2019. “Maximum Likelihood Estimation of the Parameters of A Multiple Step-stress Model from the Birnbaum-Saunders Distribution under Time-constraint: A Comparative Study.” Communications in Statistics - Simulation and Computation 48 (5): 1535–1559. doi:10.1080/03610918.2017.1414252.
- Barriga, G. D. C., D. K. Dey, V. G. Cancho, and A. K. Suzuki. 2020. “Bayesian Analysis of Birnbaum-Saunders Survival Model with Cure Fraction under a Variety of Activation Mechanism.” Model Assist Stat Appl 15 (1): 35–51. doi:10.3233/MAS-190477.
- D’Anna, G., M. Giorgio, and A. Riccio. 2016. “Estimating Fatigue Life of Structural Components from Accelerated Data via a Birnbaum-saunders Model with Shape and Scale Stress Dependent Parameters.” Procedia Engineering 167: 10–17. doi:10.1016/j.proeng.2016.11.663.
- Daosheng, S., C. Xingxing, L. Kaiwei, W. Aiguo, and Z. Gaozhan. 2018. “Current Knowledge of Deterioration Mechanism of Gypsum Formation during Sulfate Attack.” Mater Rev 31 (23): 4135–4141. https://pdfs.semanticscholar.org/a0be/b57b920be514bae975ac2d5f85c8fbfa3406.pdf
- Ho, J. W. 2012. “Parameter Estimation for the Birnbaum-Saunders Distribution under an Accelerated Degradation Test.” European J. Of Industrial Engineering 6 (5): 644–665. doi:10.1504/EJIE.2012.048856.
- Hongliang, Z., Z. Yuefeng, and H. A. N. Jincao. 2015. “Study of the Durability of Partially-exposed Concrete in Chloride Saline Soil Areas of Qinghai Province.” J Hefei Univ Technol Nat Sci 38 (6): 804–809.
- Hongxia, Q., G. Wei, C. Qian-yuan, D. Jin-mei, C. Guang-feng, and H. Long. 2015. “Durability of Magnesium Cement Reinforced Concrete in Saline Soil Area.” J China Coal Soc 40 (S2): 346–352.
- Hongxia, Q., L. Chenggong, L. Yu, and G. Lijuan. 2016. “Experiment on Durability Damage Assessment of Concrete Field Exposed in Saline Soil Area of Ningxia.” Journal of Architecture and Civil Engineering 33 (6): 44–52.
- Jantakoon, N., and A. Volodin. 2019. “Interval Estimation for the Shape and Scale Parameters of the Birnbaum—Saunders Distribution.” Lobachevskii Journal of Mathematics 40 (8): 1164–1177. doi:10.1134/S1995080219080110.
- Jianyin, Z., S. Quan, P. Baohua, and Z. Jinglun. 2006. “Inferences for the BS Life Model from Accelerated Degradation Tests.” Electronic Product Reliability and Environmental Testing 24 , no. 1: 11–14.
- Kwon, K.-J., H. Jung, and J.-W. Park. 2016. “Service-life Prediction of Reinforced Concrete Structures in Subsurface Environment.” Journal of Nuclear Fuel Cycle and Waste Technology 14 (1): 11–19. doi:10.7733/jnfcwt.2016.14.1.11.
- Li, C., and X. Gu. 2010. “FEM Analysis of the Concrete Structure Life under the Freezing and Thawing Cycles Conditions.” ICIC 2010 - 3rd Int Conf Inf Comput 2: 54–57. doi:10.1109/ICIC.2010.107.
- Li, K., P. Wang, Q. Li, and Z. Fan. 2016. “Durability Assessment of Concrete Structures in HZM Sea Link Project for Service Life of 120 Years.” Materials and Structures 49 (9): 3785–3800. doi:10.1617/s11527-015-0754-8.
- Lin, X. 2014. “Durability Design of Concrete Structures in Severe Environments.” Key Engineering Materials 629–630 , no. : 218–222.
- Pang, L., Z. Ying, Z. Fan, T. Jun-feng, and L. Quan-wang. 2016. “Environmental Load Model and Durability Analysis of Marine Concrete Structures of Based on In-Situ Test Date in South China.” Eng Mech 33 (S1): 168–172.
- Parichatprecha, R., and P. Nimityongskul. 2009. “Analysis of Durability of High Performance Concrete Using Artificial Neural Networks.” Construction and Building Materials 23 (2): 910–917. doi:10.1016/j.conbuildmat.2008.04.015.
- Qiong, F., Q. Hongxia, Z. Bingrong, W. Penghui, and W. Shaoyong. 2018. “Experimental Study of Competing Failure of Reinforced Concrete Based on the Weibull Distribution.” Advances in Civil Engineering Materials 7 (1): 520–537.
- Van Belleghem, B., P. Van den Heede, K. Van Tittelboom, and N. D. De Belie. 2017. “Quantification of the Service Life Extension and Environmental Benefit of Chloride Exposed Self-Healing Concrete.” Materials (Basel) 10 (1). doi:10.3390/ma10010005.
- Wang, J. B., H. H. D. T. Niu, and Z. P. Song. 2019. “Durability Deterioration and Corrosion Mechanism of Shotcrete in SaltLake Environment.” J Civ Eng 52 (6): 67–80.
- Wei, G., Q. Hongxia, Y. Hongfa, M. Haiyan, and C. Guangfeng. 2018. “Initial Cracking Time of Magnesium Oxychloride Cement Reinforced Concrete Based on Time-varying Model of Reinforcement Corrosion.” J Southeast Univ (Natural Sci Ed 48 (3): 519–527. doi:10.3969/j.1001-0505.2018.03.021.
- Xiaobao, Y., Z. Tang, and Y. Guangji. 2015. “Gas Diffusion Model in Concrete Based on Pore Structural Parameters.” J Build Mater 18 (6): 976–981.
- Xiaoling, X., W. Ronghua, and B. Gu. 2020. “Statistical Analysis of Three-parameter Birnbaum-Saunders Fatigue Life Distribution.” Electron Prod Reliab Environ Test 38 (1): 35–39.
- Xiaoping, S., W. Qing, W. Wenhua, and S. Haoyue. 2014. “Frost Resistance and Durability Mechanism of Concrete under Saline-Alkali Condition in Seasonal Frozen Soil Area.” J Jilin Univ (Earth Sci Ed 44 (4): 1244–1253.
- Xie, L., W. Lin, M. Zhang, and S. Yan. 2012. “Series System Failure Rate Modeling and the Mechanism to Yield Bathtub Curve.” Appl Mech Mater 121–126: 4858–4862. doi:10.4028/scientific.net/AMM.121-126.4858.
- Yafei, M., G. Zhongzhao, W. Lei, and J. Zhang. 2020. “Probabilistic Life Prediction for Reinforced Concrete Structures Subjected to Seasonal Corrosion-Fatigue Damage[J].” Journal of Structural Engineering 146 (7): 04020117. doi:10.1061/(ASCE)ST.1943-541X.0002666.
- Yafei, M., P. Anyin, S. Xiaochao, W. Lei, and J. Zhang. 2021. “Modeling Constitutive Relationship of Steel Bar Removed from Corroded PC Beams after Fatigue considering Spatial Location Effect[J].” Journal of Materials in Civil Engineering 33 (4): 04021019. doi:10.1061/(ASCE)MT.1943-5533.0003644.
- Yang, H., H. He, and W. Yan. 2019. “Time-dependent Reliability Analysis on Reinforced Concrete Beam Bridge considering Carbonization and Chloride Accumulation Effect.” J Harbin Inst Technol 51 (6): 71–78. doi:10.11918/j.0367-6234.201805012.
- Yu, B., C. Lie Ning, and B. Li. 2017. “Probabilistic Durability Assessment of Concrete Structures in Marine Environments: Reliability and Sensitivity Analysis.” China Ocean Engineering 31 (1): 63–73. doi:10.1007/s13344-017-0008-3.
- Yunzhe, X., Z. Kaifeng, and W. Bin. 2020. “Neutralization Performance and Prediction Model of Lining SShotcrete on Alternation Effects of Nitric Acid and Carbonation.” Mater Rev 08 (34): 8058–8063. doi:10.16552/j.cnki.1001-1625.2016.11.013.
- Zirui, G., X. Yongfu, L. Shue, and C. Zhiming. 2016. “Odified Migration Model for Chloride Ions in Concrete and Durability Analysis of Concrete.” J Hohai Univ (Natural Sci 44 (6): 432–437. doi:10.3876/j.1000-1980.2016.05.009.