
ABSTRACT
The collapse modes of reinforced concrete (RC) wallboards directly affect the living space and the escape time for people during the damage of an RC shear wall structure under the impact of a strong earthquake. To summarize all the possible collapse modes of RC wallboards based on the existing theoretical studies related to the seismic collapse of RC wallboards, six corresponding indoor RC wallboard model structures were designed on a scale of 1:4. These structures were subject to a full-process low-cycle horizontal load test to emphasize the failure process and verify the theoretical collapse modes of each test model. The experimental results are consistent with the findings from relevant theoretical studies and also enrich the collapse mechanism of RC wallboards, thus providing a valuable reference for designs that can withstand seismic impacts.
Graphical Abstract
1. Introduction
Earthquake is the most severe external factor that could result in catastrophic structural damage or collapse. Excessive seismic demands could induce deterioration in the strength and stiffness of the structural components and lead to a partial or complete collapse of the building (Zareian and Krawinkler Citation2010). The key to the reduction of casualties during earthquakes is to prevent buildings from collapsing, and during the process of the damage, people should have access to the necessary space and time to escape (Liu Citation2007; Weng Citation2015).
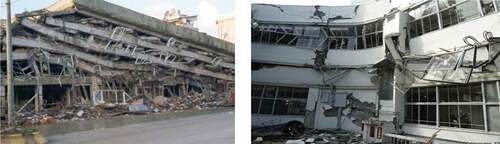
In earthquake engineering, collapse implies that the structural system is no longer capable of maintaining its gravitational load-carrying capacity due to the effects of seismic forces (Ibarra, Medina, and Krawinkler Citation2005), as shown in (Xie Citation2009; Toshimi, Yoshiaki, and Masaki Citation2011).
Figure 1. Buildings collapsed in Mexico earthquake (1985).
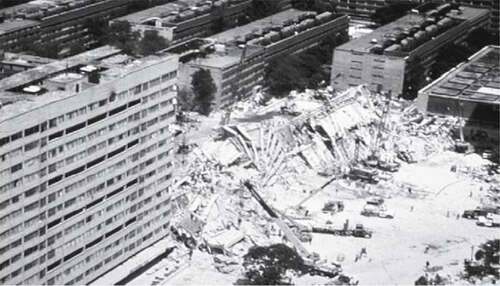
Figure 2. Buildings collapsed in Wenchuan earthquake (2008).
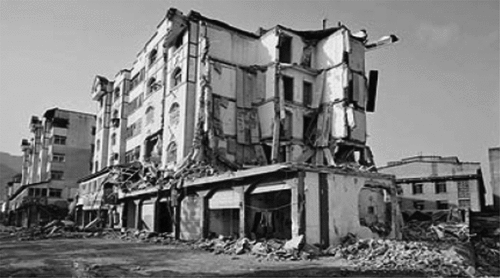
Figure 3. Buildings collapsed in Japan earthquake.
The effective reduction of casualties and collateral damage during an earthquake entails a comprehensive analysis of the dynamic response of the structures before the collapse and the exploration of the collapse mechanism of the structures composed of the main lateral resistance members.
Engineers and academicians have been seeking reasonable and effective seismic structural systems in an attempt to improve the anti-collapse ability of structures. The performance-based methodology has been widely adopted to evaluate the collapse probabilities and the design of seismic-proof structures. Goulet et al. (Citation2007) adopted a performance-based earthquake engineering methodology to predict the seismic performance and evaluate the collapse probabilities of a benchmark building. Bozorgnia and Bertero (Citation2003) developed optimized damage parameters to quantify the damage potential of recorded ground shaking to assess the performance-based seismic vulnerability of existing structures. However, there is no systematic study on the impacts of different failure modes of the main lateral members on the dspatial attributes of structures during the damage, due to the possibility that the failure modes of the wallboards cannot be predicted in advance.
In this study, large-scale indoor structure models were designed, and a quasi-static reciprocating loading test was conducted to obtain a comprehensive understanding of the collapse modes of vertical wallboards, their impacts on an integrated structure, and the survival space during the damage. Therefore, the findings from this study would be of significance in the exploration of collapse resistance of structures under the impact of earthquakes and thus reduce the occurrence of structural collapse.
2. Previous study
2.1. Failure modes of reinforced concrete wallboards
Researchers have established a relatively clear understanding of the failure modes of reinforced concrete (RC) wallboards under compressive-shear stress based on a long-term experimental study (Zhou, Sun, and Zhou Citation2010; Li, Pan, and Xiang Citation2015). Generally, the failure modes can be divided into three types: oblique compressive failure, shear-bending failure, and bending failure.
Based on the experimental findings on RC wallboards, the prominent factors affecting the failure modes of RC wallboards include the height–width ratio, the axial compression ratio, the concrete strength, reinforcements of the wallboards and the edge columns, and the sectional sizes of the edge columns. Some of those factors would be combined, such as the height–width ratio of the wallboard and the reinforcements in the wall web (Zareian et al. Citation2010).
2.2. Collapse modes of RC wallboards
Although there are abundant research data on the seismic performance of RC wallboards (Vulcano and Bertero Citation1987; Lopes Citation2001; Greifenhagen and Lestuzzi Citation2005; Hidalgo, Jordan, and Ledezma Citation2006; Zhang Citation2007; Wallace, Elwood, and Massone Citation2008; Dan, Fabian, and Stoian Citation2011; Miguel et al. Citation2013; Luna, Rivera, and Whittaker Citation2015; Zhang et al. Citation2018), most of those studies were focused on the ultimate strength and the deformation of RC wallboards under earthquake action and the assessment of the failure modes via experimental observations and qualitative judgments. To determine the collapse state, evaluation methods (Araki and Hjelmstad Citation2000; Zhou and Li Citation2017) have been proposed based on different approaches. The collapse-resistant capacity under different collapse criteria was compared in recent studies (Meigooni and Mollaioli Citation2021; Huang et al. Citation2021). The failure of the wallboard is deemed to have occurred if the load-bearing capacity decreases by 15% after the wallboard reaches its ultimate state (JGJ/T 101-Citation2015).
The failure mode may change continuously due to the gradual accumulation of damage during the loading process. Therefore, the initial failure often differs from the final failure in many cases. In this study, the collapse mode denotes the final failure mode during the moment of collapse. Due to the differences in design parameters such as size, reinforcements, concrete strength of the wallboards, and the vertical axial force on the wallboards, there are different “forks” in the process of wallboards from the initial intact state to the final collapsed state. Thus, it is pertinent to provide the corresponding failure criterion (or signage signs) of each so-called “fork”, in an attempt to accurately forecast the destruction trend of the wallboard. The above-mentioned failure criteria (namely road signs) consist of the criteria for the failure of the concrete elements and the judging criteria for the cracking and collapsing of the members of the RC wallboard.
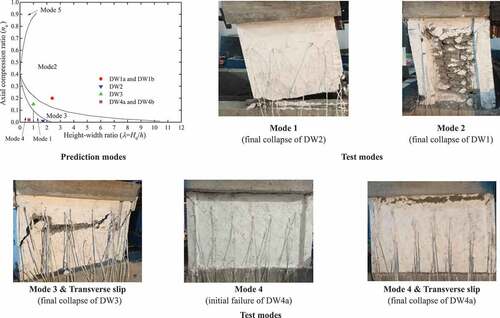
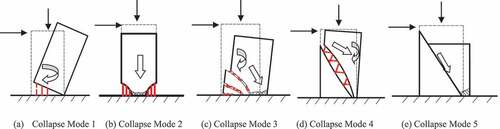
The collapse modes of the wallboards depend on the development of shear-tension cracks and shear-compression cracks in different areas of the wallboards under seismic loads. The collapse mechanism of wallboards under seismic loads is related to the spatial changes in the wallboards. The collapse occurs when the angular displacement or line displacement of the wallboard exceeds a certain threshold value. As shown in , Zha (Citation2017) obtained five collapse modes and the corresponding failure conditions based on different conFigureurations and stress states of reinforcements and concrete in the wallboard.
Figure 4. Prediction for typical collapse modes of RC shear walls.
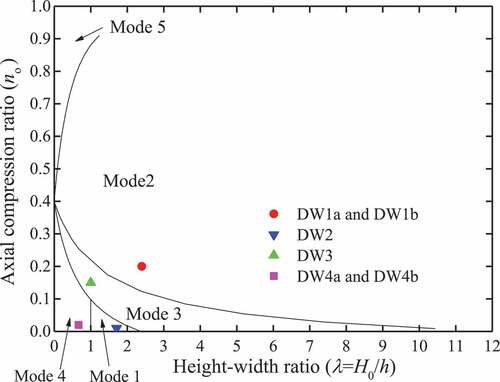
presents the schematic diagram of the above-mentioned five collapse modes of RC wallboards. The integral overturning mode 1 is caused by the slipping or the fracture of the tensile reinforcements, the vertical crushing mode 2 is caused by the weakened bottom section due to the shear-compression cracks, the shear mode 3 is caused by the transfixion of shear-tension cracks and shear-compression ones, collapse mode 4 is caused by integral shear-tension fracture, and collapse mode 5 is caused by the integral shear-compression fracture. The five collapse modes are utilized in the analysis of the failure and the collapse process of the RC shear wallboard under earthquake motion, which is aimed at revealing the production of the block decomposition in the wallboards during the failure and collapse process.
Figure 5. Collapse modes of RC shear walls. (a) Collapse mode 1, (b) collapse mode 2, (c) collapse mode 3, (d) collapse mode 4, and (e) collapse mode 5.
3. Experimental programme
The dynamic seismic action has a significant degree of randomness and complexity, which are practically irregular against time. Thus, the crack development process is affected by the irregular dynamic action to a certain degree. The irregularity may also have effects on the responses in particular when the structures enter a strong phase of nonlinearity. The theoretical method in was proposed to predict the collapse mode of the wallboard under static loading conditions, which may not correctly predict the collapse mode of the wallboard under the real dynamic seismic action. However, the primary study should focus on the quasi-static action. Based on the previous work, this research conducts quasi-static loading tests and focuses on elaborating on the failure process and verifying the theoretical collapse modes.
A whole process collapse test of a group of representative wallboard model structures under quasi-static action was carried out in Ningbo Key Laboratory of Engineering Structure, to study and verify the collapse process and the wallboard characteristics and explore their collapse mechanism.
Six scaled model structures were designed for the quasi-static reciprocating horizontal loading test based on some parameters that could affect the collapse modes of the RC wallboards, such as the height–width ratio (λ = H0/h), the axial compression ratio of wallboard (n0), the compression ratio of side column (c0), and the strength of the edge members.
3.1. The design and the construction of the test models
The theoretical prediction (Zha Citation2017) for the collapse mode of the wallboard is based on the assumption that the axial compression ratio of the wallboard and the column (n0 and c0) is equal or close to each other. Generally, the axial compression ratio of the column should be larger than or close to that of wallboard (c0 ≥ n0). In this study, six models with different height–width ratios λ, axial compression ratio of wallboard n0, and axial compression ratio of the side column c0 are designed on a scale of 1:4; the details of the specimens are presented in and . As shown in , and according to , the DW1a and DW1b models with λ = 2.4 and n0 = c0 = 0.2 are designed for the collapse mode 2, the DW2 model with λ = 1.71 and n0 = c0 = 0.01 is designed for collapse mode 1, the DW3 model with λ = 1.0, n0 = 0.15, and c0 = 0.25 is designed for the collapse mode 3, the DW4a and DW4b models with λ = 0.67, n0 = 0.02 and c0 = 0.25, 0.2 are designed for the collapse mode 4. For the general wallboard, the height–width ratio λ is larger than 0.5, and the axial compression ratio n0 is smaller than 0.7. shows that the wallboard with λ > 0.5 and n0 < 0.7 cannot collapse as mode 5. Therefore, the specimen for mode 5 is not considered in this study.
Table 1. The sectional size and the reinforcement of the beams and columns in the model structure.
Table 2. The reinforcement of the model structure.
Table 3. Model parameters and the prediction mode.
One of the purposes of this study is to validate the applicability of the theoretical prediction proposed in the previous work (Zha Citation2017) for the structure with c0 ≥ n0, which will guide the theory and improve the prediction method in the future. Among the six designed models, three of the models (DW3, DW4a, and DW4b) are designed for c0 > n0 as shown in .
Figure 6. The DW1a and DW1b model structures.
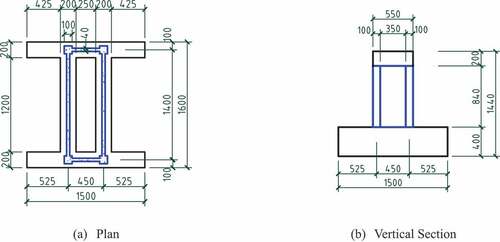
Figure 7. The W2 model structure.
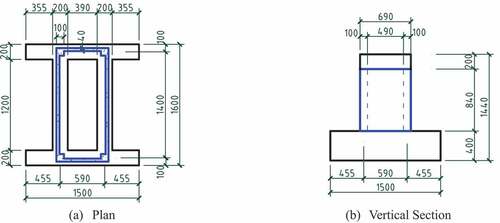
Figure 8. The DW3 model structure.
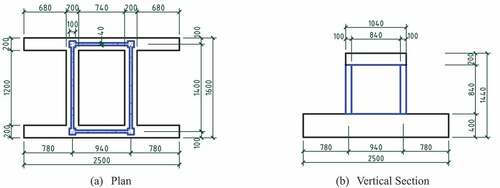
Figure 9. The DW4a and DW4b model structures.
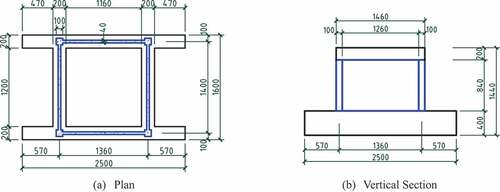
Figure 10. Assembling bar of beam and wall.
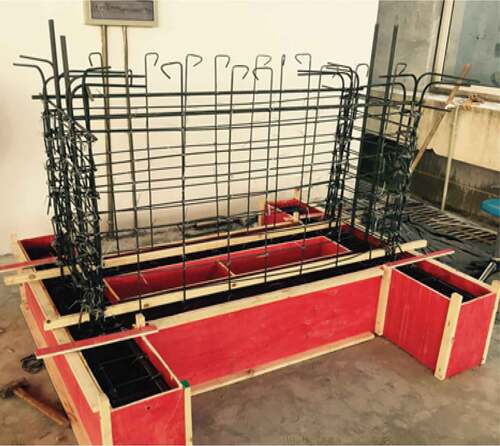
Figure 11. Pouring concrete of beam and wall.
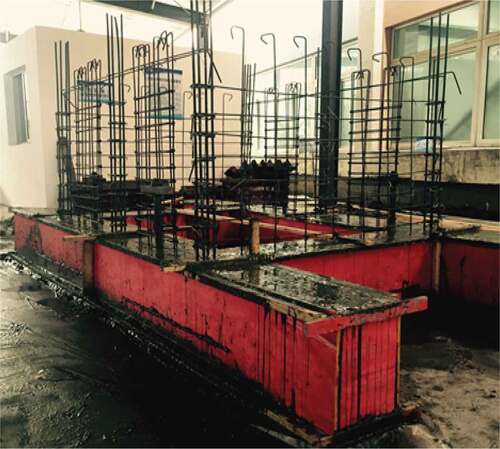
Figure 12. Installing wall model.
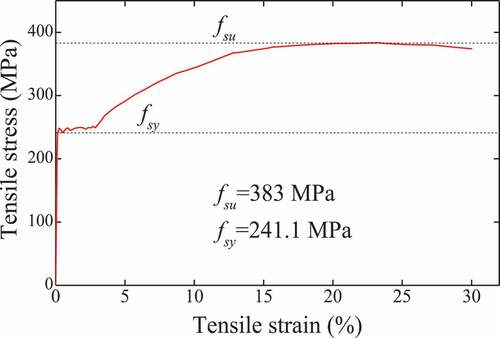
The stress–strain curve of C10 concrete is shown in . All the reinforced bars are plain steel bars of HPB235, the stress–strain curve of HPB235 steel is shown in .
Figure 13. Stress-strain curve of C10 concrete.
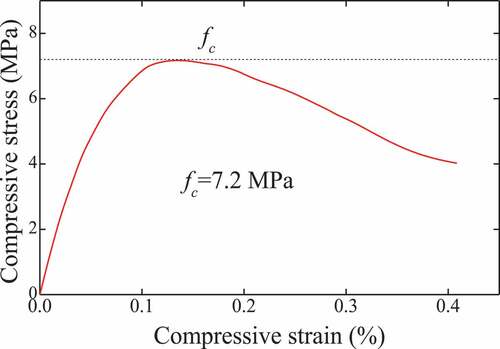
Figure 14. Stress–strain curve of HPB235 steel.
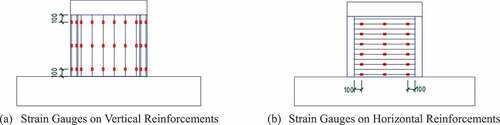
The schematic diagram for the arrangement of the strain gauges is shown in .
Figure 15. Arrangement of strain gauges.
The wallboard models were constructed as scaled models and the corresponding concrete strength was selected as C10 based on the similarity ratio due to the restrictions of the testing conditions (maximum vertical counterweights and horizontal force that can be provided), to ensure that the axial-compression of the wallboards is within an appropriate range on the premise of the safety of the test.
3.2. The test loading device and the loading system
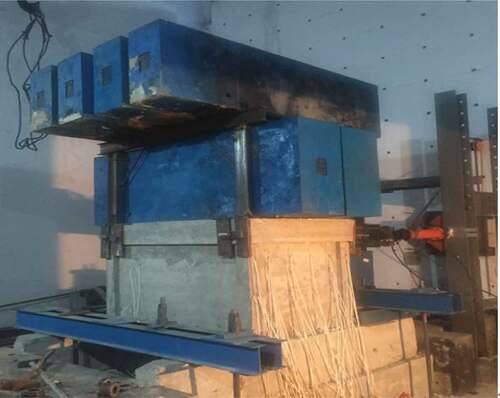
In this experiment, a counterforce wall and a 500 kN tension-compression actuator named ZH-YD50 of the unidirectional hinge and ±250 mm stroke were utilized to perform the horizontal low-cycle cyclic loading.
During the test, the static resistance strain gauge and displacement sensor were utilized to record the strain and displacement of each part of the model structure in real-time.
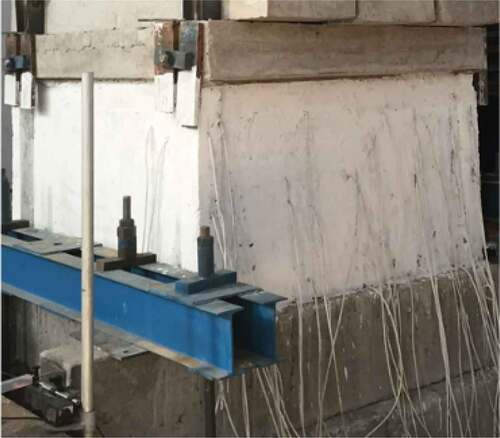
To accurately simulate the vertical loads, the vertical axial force acted on the model structure was simulated with steel ingots fastened to the top of the model structure. The test device is presented in .
Figure 16. Schematic diagram of loading device.
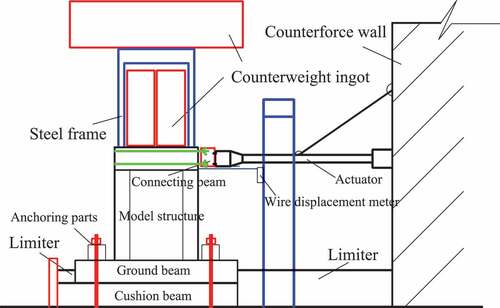
Figure 17. Picture of test equipment.
Symmetric loading histories may not provide pertinent deterioration characteristics for the modeling of the collapsed structural components (Haselton, Liel, and Lange Citation2008; Lignos Citation2008; Lignos, Krawinkler, and Whittaker Citation2011), since they do not contain specific requirements on the largest amplitude that they should be executed (Krawinkler Citation2009; Lu and Yang Citation2015). Therefore, asymmetric loading tests are deemed to be more appropriate for the quantized seismic demand of a component. Besides, given the limitations of the horizontal loading device and the requirement to protect the measuring and loading device from damage during the model collapse process, the horizontal reciprocating loading was changed into a unidirectional loading and unloading after the model was stressed to a certain extent through the removal of the bolt connecting the horizontal actuator to the model, with the application of only horizontal thrust to the model at the later stage. Therefore, the asymmetric loading protocol was adopted in this loading test in that it not only meets the purpose and demand of the test but also fits the objective testing conditions.
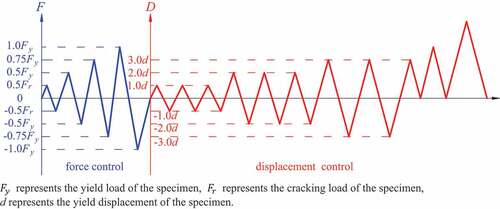
The horizontal load passed through the geometric centroid of the cross-section of the model structure, and the force and displacement hybrid loading control mechanism was adopted (JGJ/T 101-2015 Citation2015), as shown in .
The force control stage: Before the yielding of the specimen, 0.5 times the cracking load was applied on it and repeated at each level (0.5 Fr, 0.5 Fy, 0.75 Fy, and 1.0 Fy).
The displacement control stage: After the yielding of the specimen, the loads were controlled by increasing the horizontal displacements of the wallboard to reach multiples of the yield displacement. Each displacement stage was repeated three times until one of the five basic failure modes occurred.
Figure 18. The cyclic loading programme.
4. Model failure process and hysteretic curve
4.1. Model DW1a and DW1b
) shows that the height–width ratios of the DW1a and DW1b models are all λ = 840/350 = 2.4, the axial compression ratios of wallboard in the DW1a and DW1b models are all n0 = 0.2, and the axial compression ratio of side the columns in the DW1a and DW1b models are all c0 = 0.2, which are equal to n0. The longitudinal bars in the frame side columns of the DW1a and DW1b models are 4-Ф6 and 5-Ф6 (), respectively.
shows the failure process in the DW1a model. It could be found that the failure characteristic of model DW1a is caused by the continuous expansion of the shear failure area of the concrete at the bottom of the wallboard under horizontal reciprocating loads till the eccentric load at the top could no longer be supported.
Figure 19. The failure process in the DW1a model.
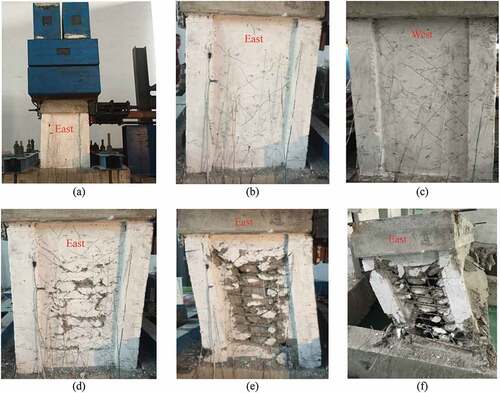
Figure 20. The hysteretic curve of DW1a.
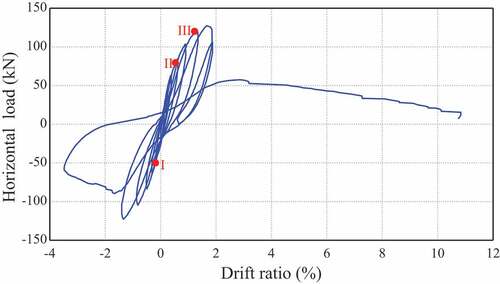
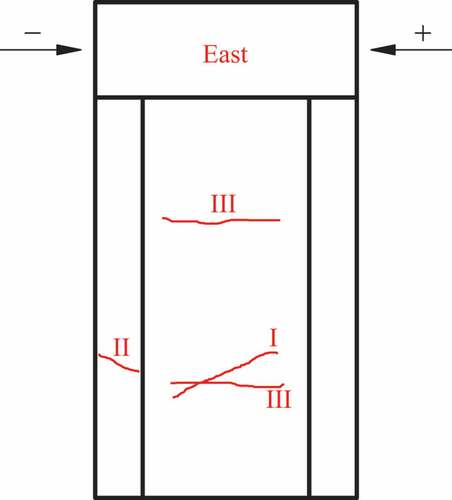
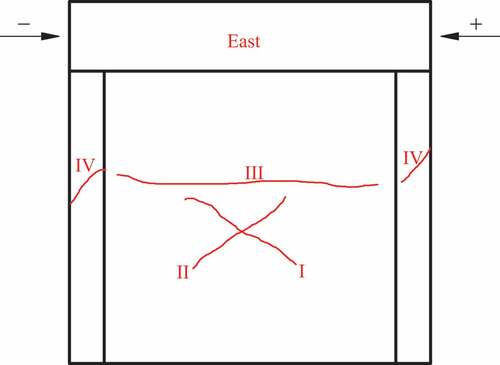
Figure 21. The schematic diagram of the cracks in DW1a.
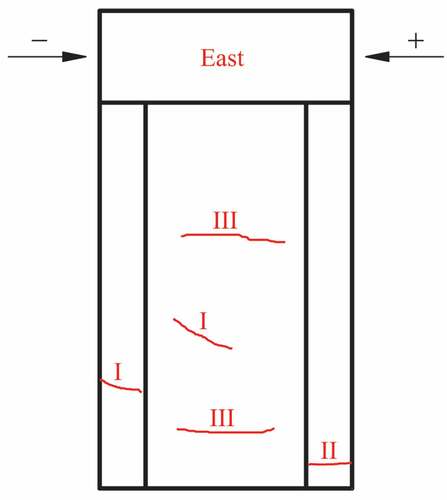
The hysteretic curve (drift ratio versus horizontal load) of the DW1a model is shown in . The schematic diagram of the cracks first appears in the DW1a model as illustrated in , and marked in . When the tensile load reaches −50 kN, the diagonal cracks are first observed in the lower part of the tensile side column and the middle part of the wallboard. The cross cracks in the wallboard gradually increase and develop the network during the cyclic loading. When the thrust load reaches 80 kN, horizontal crack II is observed at the bottom of the tensile side column ()). Afterward, the cross cracks develop rapidly in the wallboard (). When the thrust load reaches 120 kN, the horizontal cracks III are observed in the wallboard, where the horizontal reinforcements are located in the exact area. Besides, the concrete in the area enclosed by the cross cracks and the aforementioned horizontal cracks becomes gradually spalled with an increase in the horizontal thrust loads ()). The concrete side columns remain intact except for the appearance of horizontal cracks in the early stages. With a further increase in the loads, the concrete in the area of the diagonal cracks in the four corners of the wallboard also becomes gradually spalled and the thrust load reaches a peak value of 127.2 kN. Before the peak load, the bow-shaped hysteretic curve is presented as shown in .
The load-bearing capacity declines rapidly as the cracks appear in the four corners ()). When the wallboard model is close to collapse, the concrete in the middle of the wallboard is almost entirely spalled, with only the reinforcement mesh left. The concrete at the bottom of the side column is crushed, which causes the overturning of the wallboard ()). After the peak load, the inverse hysteretic S-shaped curve appears due to the crushing failure ().
During the collapse of the DW1a model, the wallboard model develops a shear failure first and subsequently transforms into a frame structure model from the original frame-shear wall structure. However, the frame structure is not the actual frame structure since the shear cracks have already appeared in the four corners of the side columns of the wallboard and there are still reinforcements in the middle of the wallboard. Therefore, the final collapse is caused by the crushing of the concrete in the bottom corners of the side columns of the wallboard, this results in an excessive tilting of the model in further load applications. However, the model also presents the characteristics of shear action.
shows the failure process in the DW1b model. The bending strength of model DW1b is greatly enhanced compared with model DW1a. The shear slip failure occurs on the compressive side of the wallboard when the lateral displacement increases to a certain value, and the model that is overturned after the corresponding anti-overturning moment could not be balanced with the increased overturning moment.
Figure 22. The failure process of model DW1b.
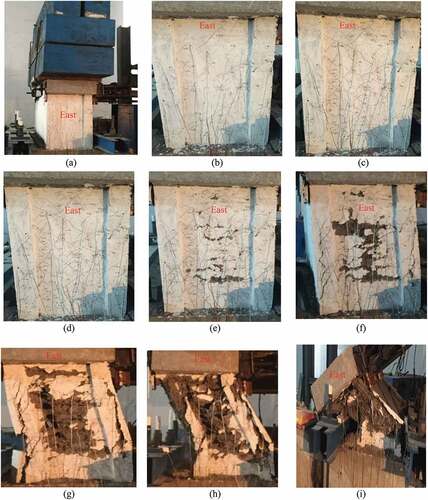
Figure 23. Hysteretic curve of DW1b.
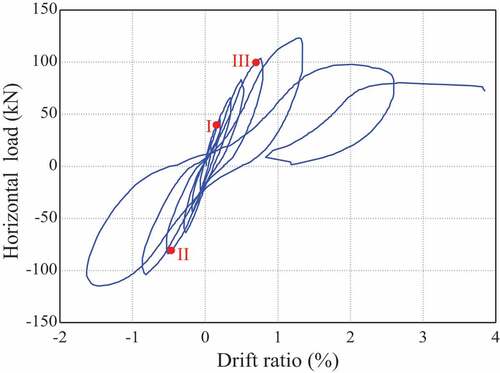
Figure 24. Schematic diagram of cracks in DW1b.
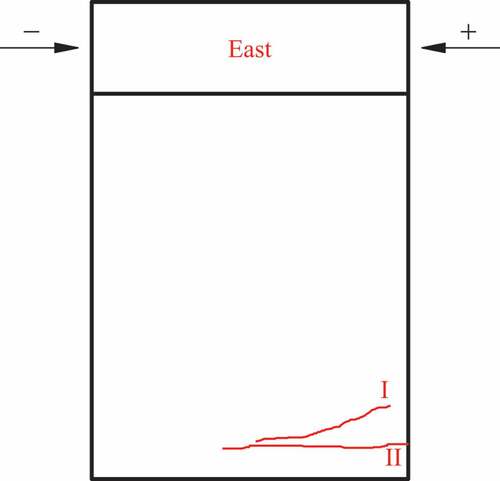
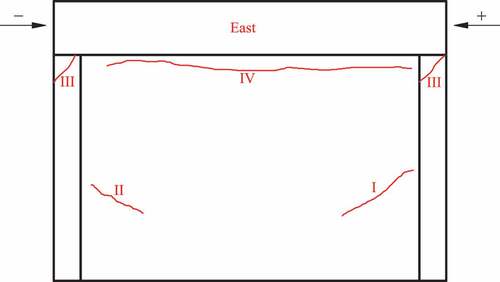
illustrate the hysteretic curve and the schematic diagram of the cracks. When the thrust load reaches 40kN, the first diagonal crack I is observed in the wallboard ()). The cross cracks in the wallboard increase and develop gradually during the cyclic loading ()). When the tensile load reaches −80 kN, diagonal crack II is observed in the tensile side column. The cross cracks in the side columns increase and develop gradually during the cyclic loading ()). When the thrust load reaches 100 kN, horizontal cracks III are observed in the wallboard. An increase in the horizontal displacement results in the spalling of the concrete in the wallboard. ()).
Further, the spalled area of the concrete in the wallboard would expand, and there would be obvious shear cracks in the side columns at the same height of the position that the concrete in the wallboard develops spalling in early times ()). Different from the previous wallboard, obvious shear cracks appear inside the columns, and continuously appear in the side columns with the spalling of the concrete in the wallboard. This is due to the strong reinforcements in the side columns of the wallboard (including vertical reinforcements and the concrete under compression) that would improve the bending capacity of the wallboard so that more shear cracks appear in the side columns and wallboard. Furthermore, the further spalling of the concrete in the wallboard is due to the continuous development of the horizontal and shear cracks in the wallboard ()). Besides, the concrete within the corresponding height range in the side columns is split and spalled due to the full development of the shear cracks. At the final working stage of the wallboard, the concrete cover of the vertical reinforcements is almost entirely spalled with only the reinforcement mesh left in the wallboard ()). The system supporting the load before the collapse of the model is the core area of the side column on the compressive side and the concrete in the wallboard perpendicular to horizontal loads. The anti-overturning moment is produced by the tensile side columns, the part of the wallboard between the tensile side columns, and the longitudinal reinforcements in the wallboard taking the moments about the overturning point of the model. When the drift ratio reaches a certain value that allows the vertical load action line to exceed the overturning point, namely that the overturning moment increases to a certain value beyond the anti-overturning moment, the model would be overturned ()).
Although the ultimate failure of the two models presents the overturning failure characteristics, the overturning of model DW1a is caused by the shear failure of the concrete on the compressive side of the wallboard, which disturbs the balance of the vertical force of the wallboard, whereas the overturning of model DW1b is caused by the shear slip of the concrete on the compressive side of the wallboard, which disturbs the balance of the vertical force of the wallboard.
Based on the hysteretic curve shown in , the bow shape of DW1b model is presented before the peak load, and the inverse S-shape is presented after the peak load. By comparison (), the hysteretic curve of the DW1a and DW1b models are similar to each other. Although the hysteretic curve of the DW1b model was not successfully obtained after the drift ratio reaches about 4% as shown in , it is supposed that the maximum value of the drift ratio would exceed 10% before the collapse.
It is important to note the concrete crushing in the middle area of models DW1a and DW1b is caused by the horizontal reinforcement being much stronger than the concrete. The final collapse modes of both DW1a and DW1b tested in this study are similar to the predicted mode 2 (). By comparison (), the vertical reinforcement ratio of the side column in model DW1b is a little larger than that in DW1a (1.41%>1.13%), and the collapse mode of DW1b is a little closer to mode 3 than that of DW1a.
It also indicates that the shear cracks’ appearance in the wallboard would be delayed and the collapse mode would change from mode 2 to mode 3 if the strength of the side columns increases or the axial compression ratio of side columns decreases.
4.2. Model DW2
The height–width ratio of the DW2 model is λ = 1.71 (), with a relatively small axial pressure (n0 = c0 = 0.01), and the reinforcement size of the side columns is also very small. The above parameters conform to the conditions of overall rotation failure of the wallboard.
depicts the failure process in the DW2 model.
Figure 25. The failure process in the DW2 model.
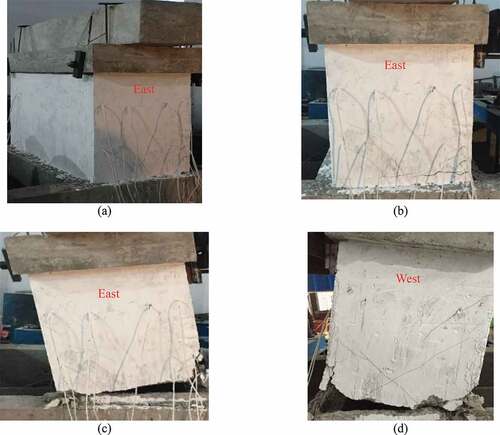
Figure 26. The hysteretic curve of DW2.
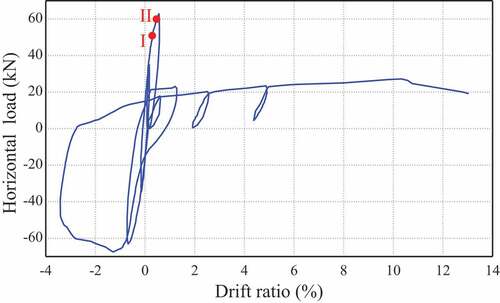
Figure 27. The schematic diagram of cracks in DW2.
depict the hysteretic curve and the schematic diagram of the cracks. First, diagonal crack I is observed in the wallboard when the thrust load reaches 50 kN; horizontal crack II is soon observed at the bottom of the wallboard when the thrust load reaches 60 kN ()). During the cyclic loading, the horizontal crack elongates, and the concrete in the corners at the bottom of the wallboard becomes crushed ().
As shown in , the model DW2 presents a bow-shaped hysteretic curve before reaching the peak load and quickly loses the load-bearing capacity after the peak load due to the huge crack at the bottom.
The DW2 model develops the failure of overturning collapse due to its large rotation angle. The experimental result in this study validated that the collapse mode of the DW2 model with λ = 1.71 and n0 = c0 = 0.01 is consistent with the predicted mode 1.
4.3. Model DW3
The height–width ratio of the DW3 model is λ = 840/840 = 1.0 (), and the axial compression ratios are n0 = 0.15, c0 = 0.25. The failure process in the DW3 model is shown in . When the horizontal load increases to a certain value, there is a cross-diagonal crack network (). During the application of the thrust loads, horizontal cracks appear in the middle of the wallboard, and the diagonal cracks also appear in the side columns at the same height ()). When the horizontal displacement is further increased, the vertical counterweight, top beam, and the floor slab would stagger along the horizontal direction ()). The counterweight and the supporting beam slab slide along the wallboard and subsequently get overturned (()).
Figure 28. The Failure process in the DW3 model.
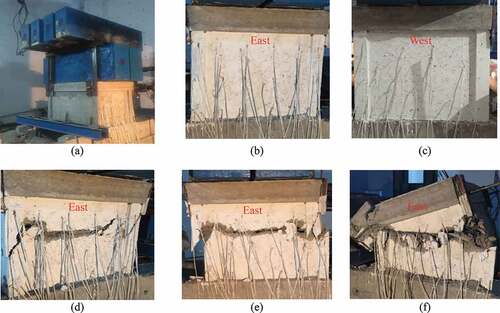
Figure 29. The hysteretic curve of DW3.
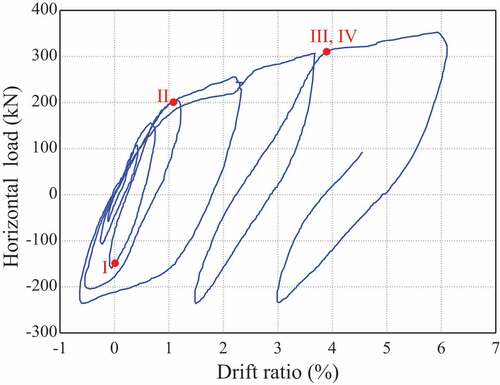
Figure 30. The schematic diagram of cracks in DW3.
show that the diagonal cracks I and II appear first in the middle of the wallboard when the tensile load reaches −150 kN and the thrust load reaches 200 kN. The cross cracks in the wallboard gradually increase and develop the network during the cyclic loading ()). An obvious cross-network appears in the wallboard when the thrust load reaches 300 kN ()). When the thrust load reaches 310 kN in the next cycle, horizontal crack III appears in the middle of the wallboard, and the diagonal crack IV appears in the side columns at the same height. ) shows an elongation of cracks III and IV during the cyclic loading.
As shown in , the model DW3 presents a spindle-shaped hysteretic curve before reaching the peak load. Although the hysteretic curve is not successfully obtained after the peak load, it is supposed that the shape of the hysteretic curve would turn into an inverse S-shape, and the maximum drift ratio would exceed 10%.
The top beam, floor slab, and the upper vertical counterweights are dislocated along the direction of the aforementioned horizontal cracks under further loads (displacement-controlled loads) (). The wallboard is ceaselessly abrased, which causes a decrease in its height till the slipped displacement of the upper counterweights and the supporting beam and slab of the wallboard to a limit value, and eventually causes the whole overturning collapse ().
Although the initial failure of model DW3 with c0 = 0.25> n0 = 0.15 is somewhat similar to the predicted mode 3, the final collapse mode is not in accord with the predicted mode 3, but the transverse slip mode.
4.4. Model DW4a and DW4b
The height–width ratio of model DW4a and model DW4b is 840/1260 = 0.67 (), and the axial compression ratios of wallboards of both DW4a and DW4b are n0 = 0.02, which are far smaller than the axial compression ratio of columns c0 = 0.25, 0.2 ().
shows the failure process in the DW3 model.
Figure 31. The failure process of model DW4a.
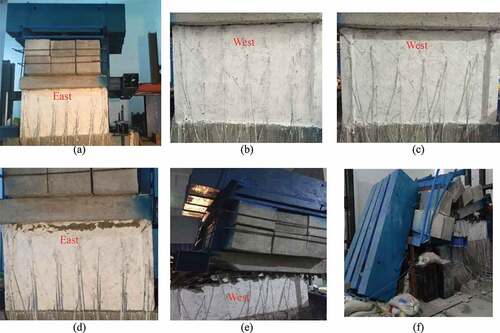
Figure 32. Hysteretic curve of DW4a.
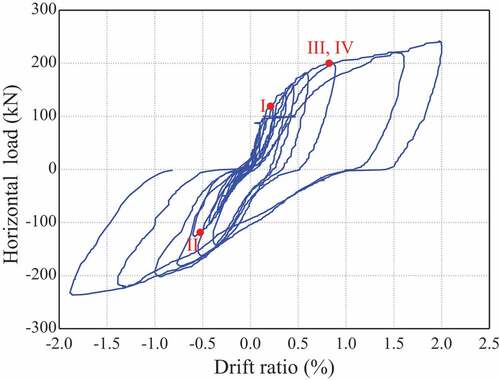
Figure 33. Schematic diagram of cracks in DW4a.
illustrate that when the thrust and the tensile load of the DW4a model reach ±120 kN, diagonal cracks I and II are observed in the wallboard; during the cyclic loading, cross diagonal crack network appears in the wallboards; when the thrust load reaches 200 kN, the diagonal cracks III appear in the side columns at the junction of the wallboard and the top beam ()), this failure mode is similar to the predicted mode 4 shown in ); however, the horizontal crack IV appears simultaneously at the junction of the wallboard and the top beam ()). The vertical counterweights slip along the horizontal direction with further displacement. During the continuous horizontal dislocation, there is a constant crushing of the wallboard, with a decrease in its height till the counterweights of the upper part slide out along the wallboard. Besides, the beam plate and the upper counterweight are eventually overturned (). The final collapse is caused by the slip induced by the shear action. The DW4a model presents an inverse S-shape hysteretic curve as shown in .
shows that the development pattern of the cracks in the wallboard model DW4b is similar to that of model DW4a.
Figure 34. The failure process of model DW4b.
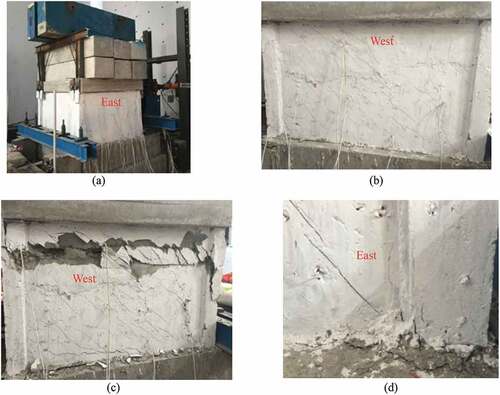
Figure 35. Hysteretic curve of DW4b.
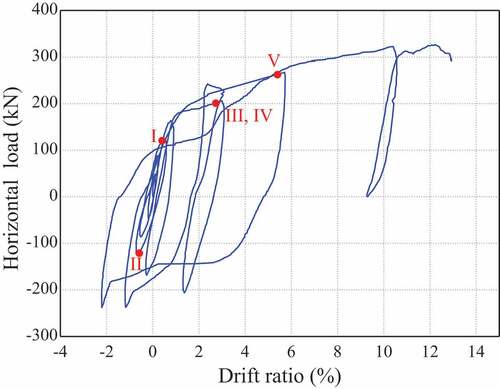
Figure 36. Schematic diagram of cracks in DW4b.
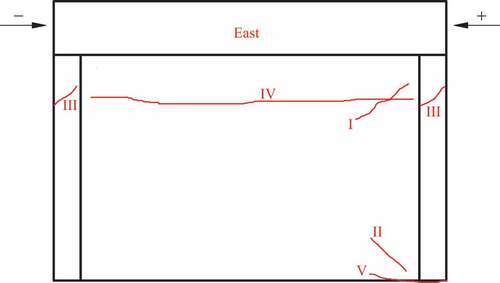
show that when the thrust and the tensile load of the DW4b model reach ±120 kN, diagonal cracks I and II are observed in the wallboard; when the thrust load reaches 200 kN, diagonal cracks III appear in the side columns, and horizontal crack IV appear in the wallboard; when the thrust load reaches 260 kN, crack V at the bottom of the side column appears. The final overturning collapse is caused by the slip induced by the shear action. The DW4b model presents an inverse S-shaped hysteretic curve ().
Although the initial failures of the DW4a and DW4b models with c0> n0 are somewhat similar to the predicted modes 4, the final collapse modes are not in accord with the predicted modes 4, but the transverse slip modes.
4.5. Comparison
shows that the height–width ratios and the axial compression ratios of the wallboards in models DW1a and DW1b (λ = 2.4, n0 = 0.2) are higher than those in the other models, and that the vertical crushing (mode 2) is caused by the weakened bottom section due to shear-compression cracks. shows the peak load and the displacement tested in this study. Comparatively, the peak load and the displacement at the peak state of the DW1a model are close to those of DW1b, which means that the higher vertical reinforcement ratio of the side column cannot strengthen the load-bearing capacity of the structure with collapse mode 2. The DW2 model with low axial compression ratios of the wallboard and side column (n0 = 0.01, c0 = 0.01) develops the failure of overturning collapse (mode 1) due to the massive rotation angle, which allows large transverse displacement before the collapse. The results showed that the maximum displacement of the DW2 model is significantly larger than the displacement at the ultimate state ( and ). The models DW3, DW4a, and DW4b present transverse slip modes, which are not in accord with the predicted modes, due to their higher axial compression ratios of side columns than axial compression ratios of wallboards (c0 > n0). Therefore, further experimental researches and numerical analyses are expected to improve the prediction method.
Table 4. Peak load and displacement.
5. Conclusions
In this paper, six scaled models of RC spatial wallboard structures were designed and constructed. Also, low-cyclic horizontal loading tests were conducted to verify the four of five main collapse failure modes of wallboards; however, the test of a model structure that develops collapse mode 5 caused by integral shear-compression fracture was not conducted due to the difficulty in the realization of a high axial compression ratio. To verify and validate the prediction of collapse mode 5 of the wallboard with high axial compression in future researches, there is a need for an improved experimental method. The distribution of the cracks and the collapse modes in the RC wallboard with different axial compression ratios and height–width ratios under horizontal earthquake action were simulated. The main conclusions and prospects are as follows:
To ensure that the test conditions are closed to reality, steel ingot counterweights were utilized to simulate the self-weight of the building based on the analytic requirements of the collapse tests of RC wallboard structures. Meanwhile, at the later stage of the collapse test, large horizontal displacements could be applied to the model structure under the premise of ensuring the safety of devices and personnel by reasonably designing the joint between the actuator and the beam.
The collapse modes of the RC wallboard models under a low-cyclic horizontal loading are consistent with those predicted in theory when the axial compression ratio of the wallboard and the ratio of the side column are equal (n0 = c0). However, when c0 is larger than n0, although the initial failure is somewhat similar to the predicted mode, the final collapse mode tends to be a transverse slip mode, which is not consistent with the predicted mode.
A new collapse mode, namely the transverse slip mode is found through the experimental study. The axial compression ratio of the side column c0 has a great impact on the collapse mode.
The study on the collapse modes of RC wallboards under the earthquake action is of great significance in the improvement of the anti-collapse design of RC frame wallboard structures and the anti-collapse performance of the structures. The collapse modes and criteria summarized in this paper can describe the behavioural characteristics of wallboards in the process of collapse to a certain extent.
Further research should be conducted in the following directions:
The impacts of the location and size of the openings in the collapse modes of the wallboards should be investigated.
It is necessary to further establish a unified and simplified model to analyze the collapse of the wallboards based on existing collapse models of frame wallboards.
The research on the collapse of an integral structure of frame wallboards involves the collapse models of the wallboards, floor, and frame joints. The focus of this paper is only placed on the collapse models of wallboards. In the future, a study should be performed on the failure models of the floor and frame joints, thus establishing the collapse model of an integral structure of frame wallboards and the corresponding collapse model of the integral structure.
To improve the accuracy of the prediction, more parameters should be investigated, and further experimental researches and numerical analyses are expected to validate the prediction.
The quasi-static experiment conducted in this study can simulate the seismic action to a certain extent. In subsequent studies, the actual seismic action should be simulated, and the shaking table tests should be conducted to verify and correct the collapse mode of the RC wallboard.
Disclosure statement
No potential conflict of interest was reported by the author(s).
Correction Statement
This article has been republished with minor changes. These changes do not impact the academic content of the article.
Additional information
Funding
Notes on contributors
Zhixiang Zha
Zhixiang Zha received his Ph.D. in Ocean & Civil Engineering from Shanghai Jiao Tong University in 2015. He is currently a lecturer at NingboTech University, his research focuses on seismic behavior of reinforced concrete structures, structural performance of Rock and Soil Anchorage.
Tao Wang
Tao Wang received his Ph.D. in architecture and building engineering from Tokyo Institute of Technology in 2009, and had been working at Center of Urban Earthquake Engineering (CUEE) as a postdoctoral fellow. He is currently an associate professor at NingboTech University, his research focuses on stability evaluation, seismic safety evaluation and structural strengthening of steel structure and RC structure.
Kaiwen Wu
Kaiwen Wu received his Msc in Architecture and civil engineering from Jiangxi University of Science and Technology in 2021, and had been working at Zhejiang Provincial Architectural Design Institute as a structure engineer. He is currently an assistant at Zhejiang University, his research focuses on structure engineering and seismic design.
Wei Peng
Wei Peng received his Ph.D. in structural engineering from Zhejiang University in 1998, and had been working at Zhejiang University of Technology as an associate professor. He is currently a professor at NingboTech University, his research focuses on stability and vibration of structural engineering, bridge engineering health monitoring and performance evaluation.
Zhehua Wu
Zhehua Wu received his Ph.D. in civil engineering from Zhejiang University in 2003, and had been working at Center of Wind Engineering in Tokyo Polytechnic University as GCOE researcher. He is currently a senior engineer at NingboTech University, his research focuses on structural control and seismic safety evaluation.
Dequan Gu
Dequan Gu is currently a undergraduate who major in Civil Engineering at NingboTech University.
References
- Araki, Y., and K. D. Hjelmstad. 2000. “Criteria for Assessing Dynamic Collapse of Elastoplastic Structural Systems.” Earthquake Engineering & Structural Dynamics 29: 1177–1198. doi:10.1002/1096-9845(200008)29:8<1177::AID-EQE963>3.0.CO;2-E.
- Bozorgnia, Y., and V. V. Bertero. 2003. “Damage Spectra: Characteristics and Applications to Seismic Risk Reduction.” Journal of Structural Engineering 129 (10): 1330–1340. doi:10.1061/(ASCE)0733-9445(2003)129:10(1330).
- Dan, D., A. Fabian, and V. Stoian. 2011. “Theoretical and Experimental Study on Composite Steel–concrete Shear Walls with Vertical Steel Encased Profiles; Nonlinear Behavior of Composite Shear Walls with Vertical Steel Encased Profiles.” Journal of Constructional Steel Research 67 (5): 800–813. doi:10.1016/j.jcsr.2010.12.013.
- GB50666-2011. 2011. People’s Republic of China National Standard. 2011. Code for Construction of Concrete Structures. Beijing: China Architecture & Building Press.
- Goulet, C. A., C. B. Haselton, J. Mitrani-Reiser, J. L. Beck, G. G. Deierlein, K. A. Porter, and J. P. Stewart. 2007. “Evaluation of the Seismic Performance of a Code-conforming Reinforced-concrete Frame Building—from Seismic Hazard to Collapse Safety and Economic Losses.” Earthquake Engineering & Structural Dynamics 36 (3): 1973–1997. doi:10.1002/eqe.694.
- Greifenhagen, C., and P. Lestuzzi. 2005. “Static Cyclic Tests on Lightly Reinforced Concrete Shear Walls.” Engineering Structures 27 (11): 1703–1712. doi:10.1016/j.engstruct.2005.06.008.
- Haselton, C. B., A. B. Liel, and S. T. Lange. 2008. Beam-Column Element Model Calibrated for Predicting Flexural Response Leading to Global Collapse of RC Frame Buildings. No. 152. Berkeley, CA, USA: Pacific Earthquake Engineering Research Center (PEER).
- Hidalgo, P. A., R. Jordan, and C. A. Ledezma. 2006. “Experimental Study of Reinforced Concrete Walls under Shear Failure.” Applied Mechanics and Materials 23 (1): 514–526.
- Huang, D., X. Han, S. Qiao, J. Jin, and J. Cui. 2021. “Component Deformation-based Collapse Evaluation of RC Frame under Different Collapse Criteria.” Earthquake and Structures 21 (2): 113–124.
- Ibarra, L. F., R. A. Medina, and H. Krawinkler. 2005. “Hysteretic Models that Incorporate Strength and Stiffness Deterioration.” Earthquake Engineering & Structural Dynamics 34 (12): 1489–1511. doi:10.1002/eqe.495.
- JGJ/T 101-2015. 2015.Profession Standard of the People’s Republic of China: Specification for Seismic Test of Buildings, 86. Vol. 1. Beijing: China Architecture & Building Press.
- Krawinkler, H. 2009. “Loading Histories for Cyclic Tests in Support of Performance Assessment of Structural Components.” 3rd International Conference on Advances in Experimental Seismic Engineering, Pacific Earthquake Engineering Research Center Annual Conference (PEER), San Francisco, CA, USA.
- Li, B., Z. Pan, and W. Xiang. 2015. “Experimental Evaluation of Seismic Performance of Squat RC Structural Walls with Limited Ductility Reinforcing Details.” Journal of Earthquake Engineering 19 (2): 313–331. doi:10.1080/13632469.2014.962669.
- Lignos, D. G. 2008. “Sidesway collapse of deteriorating structural systems under seismic excitations.” PhD Dissertation, Stanford University, USA.
- Lignos, D. G., H. Krawinkler, and A. S. Whittaker. 2011. “Prediction and Validation of Sidesway Collapse of Two Scale Models of a 4-story Steel Moment Frame.” Earthquake Engineering & Structural Dynamics 40 (7): 807–825. doi:10.1002/eqe.1061.
- Liu, X. 2007.The Development and Prospect of Structural Engineering, 180. Beijing: China Construction Industry Press.
- Lopes, M. S. 2001. “Experimental Shear-dominated Response of RC Walls Part I: Objectives, Methodology and Results.” Engineering Structures 23 (3): 229–239. doi:10.1016/S0141-0296(00)00041-9.
- Lu, X., and J. Yang. 2015. “Seismic Behavior of T-shaped Steel Reinforced Concrete Shear Walls in Tall Buildings under Cyclic Loading.” The Structural Design of Tall and Special Buildings 24 (2): 141–157. doi:10.1002/tal.1158.
- Luna, B. N., J. P. Rivera, and A. S. Whittaker. 2015. “Seismic Behavior of Low-Aspect-Ratio Reinforced Concrete Shear Walls.” ACI Structural Journal 112 (5): 593–603. doi:10.14359/51687709.
- Meigooni, F. S., and F. Mollaioli. 2021. “Simulation of Seismic Collapse of Simple Structures with Energy-based Procedures.” Soil Dynamics and Earthquake Engineering 145 (2021): 106733. doi:10.1016/j.soildyn.2021.106733.
- Miguel, P. F., J. Navarro-Gregori, M. A. Fernandez-Prada, and J. L. Bonet. 2013. “A Simplified Method to Predict the Ultimate Shear Stress of Reinforced Concrete Membrane Elements.” Engineering Structures 49 (2): 329–344. doi:10.1016/j.engstruct.2012.11.009.
- Toshimi, K., N. Yoshiaki, and M. Masaki. 2011. “Preliminary Reconnaissance Report of the 2011 Tohoku-Chiho Taiheiyo-Oki Earthquake.” Proc. F The Geological and Earthquake Engineering 23 (10): 1007/978-4-431-54097-7-4.
- Vulcano, A., and V. V. Bertero. 1987. Analytical Models for Predicting the Lateral Response of RC Shear Wall: Evaluation of Their Reliability. Berkeley, California: Engineering Research Center, University of Calfornia.
- Wallace, J. W., K. J. Elwood, and L. M. Massone. 2008. “Investigation of the Axial Load Capacity for Lightly Reinforced Wall Piers.” Journal of Structural Engineering 134 (9): 1548–1557. doi:10.1061/(ASCE)0733-9445(2008)134:9(1548).
- Weng, X. 2015. “Study on Collapse Patterns of Building Structures and the Distribution of Survival Room in Collapsed Building Ruins.“ Institute of Engineering Mechanics, China Earthquake administration. PhD Dissertation.
- Xie, L. 2009. “Lessons Learnt from the Great Sichuan Wenchuan Earthquake.” Engineering Science 11(6):In Chinese. 28–35.
- Zareian, F., and H. Krawinkler. 2010. “Structural System Parameter Selection Based on Collapse Potential of Buildings in Earthquakes.” Journal of Structural Engineering 136 (8): 933–943. doi:10.1061/(ASCE)ST.1943-541X.0000196.
- Zareian, F., H. Krawinkler, L. Ibarra, and D. Lignos. 2010. “Basic Concepts and Performance Measures in Prediction of Collapse of Buildings under Earthquake Ground Motions.” The Structural Design of Tall and Special Buildings 19 (1–2): 167–181. doi:10.1002/tal.546.
- Zha, Z. 2017. “Research on behavior and failure of reinforced concrete walls under seismic load.” PhD Dissertation, Shanghai Jiao Tong University. (In Chinese)
- Zhang, H. 2007. “Study on the Performance-based Seismic Design Method for Shear Wall Structures.” PhD Dissertation, Tongji University. (In Chinese)
- Zhang, J., W. Zheng, W. Cao, and H. Dong. 2018. “Dynamic Performance Test of Low-rise Concrete Shear Wall with Single Layer of Web Reinforcement and Inclined Steel Bars.” China Civil Engineering Journal 51 (s1): 65–71.
- Zhou, H., and J. Li. 2017. “Effective Energy Criterion for Collapse of Deteriorating Structural Systems.” Journal of Engineering Mechanics 143 (12): 04017135. doi:10.1061/(ASCE)EM.1943-7889.0001356.
- Zhou, G., H. Sun, and D. Zhou. 2010. “Experimental Research on Earthquake-resistant Behavior of Reinforced Concrete Shear-walls.” Journal of ShanDong Jianzhu University 25(1):In Chinese. 41–50.