
 ?Mathematical formulae have been encoded as MathML and are displayed in this HTML version using MathJax in order to improve their display. Uncheck the box to turn MathJax off. This feature requires Javascript. Click on a formula to zoom.
ABSTRACT
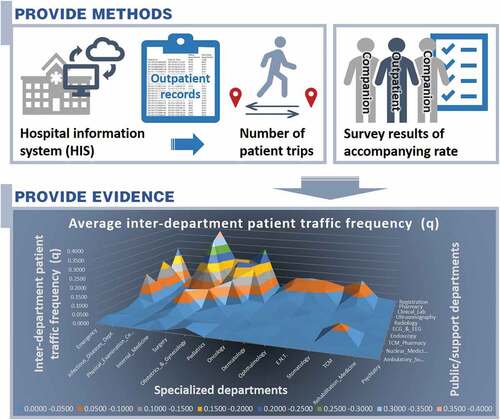
The spatial distribution of patient traffic is important for hospital building design, but there is still insufficient targeted discussion for Chinese outpatient buildings. To obtain reliable evidence, this study examined the outpatient traffic spatial distribution in a large Chinese general hospital by describing it as a set of inter-department patient traffic frequencies (q), which means the ratio of the number of patient trips within a pair of department units to the hospital’s total outpatient visits. Through three hospital samples and 2443 patient samples, three main findings were obtained: (1) The “q” value sets of each hospital sample and their average value set were obtained, and the idea of using them as evidence in outpatient building design was presented; (2) Outpatient traffic distribution was similar among hospitals and was characterized by clustering among certain departments: 38 out of 150 traffic sections created 90% of outpatient traffic, and four public departments’ outpatient traffic presented directivity; (3) There was an indicated slight variation among the samples; therefore, more precise evidence for specific cases required “q” values generated by themselves, which could be obtained conveniently through methods presented in this study. Subsequently, both evidence and methods are provided.
Graphical abstract
1. Introduction
Outpatient buildings usually occupy approximately 20% of the total building area of large general hospitals in China (National Health Commission of the People’s Republic of China, Citation2021, 6–7) and are visited frequently by large numbers of patients. Consequently, outpatients must often walk long distances and wait for a long time (Yang and Guo Citation2013), which significantly reduces efficiency (Vos, Groothuis, and van Merode Citation2007) and patient satisfaction (Parente, Pinto, and Barber Citation2005). To shorten the travel distance in outpatient building design, outpatient flow should be considered carefully in terms of reasonability (Tzortzopoulos et al. Citation2009; Long, Zhang, and Ma Citation2016), which depends on meeting the corresponding functional demands and requires reliable evidence (Ulrich Citation2006). To this end, the spatial distribution of patient traffic volume, as a comprehensive reflection of outpatient medical flow and functional requirements, should be important evidence. However, evidence on outpatient buildings in China is still insufficient.
A Chinese book Modern Hospital Building Design proposed the concept of “traffic intensity and frequency” (hereinafter “traffic frequency”) at the beginning of this century to describe the frequency of trips between departments (Luo Citation2009, 21). It deconstructs the internal traffic of a general hospital into a network and investigates the traffic frequency between each pair of departments. The higher the frequency, the higher the aggregation of traffic volume between this pair of departments. In this way, the concept evaluates traffic frequency of people and goods between Chinese hospital departments into four levels, “高强紧密 [high strength, closely],” “反复多次 [repeatedly],” “不连贯 [incoherently],” and “极少 [very few],” and these are presented in .
Table 1. Traffic intensity and frequency analysis chart of hospital departments (translated from modern hospital building design).
While Luo’s (Citation2009, 21) work has long been adopted as the main relevant research, it uses vague terms to define the four levels without specifying their assessment criteria and the method. This makes it conceptual guidance that cannot support current research regarding accuracy, reliability, and real-time performance. For example, it was used as a quantitative indicator for calculating the “organizational efficiencyFootnote1” of hospital buildings by Bai (Citation2011, 71) but its lack of accurate data limited the accuracy of Bai’s results. Additionally, Luo’s study treats the “outpatient department” as one department without describing the traffic distribution within an outpatient building.
As medical procedures become more precise and complex, hospital buildings need to become more sophisticated. Consequently, architects are constantly looking for more accurate and reliable evidence for hospital design. The theory of evidence-based design (Ulrich Citation1984) argues that decisions about the built environment should be based on sound research results (Hamilton Citation2004).
Early empirical research on traffic distribution in medical buildings focused mainly on the circulation of medical staff in nursing units. Based on the concept of functional efficiency, Pelletier and Thompson (Citation1960) identified 16 areas on a typical nursing ward and recorded the number of trips between each pair of areas, which they labeled the “link.” They found that 14 links accounted for more than 91% of nurse traffic in the nursing unit, which was the prime determinant of unit efficiency. The weights (relative trip frequencies) of these 14 links were combined with distance measures for the units to be evaluated, and the result was referred to as the “Yale Traffic Index.” (Pelletier and Thompson Citation1960, cited by Delon and Smalley Citation1970). Subsequently, scholars proposed data evidence (Zadeh, Shepley, and Waggener Citation2012) and quantitative models to evaluate the transportation efficiency of nursing units, such as the MPA/BTAFootnote2 Nursing Unit Analysis Model (Kobus et al. Citation2000, pp: 138–139). For circulation among hospital departments, Delon and Smalley (Citation1970) took the number of hospital staff trips as the basic indicator to measure the relationships between pairs of hospital departments. They recorded hourly traffic frequencies of the day shift during six weeks, by personnel classification and origin and destination, with separate forms used for incoming and outgoing trips. Based on the analysis of collected information, they pointed out that 55% of all hospital departments accounted for 75% of the incoming and outgoing personnel traffic of nursing units, and the number of trips between departments whose medical flow was determined could be predicted according to the medical flow.
Existing quantitative empirical studies on traffic distribution in hospitals have mainly focused on staff flow, whereas patient flow is more important in outpatient building design. However, Chinese hospitals have been omitted from existing research, and the results cannot be directly adopted in China due to different demand (Cai and Zimring Citation2019). Additionally, data collection in existing studies required daily on-site observations for weeks or longer. This amount of work causes difficulty in obtaining samples over a longer period and applicating to other cases, which is unfriendly to obtaining self-data in specific case study for more reliable results (Long and Kuang Citation2014; Ulrich Citation2006).
Therefore, to obtain more accurate and reliable evidence for Chinese outpatient building design and research, and considering the insufficient targeted discussion in existing studies (), this study focused on outpatient buildings of large general hospitals in China and explored the general characteristics and rules of the spatial distribution of their patient traffic volume empirically and quantitatively. To support case-specific data obtaining and consider existing methods’ flaws (), we also developed a data collection method for longer periods and easier operation.
Table 2. Comparison of existing studies on hospital traffic volume with problems dealt with in this study.
1.1. Theoretical definition
The “large general hospital” referred to in this study is a “Grade 3” hospital following China’s “The measures for the administration of hospital grades,” in which “Grade 3” is the highest grade (National Health Commission of the People’s Republic of China Citation1989). As “department” is the basic functional unit of an outpatient building, we used patient traffic between department units (hereinafter “inter-department patient traffic”) in this study.
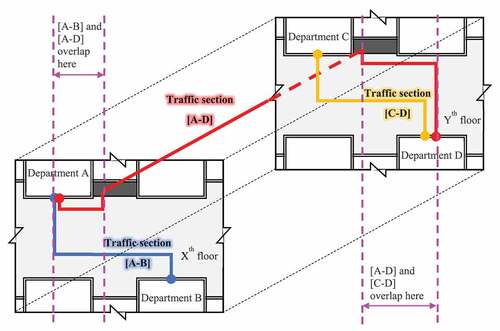
According to the aforementioned studies, the spatial traffic distribution in hospitals can be measured by the number of trips, which is also suitable for this study. Considering that the visit scale of different outpatient buildings varies greatly in China, using the number of trips as the eigenvalue may reduce the research results’ universality. Therefore, we converted the number of trips into an indicator with a similar meaning, but the impact of the scale was ruled out, which could be described as “traffic frequency” mentioned by Luo’s (Citation2009, 21). We measured the spatial distribution of patient traffic volume in the Chinese outpatient building by the “inter-department patient traffic frequency” value set and defined the channel connecting a pair of department units as a “traffic section,” with some overlapping in space ().
Figure 1. Schematic diagram of “traffic section”.
Quantitatively, the number of patient trips is generally directly proportional to the number of outpatient visits. Therefore, to eliminate the influence of the visit scale, we defined “inter-department patient traffic frequency (q)” as the ratio of the annual number of patient trips (hereinafter “annual patient traffic volume”) passing through a traffic section (Q) to the annual number of outpatient visits to this outpatient building (v). In this way, the set of “q” values of an outpatient building can reflect the relative volume of patient traffic in different traffic sections, which is only determined by the corresponding outpatient medical flow and department type.
In the above equation, the values of “Q” and “v” could be obtained mainly from a hospital survey. Taking as an example, suppose we learned from the investigation that the “Q” values of the traffic sections [A–B] (the blue line), [A–D] (the red line), and [C–D] (the yellow line) were “X,” “Y,” and “Z,” and the “v” value of this hospital was “N.” According to Equationequation (1)(1)
(1) , the “q” values of section [A–B], [A–D] and [C–D] were respectively “X/N,” “Y/N” and “Z/N.”
The results in the above form provide direct evidence for department layout design. For the local space design of the corridor, the “q” values of the corridor were required instead of the traffic section, in which the overlapping part should be further calculated. For example, the “q” value of the overlapping part of [A–B] and [A–D] in should be the sum of the “q” values of [A–B] and [A–D].
1.2. Types of traffic sections
The origin and destination of the traffic sections were both department units, so the type of connected units identified the type of traffic section. China’s policies have strict regulations (National Health Commission of the People’s Republic of China Citation2016, 1–2) for departments in large general hospitals (grade 3 hospitals). Therefore, the department settings are the same in most large general hospital outpatient buildings in China, including outpatient, emergency, and related medical technology departments. Subsequently, combined with the routine separation of outpatient buildings (Zhang Citation2019), we listed the routine department units related to outpatient transportation in a typical large general hospital outpatient building in China and grouped them according to their role in the outpatient medical flow of China ().
Table 3. Department units in outpatient buildings in large general hospitals in China.
Most large hospitals in China are publicFootnote3 (National Health Commission of the People’s Republic of China Citation2019), so they share similar outpatient medical flow (), and similar instructions can be found on most Chinese general hospitals’ official websites (), signs in the outpatient lobby, and related studies (Jiang Citation2005, 28; Yang and Guo Citation2013; Hu Citation2016, 43; Zhang Citation2019, 86).
Figure 2. Outpatient medical flow in China.
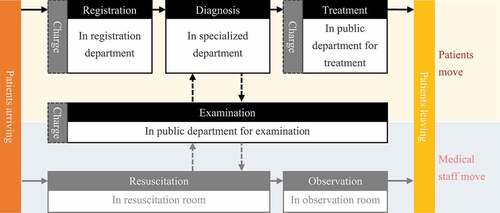
Figure 3. Outpatient medical flow from a Chinese general hospital’s official website (translated and analyzed from http://www.byytfy.com/mzfw/jyxz/).
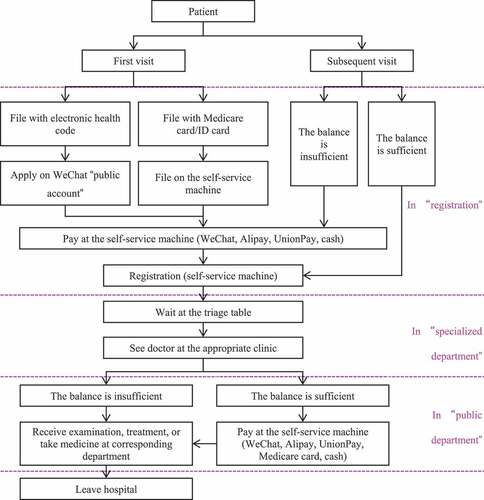
After arriving at the outpatient building, patients register (manual service windows or self-service machine), choose appropriate clinical departments, and the registrar or nurse at the information desk provides advice on the department selection. The patients then see doctors at a specialized department. Some patients may need to go to public departments for examinations and then return to the specialized department with their examination reports, which might be repeated several times before the doctors’ final diagnosis. Finally, some patients can leave, while other patients must go to a public department for treatment (including pharmacy) and then leave. Moreover, patients are required to pay fees before registration, examinations, and treatment (including pharmacy); however, as mobile payments have become common in Chinese general hospitals, and the medical payment flow does not require additional patient movement, it was not considered in this model.
In addition to the above arterial medical flow, some branch medical flows are affected by complex subjective and objective factors and present great uncertainty. In the outpatient medical flow between “specialized departments” and “public department for examinations,” as some examination items may need appointments and are not carried out on the day of the patient’s visit or the examination report is not immediately available, the patients’ traffic behavior could be “specialized department → examination department → entrance of building → registration department (examination department) → examination department (registration department) → specialized department” instead of “specialized department → examination department → specialized department” in the arterial medical flow. However, whether and how this medical flow happens depends on individual regulations, which differ among hospitals. As we want to obtain universal results in this study, this medical flow branch was omitted in our model.
Similarly, in some cases, outpatients might be required to visit different departments for several examinations at once, and the patients’ traffic behavior in this part could be “specialized department → examination department A→ examination department B→ examination department C → … → specialized department” instead of “specialized department → examination department → specialized department” in the arterial medical flow. This depends more on personal subjective factors than the former medical flow branch. Therefore, whether and how this medical flow branch occurs could be uncontrollable and unpredictable. Additionally, China’s current medical policy requires hospitals to control the proportion of medical technology examinations as much as possible, so this medical flow branch is less likely to occur. Therefore, this medical flow branch was not included in our model.
In summary, in a typical outpatient building in China, outpatients mainly travel between 150 pairs of departments in two types in the model, which are also traffic section types:
1) [specialized department–public department], totally 135 pairs;
2) [Supporting department (registration)–specialized department], totaling 15 pairs.
1.3. Traveler categories
Outpatients are the major traveler category who generate patient traffic volumes in outpatient buildings. Meanwhile, in China, outpatients were usually accompanied by family members or friends during the visit (Luo Citation2009, 107), and there were 1.15 ~ 2 companions for each patient on average (Zhang Citation2013, 17; Jiang and Ge Citation2021). Companions always travel with patients in the entire medical flow among departments and provide psychological and behavioral assistance to patients. Therefore, patients and their companions are both components of travelers, and the “Q” value in Equationequation (1)(1)
(1) includes two parts: the annual traffic volume generated by the outpatients themselves (p) and the annual traffic volume generated by the outpatients’ companions (c):
The above “p” value was obtained directly from a field survey. Meanwhile, as the above “c” value is roughly directly proportional to the patient volume according to existing studies, we counted the ratio of the companion volume to the patient volume through a sample survey, called the “accompanying rate” (r), and then multiplied the “r” value by the “p” value from our survey to obtain the companion volume (c) in Equationequation (2)(2)
(2) :
Owing to the different disease types, the accompanying rates might differ among specialized departments, which were also different among traffic sections. Meanwhile, the accompanying rate might differ among different regions due to different habits and customs. Moreover, the period patients choose to visit might reflect disease progression, so the corresponding accompanying rate might differ. Therefore, accompanying rate might need to be grouped according to these factors in the calculation.
For example, assume a traffic section connected specialized department A and examination department B. Its “q” value was obtained as “X,” and the accompanying rate of specialized department A (with corresponding time and location) was “Y.” Then, according to EquationEquations (2)(2)
(2) and (Equation3
(3)
(3) ), the “Q” value of this traffic section should be “X + X * Y.” Additionally, as existing research on accompanying rates ignores these differences, they were investigated further in this study.
2. Materials and methods
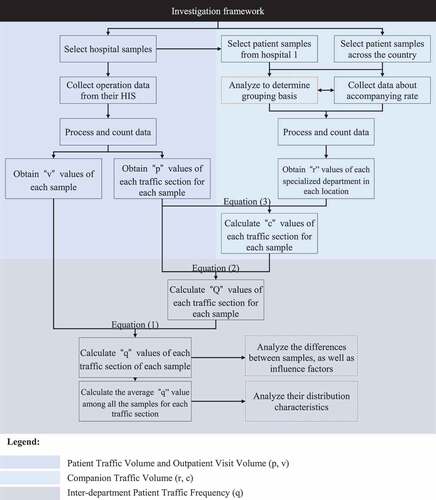
We conducted this investigation as follows ():
Figure 4. The framework of this investigation Figure 4 The framework of this investigation.
None of the authors had access to identifiable patient information, and the patient transfer data analyzed in this study were exported from hospitals without any identifiable information. Additionally, the transferred dataset contained no potentially identifiable information.
2.1. Patient traffic volume (p) and outpatient visit volume (v)
In this section, “patient traffic volume” is the annual traffic volume generated by patients, or the “p” value in Equationequations (2)(2)
(2) and (Equation3
(3)
(3) ), while the “outpatient visit volume” is the annual number of hospital outpatient visits, or the “v” value in Equationequation (1)
(1)
(1) . The corresponding investigation steps are illustrated in .
Figure 5. The investigation framework for patient traffic volume and outpatient visit volume.
Although a previous similar study sampled data from only one hospital over six weeks (Delon and Smalley Citation1970), we expected larger sample size. Based on the reasons from , we identified four large general hospital samples according to location, annual outpatient visits, and the number of beds, and they agreed to participate in the study by providing informed consent. Then, data covered one year were collected successfully in three while abortively in one. The three valid hospital samples still met the above requirements, and their basic information is presented in and . According to site observations combined with information from their official websites, the three hospitals’ outpatient medical flow and department settings were all typical (, ).
Figure 6. Intermediate floor plans of the outpatient buildings of the three samples.
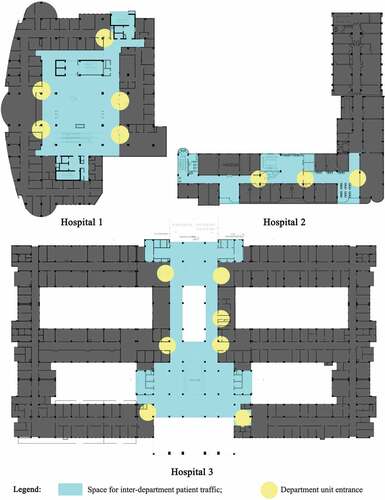
Table 4. Factors considered in the selection of hospital samples in this study.
Table 5. Basic information of “general hospital” samples.
Previous studies collected data mainly by manual field recording of each traveler’s origin and destination (Pelletier and Thompson Citation1960; Delon and Smalley Citation1970). Due to its deficiencies mentioned above, instead, we used existing data which could be found in most Chinese hospitals to remove the manual data collection work, so the method can be used in most cases and extends the time coverage of data.
Driven by China’s medical policies, the hospital information system (HIS) is widely used in Chinese general hospitals to record basic patient visit information (Hu Citation2013) with similar forms and contents to meet the above requirements, which was confirmed in the three samples. Among the HIS data, the patients’ medical/charge records, indicating the correspondence between patients’ origin and destination departments, could reflect patient flow and be used to predict the number of corresponding patient trips (). Similar ideas have been used in hospital management studies (Carrara, Kalay, and Novembri Citation1986; Eastman and Siabiris Citation1995; Ekholm and Fridqvist Citation1996; Simeone and Kalay Citation2012; Bean, Taylor, and Dobson Citation2019). Therefore, we obtained relevant data from the three hospitals’ HISs ().
Table 6. Use of HIS data in this study.
Table 7. Types of data collected from the three samples
From , the basic forms of the three samples’ original data were the same, and thus, their processing of calculating the “v” and “q” values from the raw files was similar. The details were collated in and , citing Hospital 1 as an example.
Table 8. Calculation of “v” and “q” values from hospital 1ʹs raw files of HIS data.
Table 9. Data pretreating for patient traffic volume investigation of hospital 1.
Thus, we determined the annual outpatient visit volume of each sample, which was used as the “v” values in Equationequation (1)(1)
(1) , and the patient traffic volume value of each traffic section separately, which were used as the “p” values in Equationequations (2)
(2)
(2) and (Equation3
(3)
(3) ).
2.2. Companion traffic volume (c)
The “Companion Traffic Volume” was generated by patient companions, and the investigation steps are illustrated in .
Figure 7. The investigation framework for companion traffic volume.
Based on Equationequation (3)(3)
(3) , accompanying rate was required other than the calculated “p” values. We verified whether “visit time (morning/afternoon)” and “location (west/middle/east China)” were the basis for grouping and then calculated the results. The investigation was divided into three stages: 1) As “visit time” was likely to be less influential than “location”, we first analyzed the influence of “visit time” and “specialized department” on accompanying rate using the two-factor variance method; 2) from the stage 1 results, we further analyzed that of “location” and “specialized department” in the same way; and 3) grouped the samples from the above analysis and calculated the accompanying average rates within each group, which were used as the “r” values in Equationequation (3)
(3)
(3) .
In this process, the patient samples were obtained from three sources: on-site observations, on-site questionnaire surveys, and online questionnaire surveys, as illustrated in and . Accordingly, combined with the research needs of each stage, we selected the patient samples.
Figure 8. Questionnaire design for the accompanying rate.
Table 10. Details of the three patient sample sources.
In stage 1, sample information on “time” and “specialized department” was required, so on-site observations were appropriate. Then, we used G*Power to calculate the sample size and got the result of “448.” After making a 20–30% upward float, we collected 580 patient samples at Hospital 1, of which 570 were valid. In stage 2, samples’ location coverage as wide as possible were required without “time” information, so on-site and online questionnaire surveys were both appropriate. They alternated to balance the sample distribution and expand the sample size. The requirements for samples in stage 3 were the same as stage 2, albeit the different purposes, so the samples could be shared. Therefore, we determined the sample size of stages 2 and 3 according to the higher value of their requirements, which was the stage 3 sample size. It was calculated according to the statistical formula, and the result was 1485, which was considered the minimum standard. Within the planned time, we tried to expand the sample size and balance the sample distribution. Totally, 2470 samples were obtained, of which 2443 were valid. Their distributions are illustrated in .
Table 11. Basic information of “patient” samples.
For each traffic section, we substituted its “p” value and the “r” value corresponding to its “location” and “specialized department” into Equationequation (3)(3)
(3) to calculate its companion traffic volume, which was the “c” value in Equationequation (2)
(2)
(2) .
2.3. Inter-department patient traffic frequency (q)
For each traffic section separately, we substituted the “p” and “c” values into Equationequation (2)(2)
(2) to calculate its annual patient traffic volume (Q). Then, each traffic section’s “Q” value and corresponding “v” value were substituted into Equationequation (1)
(1)
(1) separately to calculate its inter-department patient traffic frequency (q). For each hospital sample, the set of its traffic sections’ “q” values represented its spatial distribution of the patient traffic volume. Finally, we calculated the average “q” value set.
On this basis, we further analyzed their spatial distribution characteristics through the average value set, identified their differences among hospital samples, and clarified the influencing factors other than the “traffic section” through each “q” values ().
Table 12. Methods used in the analysis of the inter-department outpatient traffic frequency results.
3. Results
3.1. Accompanying rate
The statistical characteristics of patient samples’ accompanying rates are illustrated in .
Table 13. Statistical characteristics of patient samples’ accompanying rate.
For stage 1, a two-factor ANOVA result is illustrated in , in which the P-value (Sig.) of “specialized department” was “0.000” < 0.05, indicating that it had a significant impact on the “accompanying rate,” while the P-value (Sig.) of “visit time” was “0.090” > 0.05, indicating that it had no significant impact on the “accompanying rate.” In other words, the “visit time (morning/afternoon)” could be disregarded in the grouping.
Table 14. Analysis result of the factors of “department” and “time” on accompanying rate by Two-factor ANOVA (exported from SPSS analysis).
For stage 2, the results of the two-factor ANOVA are illustrated in , in which the P-value (Sig.) of “specialized department” and “location” were both “0.000” < 0.05, indicating that they both had significant impacts on the “accompanying rate.” In other words, “department” and “location” should be considered the grouping standards.
Table 15. Analysis result of the factors of “specialized department” and “location” on accompanying rate by Two-factor ANOVA (exported from SPSS analysis).
Finally, in stage 3, we obtained the results of the accompanying rate grouping by their “specialized department” and “location” as follows (), which would be used as the “r” values in Equationequation (3)(3)
(3) .
Table 16. Accompanying rate of each department and location.
3.2. Inter-department patient traffic frequency
The inter-department patient traffic frequency (q) values for each traffic section in each hospital sample and their average values are illustrated in .
Table 17. Results of inter-department patient traffic frequency.
Based on the “q” values of hospitals 1, 2, and 3 in , the coefficients of variation for each traffic section among samples are illustrated in , which were between 6.07% and 141.42%, indicating “q” values differed among hospitals. Therefore, we ranked the traffic sections within each hospital sample by their “q” values and calculated the coefficients of variation of each traffic section’s rankings among the three hospitals. Then, we ranked the 150 traffic sections according to their coefficients of variation. The results are listed in , in which there were only 15 traffic sections with coefficients of variation greater than 50%.
Table 18. Coefficients of variation of each traffic’s inter-department patient traffic frequency among the three samples (%).
Table 19. Results of sorting traffic sections by coefficients of variation of their “sequence number” among the three samples.
Based on the “average values” in , we ranked the traffic section’s “q” values (). The mean value, standard deviation, and coefficients of variation of these “q” values were 0.0361, 0.0688, and 190.77 %, respectively, indicating that they were highly discrete. Out of 150 traffic sections, 38 traffic sections, 11 traffic sections, and four traffic sections accounted for approximately 90%, 50%, and 25% of the patient traffic volume, respectively.
Table 20. Results of ranking traffic sections by patient traffic frequency values.
According to , grouping by their public (registration) departments, four traffic sections accounted for more than 50% of “q” values within the group: [Endoscopy–Internal Medicine], [TCM Pharmacy–TCM], [Ambulatory Surgery–Obstetrics & Gynecology], and [ECG & EEG–Internal Medicine]. This indicated that the related four public department units presented clear directivity.
Table 21. Traffic section with the highest “q” value within each group and their “q” value proportions within the group (grouping all traffic sections by public/support department).
To understand the effect of “location,” “number of beds in the hospital,” and “outpatient visit scale” on the “q” values, we performed a univariate ANOVA and a correlation analysis on the “q” values of each hospital sample (illustrated in A)–C)). The results are illustrated in , respectively.
Table 22. Analysis result of the factor of “location (west/middle/east China)” on patient traffic frequency by univariate ANOVA (exported from SPSS analysis).
Table 23. Analysis result of the correlation among “annual outpatient visits,” “patient traffic frequency,” and “number of beds” (exported from SPSS analysis).
In , the P-value (Sig.) of the location was “0.041” < 0.05, indicating that it had a significant impact on “q” values. However, as there was only one sample in each “location” group, this impact needed further confirmation. In , the P-value (Sig.) between patient traffic frequency and outpatient patient visit scale was “0.818” > 0.05, the P-value (Sig.) between patient traffic frequency and the number of beds was “0.225” > 0.05, indicating that both had no significant correlation. The P-value (Sig.) between outpatient visits and the number of beds was “0.000” < 0.05, indicating a significant correlation.
4. Discussion
Patient traffic distribution is affected by many factors, such as medical flow, the proportion of patients with different diseases, and their preference for diagnosis and treatment mode (Wanyenze et al. Citation2010; Yang and Guo Citation2013; Palmer, Fulop, and Utley Citation2018; Dhar, Michel, and Kanna Citation2011). These factors are mainly determined by policies, management, and medical philosophy (Wanyenze et al. Citation2010; Belson, Scott, and Overton Citation2010; Vilkko et al. Citation2021). In China, large general hospitals are generally similar in these aspects; hence, their outpatient traffic distribution is also similar, but with some differences.
4.1. General characteristics
According to the average “q” values illustrated in and , most patient traffic was concentrated between a few department units: [Registration–Internal Medicine], [Pharmacy–Internal Medicine], [Registration–Pediatrics], [Registration–Emergency], [Clinical Lab–Obstetrics & Gynecology], [Registration–Surgery], [Pharmacy–Pediatrics], [Registration–Obstetrics & Gynecology], [Clinical Lab–Emergency], [Clinical Lab–Pediatrics], and [Clinical Lab–Internal Medicine], accounting for approximately 50% of outpatient traffic.
Among the above department units, the registration unit was the first station all outpatients had to visit in the outpatient medical flow (), which attracted a lot of outpatient traffic. As most outpatient treatments require patients to take medications, pharmacy units are visited the most frequently among treatment public departments. Similarly, examination reports from clinical labs are the main auxiliary basis for the diagnosis; therefore, clinical labs were visited the most frequently among the examination public departments. Meanwhile, the specialized departments of internal medicine, surgery, pediatrics, emergency, and obstetrics & gynecology are the most frequently visited according to China’s official statistics (National Health Commission of the People’s Republic of China Citation2019), which also attracted a lot of outpatient traffic.
A public (or registration) department unit with more than 50% of its outpatients coming from the same specialized department unit was considered clear directivity in this study. It reflects the spatial distribution of public departments’ service objects. According to , four public department units presented clear directivity: [TCM Pharmacy–TCM], [Ambulatory Surgery–Obstetrics & Gynecology], [ECG & EEG–Internal Medicine], and [Endoscopy–Internal Medicine]. This demonstrates that, based on the treatment characteristics of different diseases, the above public departments mainly served corresponding specialized departments.
Compared with Luo’s (Citation2009, 21) study (), the distribution characteristics of traffic frequency between specialized and public departments presented in this study () were similar by visual observation. As the “specialized departments” in were inpatient while in were outpatient, this indicated that the distribution of inter-department patient traffic volume was largely determined by the composition of different diseases in the population and the common treatment methods, which were similar in outpatient and inpatient departments in China.
4.2. Differences and variations
According to , the spatial distribution of outpatient traffic volume was roughly similar but varied slightly across the hospitals to an extent. Each traffic section’s “coefficients of variation” in reflected the difference of the patient traffic distribution among hospitals. Considering the sample size, the traffic sections with the coefficients of variation greater than 50% were considered significantly different among hospitals. In this way, only 15 out of 150 traffic sections demonstrated significant differences, which included [Pharmacy–Internal Medicine], [Clinical Lab–Physical Examination Center], [Registration–Internal Medicine], [Ultrasonography–Obstetrics & Gynecology], [Pharmacy–TCM], [Registration–TCM], [Pharmacy–Stomatology], [Radiology–Emergency], [Ambulatory Surgery–Obstetrics & Gynecology], [Clinical Lab–Emergency], [Ultrasonography–Emergency], [Registration–Pediatrics], [Registration–Surgery], [Registration–Obstetrics & Gynecology], and [Pharmacy–Emergency].
In the above traffic sections, public departments of pharmacy and clinical lab appeared most frequently. Although oral medication and examination reports from clinical labs were the most popular treatment methods and diagnosis bases, the probability of using these two varied greatly among hospitals based on their doctors’ work preferences, hospital operations, and equipment. Meantime, the specialized departments of emergency and internal medicine appeared the most frequently. This might be due to the large variation in their proportion in outpatient visits among the hospitals.
According to , location (west/middle/east China) might be the main factor contributing to the above differences. However, as the sample size was limited, this result was not yet conclusive. According to , the annual outpatient visit scale and number of beds in a hospital were proven to have no significant effect on the spatial distribution of outpatient traffic frequency. This demonstrated that the influence of these two factors through “other ways” could be ignored, which was supposed in the hospital sample selection (). Meanwhile, eliminating the influence of the outpatient visit scale in Equationequation (1)(1)
(1) was feasible. Additionally, the number of beds significantly correlated with the number of outpatient visits, which was due to the potential associations between these two. The ratio of the outpatient visits and number of beds was mentioned as the “visits-beds ratio” in medical management, which was considered a reasonable value of 3:1 (National Health Commission of the People’s Republic of China Citation2021).
4.3. Reproducibility of methods
In addition to providing the above direct general evidence, to further support case-specific evidence obtaining, the reproducibility and convenience of the methods were considered. As the accompanying rate is not affected by individual hospital related factors, which does not have to be case-specific, and the method’s reproducibility was primarily considered in “p” value investigation.
Firstly, due to the reasons stated in the Introduction, the of department unit types and main medical flows are the same among outpatient buildings of large Chinese general hospitals, which makes the theoretical model and definition established in this study applicable to most other similar outpatient buildings. Subsequently, we chose the existing hospital data as the research material and limited the data source to HIS, which almost all the hospitals in China use, so this method did not require too much additional data collection.
Among the operation records in HIS, the charge/medical records of patients in China all include “patient ID,” “time,” “billing department,” and “executing department,” which were used as mandatory information for calculating the traffic section “p” values and the hospital “v.” Therefore, the method we used to calculate “p” and “v” values, presented in , can also be extended to other cases. For the same reason, the data pre-medical processing method we used () can be replicated in other cases.
Furthermore, as the original materials used in this method are all digital, the data extraction, data processing, and calculating the “q” values according to Equationequations (1)(1)
(1) , (Equation2
(2)
(2) ), and (Equation3
(3)
(3) ) can be programmed into computer program scripts to further improve the convenience.
4.4. Implications for application
The “average values” presented in represent the general situation of the spatial distribution of patient traffic volume in China’s outpatient buildings, which can be used as direct evidence of outpatient buildings design in China without requiring highly precise results or without access to further information. However, for more precise and reliable results of a specific case, the differences among hospitals should be considered, and the “q” values of the specific case should be obtained. The investigation methods adopted in this study were considered as convenient and reproducible as possible so that they can be used. In the targeted investigation, the 15 traffic sections that exhibited significant differences were the most important.
Subsequently, there are two main principles in outpatient building design: 1) the higher the frequency of patient traffic between departments, the closer the traffic distance between them should be (Jiang Citation2005, 29), and 2) the higher a corridor bears patient traffic frequency (considering all traffic sections within it), the more spacious it should be (Jiang and Ge Citation2021).
The first was associated with the outpatient building layout. Consequently, the idea of “minimizing the average trip distance/time of staff” and “considering traffic frequency as the weight of the corresponding traffic section” were adopted in evaluating nursing unit efficiency in previous studies (Pelletier and Thompson Citation1960; Kobus et al. Citation2000, 138–139), which are also applicable to outpatient buildings. Moreover, at the city level, there are similar but more accurate quantitative evaluation methods, usually called accessibility evaluation. They measured the accessibility of city or regional networks based on travel costs (Yang et al. Citation2018; Silalahi et al. Citation2020), and their model can be applied to outpatient buildings with traffic frequency as the weight. Compared to Pelletier and Thompson’s study, they further described the road network through the OD matrix and incorporated more complex factors into the evaluation model (Jin et al. Citation2020). Therefore, outpatient buildings can be evaluated by their layout patterns (Shi et al. Citation2021).
To calculate the layout position of each department unit in the outpatient building, the quantitative models used in the facility’s location issues can serve as references (Yang and Guo Citation2013). For example, through a model for median-based problems (Ahmadi-Javid, Seyedi, and Syam Citation2017), layout results can be obtained to minimize the weighted average distance. Researchers are already using these models to calculate room layouts in emergency departments (Ma et al. Citation2016), in which the patient flow volume was also a basic parameter.
Another way to minimize the average trip distance/time in the outpatient building layout is splitting the public department with large patient visits and low directivity (such as clinical lab and radiology) into sub-departments, and setting them near specialized departments with frequent contact. This method has been applied in some constructions of large general hospitals in China (Su Citation2013); however, it could significantly increase the traffic burden of staff and take up more floor area. Therefore, it should be considered carefully before adoption.
The second principle is mainly associated with local space of corridor. Theoretically, the width of the corridor should be directly proportional to the traffic volume; however, the width of a corridor in an outpatient building is generally uniform in different parts, while it might be superimposed with different traffic sections; therefore, the traffic volume distribution is not uniform. Space might be wasted if corridor widths are designed to match the maximum traffic volume. Thus, in architectural design, the traffic volume of patients superimposed in different parts of the same corridor should be as uniform as possible, mainly determined by the types of departments in the corridor. Furthermore, for corridors whose width was greater than the traffic demand, rest areas, waiting areas, and other facilities could be set up to use the space fully.
5. Conclusion
In summary, based on the existing research, this study discussed the spatial distribution of patient traffic in outpatient buildings of large general hospitals in China by quantitatively describing the inter-department patient traffic frequencies within each pair of department units and defining “inter-department patient traffic frequency(q)” as the ratio of the annual number of patient trips passing through a traffic section (Q) to the annual number of outpatient visits of this outpatient building (v). Based on the theoretical model and investigating three hospital samples and 2443 patient samples, we obtained the “q” value set of each hospital sample and their average values among the three samples ().
By analyzing these data, we found that the spatial distribution of outpatient traffic volume in China was roughly similar, with two main characteristics: 1) outpatient traffic frequency was unevenly distributed in the outpatient building, and out of a total of 150 traffic sections, 38, 11, and four sections accounted for 90%, 50%, and 25% of the patient traffic, respectively (), and four public department units presented obvious directivity ().
However, the results varied slightly across the three hospital samples. Out of a total of 150 traffic sections, 15 presented significant differences in “q” value among the three samples, which could be generated by their location difference (), but more evidence is required. Furthermore, the outpatient visit scale and number of beds in hospital did not significantly affect the “difference” mentioned above (). Therefore, the results of this study support Chinese outpatient building design and research from two perspectives.
Without requiring highly precise results or access to further information, the above results, in particular , can be used as direct evidence. For more precise and reliable results in the design or research of a specific case, the method in this study, whose reproducibility and convenience of operation were fully considered, can be used to support the targeted investigation of the special distribution of patient volume in specific cases.
The “q” value set can be used to evaluate the functional efficiency of the building layout and accurately calculate the location and layout of outpatient department units and corridor width. Relevant studies in urban and rural planning and geography can also be used as references for the calculation model.
In terms of limitations, we obtained only three hospital samples on the premise of meeting the requirements mentioned above, which made it impossible to analyze the influence of location factors on the results fully. As there was no direct impact on the results of this study, we did not discuss the medical flow branch mentioned in the Introduction, which reduced the replicability of the method in this study to some extent. The main purpose of this study was to provide evidence for the architectural design, so we did not present details on how to use them in the design. The results of this study mainly support the design and research in terms of transportation efficiency; however, efficiency is not the only goal, and equity issues need to be considered simultaneously. These limitations will be further addressed in follow-up research.
Acknowledgments
The authors would like to express their gratitude to Dr. Long Hao, Professor at the School of Architecture and Urban Planning, Chongqing University, for his assistance in organizing the participation of hospitals 1 and 3 in this study. The authors also thank the reviewers for their valuable comments and suggestions.
Disclosure statement
No potential conflict of interest was reported by the author(s).
Data availability statement
Due to the nature of this research, participants of this study did not agree for their data to be shared publicly, so supporting data is not available.
Correction Statement
This article has been republished with minor changes. These changes do not impact the academic content of the article.
Additional information
Funding
Notes on contributors
Malu Zhang
Malu Zhang received the PH.D. degree in Architecture from Chongqing University, Chongqing, China in 2019. She is currently a lecturer at Zhejiang University of Technology, Hangzhou, China. Her main research area is medical building design.
Ning Yang
Ning Yang received the PH.D. degree in Urban and Rural Planning from Chongqing University, Chongqing, China in 2020. He is currently a lecturer at Zhejiang University of Technology, Hangzhou, China. His research interests include healthy urban design and urban planning, etc..
Notes
1 In Bai’s study (Bai Citation2011), “organization efficiency” was used to evaluate the spatial interrelations among units in the contribution to the overall function of hospital buildings.
2 MPA: Medical Planning Associates. BTA: Bobrow/Thomas & Associates.
3 According to the China Health Statistical Yearbook 2019, in 2018, 2263 of China’s large hospitals (Grade 3 hospitals) were public, while only 285 were not.
References
- Ahmadi-Javid, A., P. Seyedi, and S. S. Syam. 2017. “A Survey of Healthcare Facility Location.” Computers & Operations Research 79: 223–263.
- Bai, X. (2011). Research on Function Efficiency of Hospital Space System [ Unpublished master’s thesis]. Harbin Institute of Technology.
- Bean, D., P. Taylor, and R. J. Dobson. 2019. “A Patient Flow Simulator for Healthcare Management Education.” BMJ Simulation and Technology Enhanced Learning 5 (1): 46–48. doi:10.1136/bmjstel-2017-000251.
- Belson, D., M. Scott, and L. Overton. 2010. Improving Efficiency in the Safety Net: Management Engineering Practice and Cases. California: California Healthcare Foundation.
- Cai, H., and C. Zimring. 2019. “Cultural Impacts on Nursing Unit Design: A Comparative Study on Chinese Nursing Unit Typologies and Their US Counterparts Using Space Syntax.” Environment and Planning. B, Urban Analytics and City Science 46 (3): 573–594. doi:10.1177/2399808317715639.
- Carrara, G., Y. Kalay, and G. Novembri (1986). “KAAD: Knowledge-based Assistance for Architectural Design.“ the 4th eCAADe Conference, Rome, Italy, 202–212 .
- Delon, G. L., and H. E. Smalley. 1970. “A Stochastic Model for inter-departmental Traffic.” Health Services Research 5 (3): 196–209.
- Dhar, S., R. Michel, and B. Kanna. 2011. “Improving Visit Cycle Time Using Patient Flow Analysis in a high-volume inner-city hospital-based Ambulatory Clinic Serving Minority New Yorkers.” Journal for Healthcare Quality 33 (2): 23–28. doi:10.1111/j.1945-1474.2010.00111.x.
- Eastman, C. M., and A. Siabiris. 1995. “A Generic Building Product Model Incorporating Building Type Information.” Automation in Construction 3 (4): 283–304. doi:10.1016/0926-5805(94)00028-L.
- Ekholm, A., and S. Fridqvist (1996) .“Modelling of user organizations, buildings and spaces for the design process. “ 1996 CIB Proceedings, Bled, Slovenia, 165–178 .
- Hamilton, D. K. 2004. “Hypothesis and Measurement: Essential Steps Defining evidence-based Design.” Healthcare Design 4: 43–46.
- Hu, X. (2013). Study and design on a HIS system based on multi-branch general hospital [ Unpublished master’s thesis]. Zhejiang University of Technology.
- Hu, L. (2016). Study on renovation and extension of existing county general hospital outpatient building based on organic update [ Unpublished master’s thesis]. Chongqing University.
- Jiang, L. (2005). Systematized research on route and space design of outpatient department in large-scale general hospitals. [ Unpublished master’s thesis]. Beijing University of Technology.
- Jiang, L., and T. Ge. 2021. “Research on Optimal Design of Patient Experience in Outpatient Building of Comprehensive Hospital.” Urbanism and Architecture 02: 122–124.
- Jin, S., J. Yang, E. Wang, and J. Liu. 2020. “The Influence of high-speed Rail on ice–snow Tourism in Northeastern China.” Tourism Management (1982) 78: 104070. doi:10.1016/j.tourman.2019.104070.
- Kobus, R., R. Skaggs, M. Bobrow, J. Thomas, and T. Payette. 2000. Building Type Basics for Healthcare Facilities. New York: Wiley.
- Long, H., and Y. Kuang. 2014. “The New Trend of Ward Design Based on evidence-based Design Theory: A Case Study of University Medical Center of Princeton.” Urbanism and Architecture 22: 28–31.
- Long, H., M. Zhang, and L. Ma. 2016. “A Preliminary Study on the Design Strategy for Vertical Circulation of the Outpatient Building in General Hospitals.” Architectural Journal 02: 56–60.
- Luo, Y. 2009. Modern Hospital Building Design. Beijing: China Building Industry Press.
- Ma, Y., X. Zuo, X. Huang, F. Gu, C. Wang, and X. Zhao (2016). “A MOEA/D Based Approach for Hospital Department Layout Design.” IEEE Congress on Evolutionary Computation (CEC), Vancouver, Canada, 793–798.
- National Bureau of Statistics of China. (2011, June 13). “The Division of Eastern, Western, Central, and Northeastern Regions.” The official website of the National Bureau of Statistics of China. http://www.stats.gov.cn/ztjc/zthd/sjtjr/dejtjkfr/tjkp/201106/t20110613_71947.htm
- National Health Commission of the People’s Republic of China. (Ed) 1989. The Measures for the Administration of the Hospital Grades .1989ed. Beijing: People’s Medical Publishing House .
- National Health Commission of the People’s Republic of China .(Ed) 2016. Medical Service Capacity Guide for Tertiary General Hospitals. 2016 ed. Beijing: People’s Medical Publishing House.
- National Health Commission of the People’s Republic of China. (Ed) 2019. China Health Statistical Yearbook 2019. Beijing: Peking Union Medical College Press.
- National Health Commission of the People’s Republic of China. (Ed) 2021. General Hospital Construction Standards (Construction Standards 110–2021). Beijing: China Planning Press.
- Palmer, R., N. Fulop, and M. Utley. 2018. “A Systematic Literature Review of Operational Research Methods for Modelling Patient Flow and Outcomes within Community Healthcare and Other Settings.” Health Systems 7 (1): 29–50. doi:10.1057/s41306-017-0024-9.
- Parente, D. H., M. B. Pinto, and J. C. Barber. 2005. “A pre-post Comparison of Service Operational Efficiency and Patient Satisfaction under Open Access Scheduling.” Health Care Management Review 30 (3): 220–228. doi:10.1097/00004010-200507000-00006.
- Pelletier, R. J., and J. D. Thompson. 1960. “Yale Index Measures Design Efficiency.” Modern Hospital 95: 73–77.
- Shi, Y., Z. Yan, C. Li, and C. Li. 2021. “Energy Consumption and Building Layouts of Public Hospital Buildings: A Survey of 30 Buildings in the Cold Region of China.” Sustainable Cities and Society 74: 103247. doi:10.1016/j.scs.2021.103247.
- Silalahi, F. E. S., F. Hidayat, R. S. Dewi, N. Purwono, and N. Oktaviani. 2020. “GIS-based Approaches on the Accessibility of Referral Hospital Using Network Analysis and the Spatial Distribution Model of the Spreading Case of COVID-19 in Jakarta, Indonesia.” BMC Health Services Research 20 (1): 1053. doi:10.1186/s12913-020-05896-x.
- Simeone, D., and Y. E. Kalay (2012). “An event-based model to simulate human behaviour in built environments. “ Proceedings of the 30th eCAADe Conference ,Prague, CZECH REPUBLIC, 525–532.
- Su, Y. 2013. “Analysis on Architectural Space Frame System and Operation Efficiency of Hospitals in China.” Urbanism and Architecture 9: 35–37.
- Tzortzopoulos, P., R. Codinhoto, M. Kagioglou, J. Rooke, and L. Koskela. 2009. “Design for Operational Efficiency: The Case Study of a Hospital Redevelopment.” HaCIRIC 2009: 66.
- Ulrich, R. S. 1984. “View through a Window May Influence Recovery from Surgery.” Science 224 (4647): 420–421. doi:10.1126/science.6143402.
- Ulrich, R. S. 2006. “Essay: Evidence-based health-care Architecture.” The Lancet 368: S38–S39. doi:10.1016/S0140-6736(06)69921-2.
- Vilkko, R., S. Räisänen, M. Gissler, V. Stefanovic, and S. Heinonen. 2021. “Daily Patient Flow Unevenness in Different Sized Delivery Hospitals – An 11-year Register Study of 610 227 Deliveries.” European Journal of Obstetrics & Gynecology and Reproductive Biology 266: 187–190. doi:10.1016/j.ejogrb.2021.09.007.
- Vos, L., S. Groothuis, and G. G. van Merode. 2007. “Evaluating Hospital Design from an Operations Management Perspective.” Health Care Management Science 10 (4): 357–364. doi:10.1007/s10729-007-9034-7.
- Wanyenze, R. K., G. Wagner, S. Alamo, G. Amanyire, J. Ouma, D. Kwarisima, P. Sunday, F. Wabwire-Mangen, and M. Kamya. 2010. “Evaluation of the Efficiency of Patient Flow at Three HIV Clinics in Uganda.” Aids Patient Care and STDs 24 (7): 441–446. doi:10.1089/apc.2009.0328.
- Yang, L., and D. Guo (2013). “Advance on Control and Management of Internal Transport System for large-scale General Hospital Buildings.” IEEE International Conference on Service Operations & Logistics, Dongguan, China, 119–123 .
- Yang, J., Y. Bao, Y. Zhang, X. Li, and Q. Ge. 2018. “Impact of Accessibility on Housing Prices in Dalian City of China Based on a Geographically Weighted Regression Model.” Chinese Geographical Science 28 (3): 505–515. doi:10.1007/s11769-018-0954-6.
- Zadeh, R. S., M. M. Shepley, and L. T. Waggener. 2012. “Rethinking Efficiency in Acute Care Nursing Units: Analyzing Nursing Unit Layouts for Improved Spatial Flow.” Herd 6 (1): 39–65. doi:10.1177/193758671200600103.
- Zhang, M. (2013). Study on vertical traffic system’s design for outpatient and emergency building of large-scale general hospital [ Unpublished master’s thesis]. Chongqing University.
- Zhang, M. (2019). Integrated efficiency of large-scale general hospital building: theory construction and quantitative mechanism study [ Unpublished doctoral dissertation]. Chongqing University.