
ABSTRACT
A numerical research is conducted to clarify the unsteady airflow and pressure characteristics in the full-scale underground highway station to ensure the passenger safety and energy saving in Heating, ventilation and air-conditioning design. Results show pressure characteristics in the tunnel change greatly due to the propagations of compression and expansion waves. The propagations of compression and expansion waves determine the local pressures together. For the first two locations X = −900 m and X = −800 m, the pressure climbs to the peak when the head of the train reaches. However, for the other locations, the pressure is not the maximum when the train reaches, due to the effect of Initial Expansion Wave (IEW). With the raising of train speeds, the positive maximum velocities are increased by 32.60% and 47.58%, respectively. It should be noted that there are two peak values of horizontal velocities successively, with the train speed of 250 km/h and 300 km/h.
1. Introduction
High-speed railway plays an important role in a national economic growth. As an effective channel to exchange information and material, it could help to promote the entrepreneurial activities among various regions and improve inhabitants’ living quality. High-speed railway networks have been expanded continually around the world, especially in China, since Tokaido Shinkansen Line was built at 1964 (Zhang and Ma Citation2021). High-speed railway construction in China will be still in the high-speed development period in the next ten years according to Mid-Term and Long-term Railway Network Development Program. For example, eight vertical and eight horizontal high-speed railway network construction before 2030 has already been planned (Wang, Xia, and Zhang Citation2017).
As an important constituent of high-speed railway system, the station is always located far away from the downtown area and above the ground, considering the construction cost. Due to urban land tension in metropolis and specific geographic environment, underground highway station is becoming more and more popular, as shown in . Similar with subway system, the underground highway station is connected with the tunnel at both ends. Thus, the aerodynamic problem, such as piston wind and aerodynamic pressure, is inevitably involved, especially when the train speed is higher than 100 km/h (Raghunathan, Kim, and Setoguchi Citation2002).
Table 1. Summary of underground highway stations.
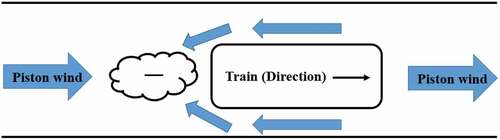
Piston effect could lead to the unsteady airflow in the underground station, which is responsible for the passenger safety and energy saving in Heating, ventilation and air-conditioning (HVAC) design (López González et al. Citation2014). As illustrated in , piston wind is generated in the tunnel due to the high-speed train movement. Air exchange between the tunnel and the platform could occur through the door. This, of course, leads to the air movement in the station. It has been reported that airflow velocity larger than 5 m/s and 8 m/s will make passengers feel uncomfortable and unpleasant, respectively, and “Blowing over” airflow velocity is about 15–20 m/s (Melbourne Citation1978). HVAC system is necessary to be equipped to create a comfortable environment for passengers and consumes large amount of electricity due to the scales of stations and passengers. Considering the environmental differences between station and tunnel, Piston effect, which could promote the air exchange between them, will have a great influence on the energy consumptions of HVAC. The effect of piston wind on the energy consumption has been studied widely (Liu et al. Citation2019; Fu, Wei, and Zhao Citation2019; Yang et al. Citation2015; He et al. Citation2021; Yu et al. Citation2021; Ma et al. Citation2018; Zhang et al. Citation2017; Zhang and Li Citation2021; Zhang et al. Citation2016). Air pollutant is also unavoidable for the environment and the tunnel. The air exchange among the outdoor, platform and tunnel will also pollute the air in the platform (Passi, Nagendra, and Maiya Citation2021; Targino et al. Citation2021). In fact, all issues on the safety, energy saving, comfort, air quality and even smoke movement in the platform is based on the airflow characteristics due to piston effect. In addition, it could not be neglected that the aerodynamic pressure variation will also take place when the high-speed train is running in the tunnel and may cause damage to the equipment, structure and passengers (Raghunathan, Kim, and Setoguchi Citation2002; Zhou et al. Citation2021; Niu et al. Citation2020). Furthermore, the entrance or exit of train will create the tunnel pressure wave (Heine et al. Citation2019; Xiang et al. Citation2018), which shall change the pressure distribution in the tunnel and station. Additional noise (Lü et al. Citation2018) may be generated by the above effect and do harm to the comforts and safety of passengers. Thus, it is necessary to understand the unsteady airflow and pressure characteristics in an underground highway station well, for the safety and energy-saving sakes during the operation of stations.
Figure 1. The characteristics of piston wind due to the train moving.
Research on piston airflows in the tunnel were discussed widely in the previous work (Liu et al. Citation2020; Li et al. Citation2020; Wang et al. Citation2020; Xue et al. Citation2014). Piston airflow characteristic and its influencing factors have been made clear experimentally and numerically. Theory models have also been built for single and multiple trains. Subway Environment Simulation (SES) and Subway thermal environment simulation software (STESS) have also been developed as the computation tools and are widely used to analyze the piston airflow characteristics (Wang and Li Citation2018; D. O. USA, Citation1997). Based on the research above, the effect of piston airflow on the airflow characteristics in the subway station has been well understood. For example, Jiajia Wang et al. discussed particulate matter (PM) concentrations in Shanghai subway station due to the piston effect (Wang et al. Citation2016). Guoqing Li et al. developed an innovative energy-saving ventilation system to meet the load demand with piston airflow (Li et al. Citation2020). A.M. Krasyuk explored air distribution in a terminal subway station at various train speeds (Krasyuk, Lugin, and Pavlov Citation2019). Moreover, variations of train speed (Zhou et al. Citation2021) and tunnel size (Ko et al. Citation2012) will change the propagation of pressure waves in the tunnel. For aerodynamic pressure problem, much related papers could also been discovered (Zhou et al. Citation2021; Niu et al. Citation2020; Liang et al. Citation2020; Niu et al. Citation2018; Yuan, Zhou, and Meng Citation2019). These researches are helpful for standard formulation of subway stations, but they could not be used in the design of the underground stations, since there are large differences in maximum design speeds (about 100 km/h vs 350 km/h), platform gate formats (platform screen door (PSD) vs half-height/without PSD), station scales (small scale vs large scale), etc. Thus, it is necessary to conduct the research on the unsteady airflow and pressure characteristics in an underground highway station. However, less research work has been conducted on the full-scale underground highway station.
The present work is to analyze unsteady airflow and pressure characteristics in the full-scale underground highway station with the train passing. This paper is organized as follows: Section 2 describes the setup and validation of the numerical method; the results on the airflow due to piston wind and thermal pressure are shown in Section 3; then, the conclusion is given in Section 4.
2. CFD setup and validation
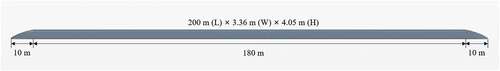
In the present work, geometry model of a typical underground highway station is shown in . The station is located at 102 m below ground and mainly composed of tunnel, rescue shaft, platform, hall and passageway connecting platform and hall. Platform, with the size of 450m*9m*1.25m, connects the tunnel, rescue shaft and passageways. Length and area of the tunnel are 12 km and 145 m2, respectively, and half-height PSD is installed at the edge of the platform. CR400AF high-speed train travels in the tunnel with 200 km/h, 250 km/h and 300 km/h and the configuration of CR400AF high-speed train is illustrated in . The total length of the train is 200 m. The height and width of CR400AF are 4.05 m and 3.36 m, respectively. The cross-sectional area of the train is 13.61 m2 and the blockage ratio for a train is 18.57%.
Figure 2. The configuration of the high-speed train.
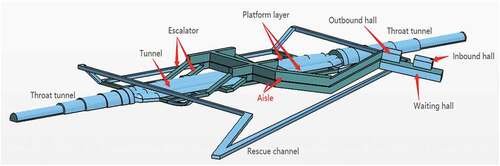
Figure 3. Geometry model of a typical underground highway station.
For simplicity and considering the computation cost, some assumptions have been made as the following:
Equipment rooms and bathrooms are omitted in the building of physical model of the present station.
Electric Cables Bridge frames, advertisement and indicator signs are omitted in the tunnel for simplicity.
Train bogies, pantograph dome and inner arrangement of the high-speed train are also not considered.
The train passes through the station with an uniform speed.
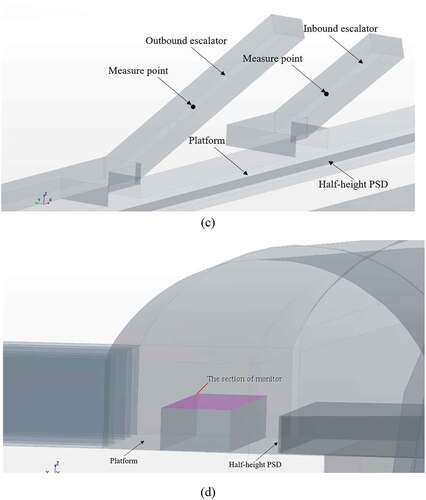
The total length of the tunnel is 1776 m in the simulation. In order to analyze the airflow and pressure characteristics in the tunnel, 12 measure points (y = 5.6 m; z = 4.0 m; x = −900 m, −800 m, −700 m, −600 m, −500 m, −400 m, 0 m, 400 m, 500 m, 600 m, 700 m, 750 m) are selected, and the distances between the entrance of the tunnel are 67 m, 167 m, 267 m, 367 m, 467 m, 567 m, 967 m, 1367 m, 1467 m, 1567 m, 1667 m, 1717 m, respectively. In addition, six measure points with the symmetrical distances are located at the safety line on the platform. Heights of these measure points are 1.7 m above the ground G Citation1995. The locations of measure points on the tunnel wall are depicted in . In , the coordinate x = 0 m indicates the center mileages of the highway station (origin of coordinates). shows locations of measure points in the inbound and outbound escalator, and depicts the average wind velocity monitoring section.
Figure 4. Measure points in the tunnel. (a) The locations of measure points in the transverse section; (b) the locations of measure points in the cross-section; (c) the locations of measure points in the inbound and outbound escalator; (d) the average wind velocity monitoring section.
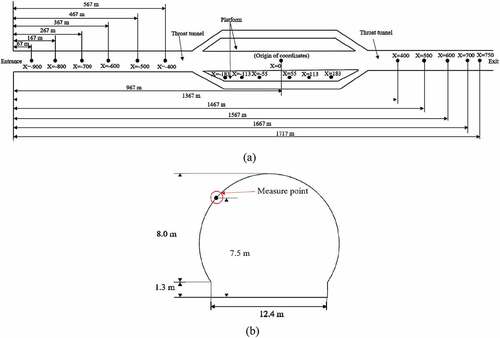
Figure 4. (Continued).
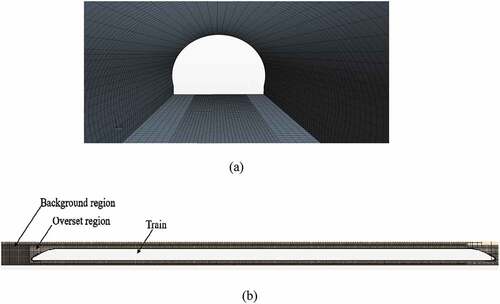
As shown in , two external areas with 300 m*120 m*60 m are added on the entrance and exit of the tunnel for the sake of full development of the flow fields. All the walls of the station are set as “Wall” boundary condition and “Pressure outlet” is used in the entrance and exit of the station. In order to reduce the computation cost, 600 m and 400 m tunnel sections on the two ends of stations are considered. Moreover, the train is initially located 50 m away from the entrance of the tunnel. As shown in , the overlapping grid technology is selected for numerical simulation to simulate the motion process of the train in the tunnel, which is more closer to the real physical process than previous studies.
Figure 5. The size of the computation domain.
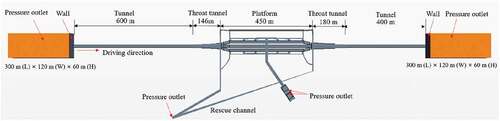
Figure 6. Computational grid. (a) Grids in the tunnel; (b) overset grid.
Commercial code STAR-CCM+ is used to simulate the airflow in the high-way station. Compared to incompressible fluids computational model, the change of the air volume in the tunnel will affect the accuracy of the calculation results. Therefore, compressible turbulent flow is the more optimal choice. A three-dimensional, unsteady and compressible turbulent flow is assumed for the calculation of airflow in the tunnel and station.
Realizable k-epsilon model is suitable for coarse meshes, with two-layer models for maximum mesh flexibility. Due to the large computation demand, realizable K-Epsilon two-layer turbulent model is employed and has been proven to be accurate enough in the calculation of aerodynamics (Zhou et al. Citation2021; Kuznetsov Citation2004).
To achieve fluid continuity, idea gas assumption is selected in the present work. Governing equations are solved with 3D segregated solver and first-order temporal discretization is employed as the temporal integration method. STAR-CCM+ offers two different acceleration and velocity approximations. The first-order backward Euler method roughly estimates the acceleration and velocity. The solution accuracy of the first-order temporal discretization is sufficient for the results. Convergence was assumed to occur when the relative residuals of all dependent variables were less than 10−4, and no significant change was observed in the velocity, turbulent kinetic energy, and pressure on specific locations around the building over hundreds of iterations.
In addition, two-layer all y+ wall treatment is utilized in the wall function. In order to simulate the train movement in the tunnel, the overlapping mesh technology is a suitable method to solve the relative motion in the calculation and has been employed to analyze the airflow in the tunnel (Meng et al. Citation2021).
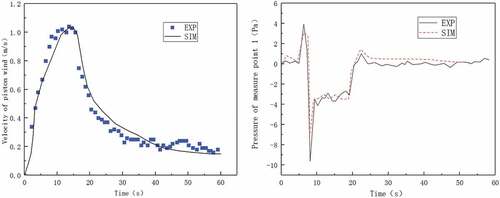
These models are verified with the model experiment (Kim and Kim Citation2007). As shown in (a), the total length of the subway tunnel model is 60 m and the blockage ratio is 0.47. The model train is initially 3 m away from the entrance of the tunnel. There are two velocity transducers and four pressure transducers equipped in the model tunnel, which aims to monitor the piston wind velocity and pressure. The first velocity transducer is 1.5 m away from the entrance and the other is 54.5 m away from the entrance. The four pressure transducers are placed at a distance of 7.5 m, 22.5 m, 37.5 m and 52.5 m away from the entrance. (b) shows the speed mode of the train. The measurement ranges of the velocity and pressure transducers are 0–30 m/s and 0–100 Pa, respectively. Meanwhile, the measurement accuracy of the velocity and pressure transducers are 0.01 m/s and 0.1 Pa, respectively. The data collection interval for all transducers is 0.1 s. As shown in , it could be discovered that the numerical method could well predict the airflow velocity and pressure due to the “piston airflow”.
Figure 7. Schematic diagram of the experimental setup (Kim and Kim Citation2007).
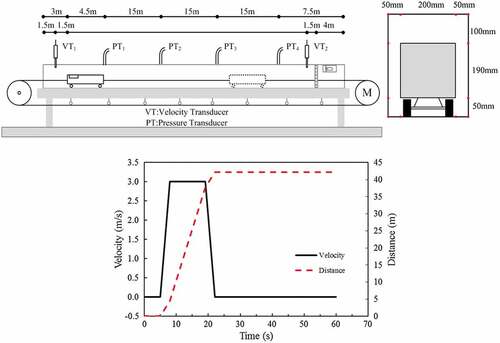
Figure 8. Comparisons of prison wind velocity and pressure between the calculated and experimental data (Kim and Kim Citation2007).
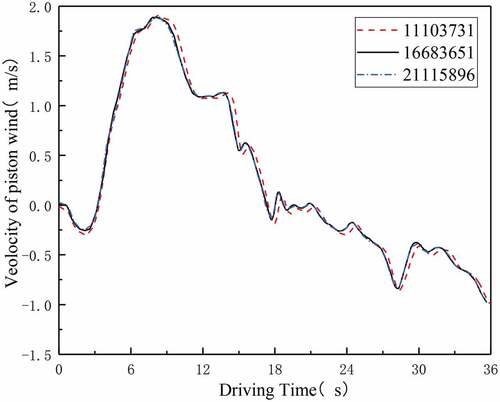
To confirm the grid independence of the simulation, three grid resolutions are generated with different cell number: (1) the coarse grid with 11,103,731 cells, (b) the basic grid with 16,683,651 cells, and (c) the finer grid with 21,115,896 cells, of which setting is shown in .
Table 2. Setting for grid independence analysis.
shows the comparison between piston wind velocity from these three grids, for which the underground station model is the Beijing-Zhangjiakou-Badaling high-speed railway and the train overtravel speed is 200 km/h. Comparing the wind speed at a measuring point of the incoming escalator, before the train enters the station tunnel, the peak wind speeds under grid 1, grid 2 and grid 3 are 1.91 m/s, 1.89 m/s, 1.87 m/s, respectively. The errors of 1 and grid 3 and grid 2 are 1.05% and −1.07%, respectively. Considering the limited computing resources, this paper selects the division method of grid 2.
Figure 9. Grid Independence. Velocity of the measuring point in inbound escalator.
3. Results and discussions
3.1. Pressure and wind characteristics in the tunnel
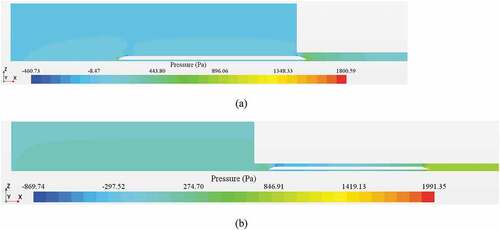
When the head of the train just enters into the tunnel entrance, as shown in , the tunnel wall restricts air flow around, and the air is compressed sharply. Due to the change in density, the pressure in the entrance increases drastically, forming an initial compression wave that propagates in the tunnel at sound speed. Then, most of the compression wave is reflected to the tunnel entrance and transformed into an expansion wave. Meanwhile, a small part of the compression wave turns into micro-pressure wave and leaves from the tunnel exit in the form of pulses. When the tail of the train begins to enter into the tunnel, as shown in , the air in the tunnel will flow into the negative pressure region generated at the tail of the train, through the annular space of the train body and the tunnel. At the same time, the air outside the tunnel also flows to the tail of the train and an expansion wave is formed. The expansion wave also propagates towards the tunnel exit at a speed of sound. When the pressure wave propagates in the tunnel, reflection and refraction will occur when it encounters a part with abrupt cross-section. When the expansion wave propagates to the head of the train, a part of the expansion wave continues to propagate toward the tunnel exit. The other part of the expansion wave is reflected to form a compression wave and propagate toward the tunnel entrance.
Figure 10. Pressure variations when the head and tail of the train begins to enter into the tunnel. (a) The head of the train enters into the entrance; (b) the tail of the train enters into the entrance.
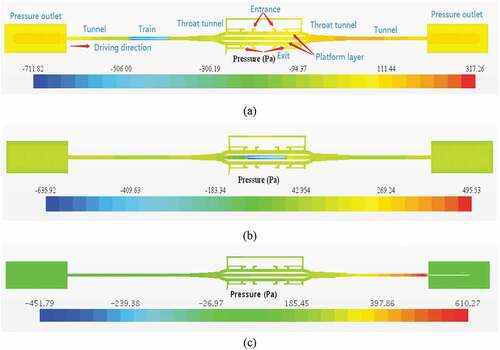
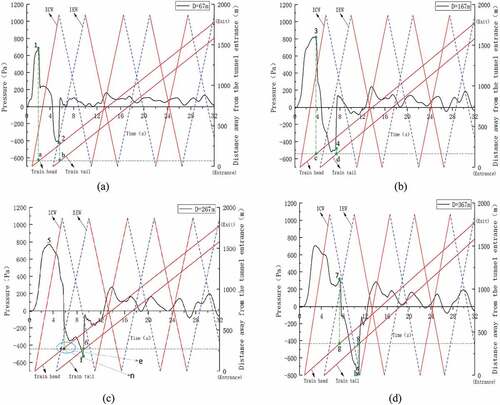
With the train passing the tunnel at three typical positons, the change of the pressure is not obvious as a whole. As shown in , when the head of the train is located at X = −468 m, the peak positive pressure at the front could reach 317.26 Pa, and the peak negative pressure at the tail of the train is −711.82 Pa. At this time, the pressures in other positions in the station and tunnel are not larger than 200 Pa. When the train travels through the first throat area to the middle tunnel of the station, as shown in , the peak positive pressure at the head of the train can reach 495.53 Pa, and the peak negative pressure at the tail of the train is −635.92 Pa. When the train leaves the station completely, as shown in , the peak positive pressure at the front of the train can reach 610.27 Pa, and the peak negative pressure at the tail of the train is −451.79 Pa. At this time, the pressure of the station increases, but does not exceed 250 Pa.
Figure 11. Pressure characteristics when the train is at three typical positons in the tunnel. (a) The head of the train is located at X = −468 m; (b) the head of the train is located at X = 91 m; (c) the head of the train is located at X = 1005 m.
present the variations of the pressures and velocities at X = −900 m, −800 m, −700 m, −600 m, 0 m, 600 m in the tunnel, when the train is passing at 200 km/h. It is obvious that the pressure variations trends of these measure points are similar. The head of the train enters into the tunnel and generates compression wave, which makes the pressure at the measure point rise sharply. While the body of the train goes through the measure point, the pressure will drop due to the negative pressure zone around the train body. As the tail of the train leaves the measure point, the pressure at the measure point rises rapidly. In general, the propagations of compression and expansion waves determine the local pressure of measure points together. It should be noted that there are still a little difference for measure points X = −900 m, −800 m and −700 m, −600 m. Take X = −900 m (67 m away from the entrance of the tunnel) for example; the pressure changes little when the train does not enter the tunnel. However, the pressure starts to rise due to the propagation of compressed wave if the head of the train enters the tunnel entrance. When Initial Compression Wave (ICW) propagates to the measure point, the pressure suddenly rises sharply. After 2.0 s, the pressure at the measure point reaches the peak value of 675.78 Pa when the head of the train reaches the measure point at location a. The pressure continues to drop with the head of the train leaving until the maximum negative pressure value of −413.14 Pa appears after the tail of the train passes through the measure point at location b. The difference between the positive and negative peak pressures is 1088.92 Pa. After the tail of the train leaves the measure point 1, the pressure rises rapidly. Finally, the pressure at the measure point fluctuates with the combined effects of the compression and the expansion waves in the tunnel. There are similar phenomenon for the measure point X = −800 m. The positive peak pressure still occurs when the head of the train reaches the measure point. The reason is the pressure is not affected by the Initial Expansion Wave (IEW) when the head of the train reaches the measure point. There is a little difference for measure points X = −700 m and X = −600 m. Take X = −700 m (267 m away from the entrance of the tunnel) for example. The pressure is not the maximum when the head of the train reaches the measure point, since IEW could affect the pressure variation at this time. The positive pressure peak is about 771.35 Pa. The pressure drops sharply when the head of the train arrives at the measure point at location e, until the maximum negative pressure value of −528.88 Pa appears after the tail of the train passes through the measure point at location f. The difference between the positive and negative peak pressures is 1300.23 Pa. After the tail of the train leaves the measure point, the pressure rises rapidly. Finally, the pressure at the measure point also fluctuates with the combined effects of the compression and the expansion waves in the tunnel.
Figure 12. Pressure characteristics in the tunnel. (a) X = −900 m; (b) X = −800 m; (c) X = −700 m; (d) X = −600 m.
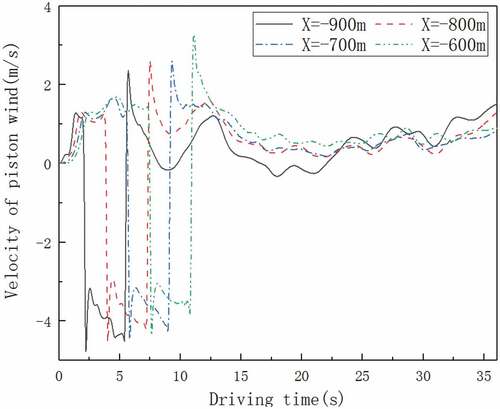
The piston airflow in the tunnel is mainly caused by the movement of the train. Before the train reaches the measure point, the head of the train squeezes the air flowing towards the tunnel exit, which leads to a velocity increase at the measure point. When the train passes the measure point, the negative pressure area will occur due to location variation of the train body. This makes the air flow into the opposite direction, which presents a negative velocity at the measure point. As shown in , “-” means that the air flow direction is opposite to the train direction. When the head of the train just passes through X = −900 m (2.0s), the peak piston airflow velocity is 1.21 m/s due to the squeezed air flowing towards the positive X-axis. The piston airflow velocity drops drastically to −4.77 m/s when the train body passes until the tail of the train arrives at measure point. The difference between the positive and negative peak value is 5.98 m/s. It could be seen that the drastic change of piston airflow was accompanied by the high-speed train passing through the tunnel. For measure points with locations farther away from the entrance, the negative and positive peak velocity of measure points increases slightly.
Figure 13. Airflow characteristics at X = −900 m, X = −800 m, X = −700 m, X = −600 m in the tunnel.
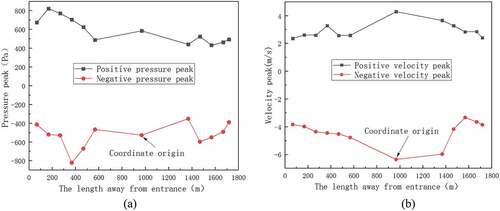
In order to analyze the aerodynamic effects in detail, the peak values of pressure and velocity at 12 measure points are illustrated in . As shown in , the peak positive pressure at first two measure points at the entrance of the tunnel increases as the train enters into the tunnel. At this two measure points, the peak pressure occurs when the head of train arrives at the measure point. For the other measure points, the peak values are decreasing due to the possible influence of IEW. Basically, the peak negative pressure changes little for various measure points. In , it seems that the peak value of piston wind velocity increases a little when the head of the train is far away from the tunnel. Until the head of the train enters into the tunnel of the station at X = 0 m, the peak positive or negative velocity reaches their maximum. Usually, the maximum pressure and velocity in the tunnel may be the best parameter to evaluate the safety issue in the tunnel. Thus, the results indicate that the measure points for pressure should be assigned near the entrance of the tunnel first. For velocity, it will be better to be fixed up near the station.
Figure 14. Pressure and air velocity peak value at different measure point. (a) Positive and negative pressure peak; (b) positive and negative velocity peak.
shows the effect of the train speeds on the pressure variations at X = −700 m in the tunnel. With the increasing of the train speed, it is obvious that the positive and negative peak pressures at X = −700 m also show a growth trend. When the train speed increases from 200 km/h to 300 km/h, the positive and negative peak pressures can increase 60.25% and 67.19%, respectively. As the train leaves the measure point, however, the pressure at X = −700 m changes slightly and is relatively small.
Figure 15. Pressures and airflow velocity characteristics in the tunnel at various train speeds. (a) Pressure contrast at X = −700 m; (b) velocity contrast at X = −700 m.
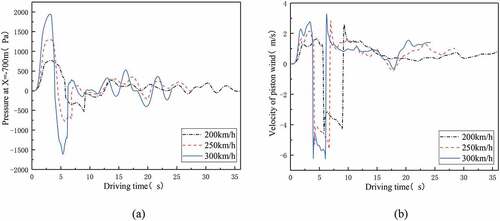
Effect of train speeds on the piston airflow velocities at X = −700 m in the tunnel is also illustrated in . “-” means that the air flow direction is opposite to the train moving direction. When the train runs more quickly, the peak piston airflow velocity also increases. When the train speed is increasing from 200 km/h to 300 km/h, the positive and negative peak velocities can increase 20.97% and 29.92%, respectively. In general, the train speed will affect the piston velocity greatly only when the train body is near the measure point. The airflow velocity changes a little after the train is far away from the measure point. It should be noted that the locations of the maximum positive peak value of piston airflow velocity occur do not change greatly with the train speeds from 200 km/h to 300 km/h. For piston airflow velocity, it reaches the maximum when the head of the train is 269.66 m, 277.60 m and 287.38 m away from the entrance of the tunnel, respectively. The maximum negative value of piston airflow velocity appears when the head of the train is around 500 m away from the entrance of the tunnel.
3.2. Pressure and wind characteristics in the station
shows the airflow field in the station with three typical conditions when the train’s speed is 200 km/h. In The head of the train squeezes air into the station and towards the exit of the tunnel, when the train is getting closer to the station. The air in the tunnel could be put into the platform through the half-height PSD, which will affect airflow of aisle and hall in the station.
Figure 16. Airflow in the station with 200km/h train speed. (a) The head of the train is located at X= −468m;(b) the head of the train is located at X = 91 m; (c) the head of the train is located at X = 1005 m.
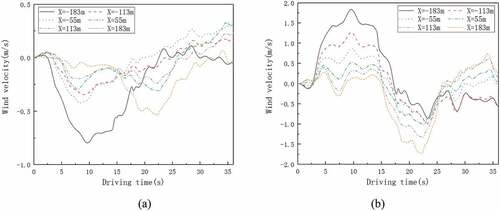
Figure 17. Wind velocities of various measure points on the platform. (a) vertical wind velocity; (b) horizontal wind velocity.
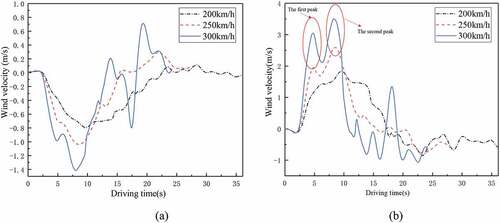
Figure 18. Wind velocities of X = −183 m on the platform at various train speeds. (a) vertical wind velocity; (b) horizontal wind velocity.
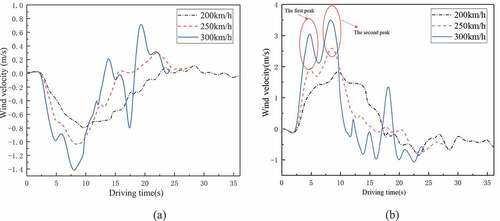
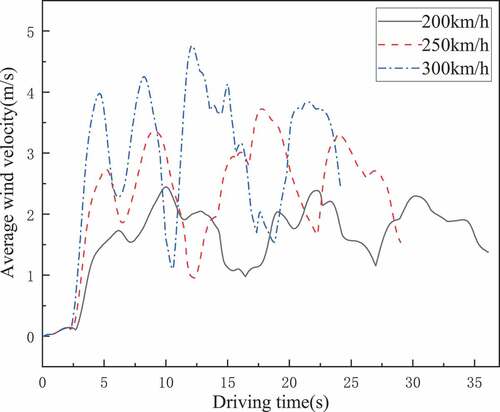
Figure 19. Average wind velocities of H = 1.7 m on the platform at various train speeds.
The airflow characteristics on the platform is very important for the comfort of passengers and design of HVAC systems. In order to clarify the airflow characteristics on the platform more clearly, vertical and horizontal velocities are discussed separately. shows the oncoming vertical velocities at safety line on the platform for train speed of 200 km/h.
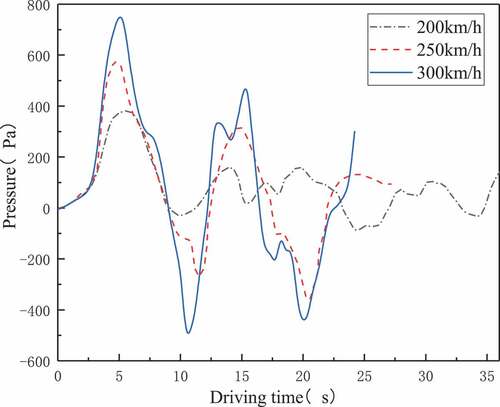
Figure 20. Pressure characteristics of measure point 1 on the platform at various train speeds.
While the train drives into the station, the air in the tunnel will be pushed into the platform. Although the half-height PSD could prevent partial airflow from the passengers directly, the air could still pass through it. Therefore, it is indispensable to study the characteristics of head-on airflow characteristic. It is obvious that the peak velocity reaches its maximum of − 0.79 m/s for the measure point closest to the train when the train is running for 10 s (the head of the train is 94 m ahead of the entrance of the first “throat area”). Furthermore, the farther away from the train the measure point is, the lower the air velocity and the smaller the impact on passengers is. As the train leaves the station, the head-on airflow velocity does not exceed 0.35 m/s; it could be concluded that the influence of piston wind on the head-on airflow velocity is strongest when the train does not enter into the station. presents the horizontal velocities at safety line on the platform. “-” means air flows backwards from the right end of the platform to the left. The horizontal direction of airflow is mainly due to the air squeezed by the train. The airflow will blow directly to the side faces of passengers, and this may cause a certain degree of discomfort. When the train runs for 10 s, the maximum airflow velocity is 1.84 m/s. This is the same instance in which vertical velocities reach their maximum. The maximum horizontal velocity is −1.74 m/s with the train running 22 s (the head of the train 22.8 m ahead of the entrance of the second “throat area”), which is mainly caused by large flow resistance from the long tunnel.
There are large differences on the vertical and horizontal velocities when the train speed increases up to 250 km/h and 300 km/h, as illustrated in . Maximum vertical velocities at train speed of 200 km/h is −0.79 m/s. When the train speed increases, the maximum vertical velocity increases 26.17% and 43.97%, respectively. This may bring much threat to the comfort and safety of passengers when the train speed is increased. In addition, the train speed also affects the horizontal velocities greatly in the similar manner. With the train speeds of 250 km/h and 300 km/h, the positive maximum peak velocities are increased 32.60% and 47.58%, respectively. It should be noted that there are two peak values of horizontal velocities successively, with the train speed of 250 km/h and 300 km/h. The difference between first and second peaks is gradually close with the increase of train speeds. It could be concluded that as the train speed increases, the aerodynamic effect gets worse.
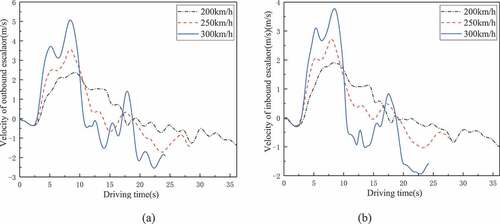
Figure 21. Velocities of outbound and inbound escalators at various train speeds. (a) Velocitiy contrast of outbound escalator; (b) velocitiy contrast of inbound escalator.
In the practical engineering, the average value of wind velocity at pedestrian height is usually taken as the major reference parameter for design and operation, which is worthy for further discussion. Figure 22 shows the average of the piston wind velocity of the station region under different train speed. It can be seen that as the speed of the train increases, more and more air is squeezed by the head of the train and enters into the platform from the tunnel. As can be seen from the , the effect of the horizontal wind velocity is much greater than that of the vertical wind. Therefore, after the two are averaged, the horizontal wind dominates the airflow with the increasing of train speed from 200 km/h to 300 km/h, and the peak piston wind velocity is increased by 48.74%. On the other hand, it can be concluded that the average piston wind velocity is greater than the wind velocity in one direction. It is undeniable that both will cause greater influence on the comforts and safety of passengers.
Figure 23 shows the pressure variations in the platform with different train speeds. As the train is running in the tunnel, the pressure is increasing greatly at the beginning and reaches its maximum at around 5 s. When the train speed increases, the maximum positive pressure peak increases 31.31% and 49.02%, respectively. The pressure rises due to the propagation of ICW when the head of the train enters into the tunnel entrance. Then the pressure decreases quickly and drops to the negative maximum value. After that, the pressure starts to decrease slowly in a fluctuant way. With the increase of train speed, the maximum pressure increases all the time.
The airflow velocities of the entrance and exit of the escalator station are also displayed in Figure 24. As the train speed increases, the maximum airflow velocity is increasing a lot and the time corresponding to the maximum airflow velocities is shorten a bit. When the train runs from 200 km/h to 300 km/h, the maximum airflow velocities could reach up to 5.07 m/s (53.25%), which could make passengers feel uncomfortable.
4. Conclusions
Unsteady airflow and pressure variation in the underground station are very important for the passenger safety and energy saving in HVAC design. A numerical research on the unsteady airflow and pressure characteristics in the full-scale underground highway station with the train passing was conducted. The main results could be summarized as the following.
Pressure characteristics in the tunnel change greatly at various measure points due to the propagations of compression and expansion waves. The propagations of compression and expansion waves determine the local pressure of measure points together. For the first two measure points X = −900 m, X = −800 m, the pressure at the measure point will reach the peak value when the head of the train reaches the measure points. For the other measure points, the pressure is not the maximum when the head of the train reaches the measure point, due to the effect of IEW.
When the head of the train just passes through the measure point, the peak piston airflow velocity could be reached due to the squeezed air flowing towards the positive X-axis. The piston airflow velocity drops drastically to a negative peak value when the train body passes until the tail of the train arrives at measure point. The peak value of piston wind velocity increases a little when the head of the train is far away from the tunnel. Until the head of the train enters into the tunnel of the station at X = 0 m, the peak positive or negative velocity reach their maximum. With the increase of the train speed, the peak velocity is increased greatly.
In the platform, the peak velocity reaches its maximum for the measure point closest to the train. The farther away from the train the measure point is, the lower the air velocity and the smaller the impact on passengers is. With the increase of train speeds, the positive maximum peak velocities are increased by 32.60% and 47.58%, respectively. It should be noted that there are two peak values of horizontal velocities successively, with the train speed of 250 km/h and 300 km/h. The differences between first and second peaks are gradually close with the increase of train speeds.
Nomenclature
| PSD | = | Platform screen door |
| VT | = | velocity transducer |
| PT | = | pressure transducer |
| D | = | Distance away from the entrance of the tunnel, m |
| 1-8 | = | pressure, Pa |
| a, c, e, g | = | when the head of the train arrives the measure point |
| b, d, f, h | = | when the tail of the train arrives the measure point |
| n | = | the Initial Compress Wave propagates to the measure point |
| ICW | = | Initial Compress Wave, Pa |
| IEW | = | Initial Expansion Wave, Pa |
Acknowledgments
This study is supported by National Natural Science Foundation of China (Grant No. 51706189).
Disclosure statement
No potential conflict of interest was reported by the authors.
Additional information
Funding
Notes on contributors
Yongliang Xie
Yongliang Xie is an assistant professor of Southwest University, Chengdu, China. He is engaged in the safety issue in the renewable energy system and transportation.
Qizhang Li
Qizhang Li is graduating from Southwest University, Chengdu, China. He obtained his Master's degree in Engineering in 2021. His research interest is tunnel ventilation.
Fujian Jiang
Fujian Jiang is an assistant research fellow of Southwest University, Chengdu, China. His major research field is the wind and thermal environment of the building.
References
- D. O. USA. 1997. “Subway environmental design handbook.” In . In Subw. Environ. Simul.Comput. Progr.(vol. II).
- Fu, R., C. Wei, and J. Zhao. “Ventilation Energy Conservation in Highway Tunnel with Piston Wind”. in International Conference on Electromechanical Control Technology and Transportation Guilin, China. 2019.
- G, G. 1995. “Numerical Investigation of Local Thermal Discomfort in Offices with Displacement Ventilation.” Energy and Buildings 23 (2): 74–81.
- Gonzalez, ML, Vega, MG, Oro, JMF et al . 2014. Numerical Modeling of the Piston Effect in Longitudinal Ventilation Systems for Subway Tunnels . TUNNELLING AND UNDERGROUND SPACE TECHNOLOGY, 40 22–37 doi:10.1016/j.tust.2013.09.008.
- He, DQ, Teng, XL, Chen, YJ et al, et al. 2021. “Piston Wind Characteristic and Energy Saving of Metro Station Environmental Control System”. Journal of Building Engineering 44: 102664. doi:10.1016/j.jobe.2021.102664.
- Heine, D, Ehrenfried, K, Kuehnelt, H et al, et al. 2019. “Influence of the Shape and Size of Cavities on Pressure Waves inside high-speed Railway Tunnels”. Journal of Wind Engineering and Industrial Aerodynamics 189: 258–265. doi:10.1016/j.jweia.2019.03.032.
- Kim, J. Y., and K. Y. Kim. 2007. “Experimental and Numerical Analyses of train-induced Unsteady Tunnel Flow in Subway.” Tunnelling and Underground Space Technology 22 (2): 166–172. doi:10.1016/j.tust.2006.06.001.
- Ko, YY, Chen, CH, Hoe, IT et al, et al. 2012. “Field Measurements of Aerodynamic Pressures in Tunnels Induced by High Speed Trains.” Journal of Wind Engineering and Industrial Aerodynamics 100 (1): 19–29. doi:10.1016/j.jweia.2011.10.008.
- Krasyuk, A. M., I. V. Lugin, and S. A. Pavlov. 2019. Experimental Research into Air Distribution in a Terminal Subway Station . TUNNELLING AND UNDERGROUND SPACE TECHNOLOGY, 85: 21–28 doi:10.1016/j.tust.2018.11.049.
- Kuznetsov, A. V. 2004. “Numerical Modeling of Turbulent Flow in a Composite porous/fluid Duct Utilizing a two-layer k–ε Model to Account for Interface Roughness.” International Journal of Thermal Sciences 43 (11): 1047–1056. doi:10.1016/j.ijthermalsci.2004.02.011.
- Li, GQ, Meng, X, Zhang, XW et al, et al. 2020. “An Innovative Ventilation System Using Piston Wind for the Thermal Environment in Shanghai Subway Station”. Journal of Building Engineering 32: 101276. doi:10.1016/j.jobe.2020.101276.
- Liang, XF, Chen, G, Li, XB et al . 2020 Numerical Simulation of Pressure Transients Caused by high-speed Train Passage through a Railway Station . BUILDING AND ENVIRONMENT, 184: 107228 doi:10.1016/j.buildenv.2020.107228.
- Liu, MZ, Zhu, CG, Zhang, H et al . 2019. “The Environment and Energy Consumption of a Subway Tunnel by the Influence of Piston Wind”. Applied Energy 246: 11–23. doi:10.1016/j.apenergy.2019.04.026.
- Liu, MZ, Zhang, H, Zhu, CG et al . 2020. Theoretical Modeling of Piston Wind Induced by Multiple Trains in Longitudinal Tunnel . SUSTAINABLE CITIES AND SOCIETY, 57: 102127 doi:10.1016/j.scs.2020.102127.
- Lv, M, Li, Q, Ning, Z et al . 2018. “Study on the Aerodynamic Load Characteristic of Noise Reduction Barrier on high-speed Railway”. Journal of Wind Engineering and Industrial Aerodynamics 176: 254–262. doi:10.1016/j.jweia.2018.03.031.
- Ma, JY, Zhang, X, Li, AG et al . 2018 Analyses of the Improvement of Subway Station Thermal Environment in Northern Severe Cold Regions . BUILDING AND ENVIRONMENT, 143: 579–590 doi:10.1016/j.buildenv.2018.07.039.
- Melbourne, W. H. 1978. “Criteria for Environmental Wind Conditions.” Journal of Wind Engineering and Industrial Aerodynamics 3 (2): 241–249. doi:10.1016/0167-6105(78)90013-2.
- Meng, S., et al. 2021 Numerical Simulation of Slipstreams and Wake Flows of Trains with Different Nose Lengths Passing through aTunnel . TUNNELLING AND UNDERGROUND SPACE TECHNOLOGY,108: 103701 doi:10.1016/j.tust.2020.103701.
- Niu, JQ, Zhou, D, Liang, XF et al. 2018. “Numerical Simulation of the Reynolds Number Effect on the Aerodynamic Pressure in Tunnels”. Journal of Wind Engineering and Industrial Aerodynamics 173: 187–198. doi:10.1016/j.jweia.2017.12.013.
- Niu, JQ, Sui, Y, Yu, QJ et al . 2020. “Aerodynamics of Railway train/tunnel System: A Review of Recent Research.” Energy and Built Environment 1 (4): 351–375. doi:10.1016/j.enbenv.2020.03.003.
- Passi, A., S. M. S. Nagendra, and M. P. Maiya. 2021 Characteristics of Indoor Air Quality in Underground Metro Stations: ACritical Review . BUILDING AND ENVIRONMENT, 198: 107907.
- Raghunathan, R. S., H. D. Kim, and T. Setoguchi. 2002. “Aerodynamics of high-speed Railway Train.” Progress in Aerospace Sciences 38 (6): 469–514. doi:10.1016/S0376-0421(02)00029-5.
- Targino, AC, Krecl, P, Brimblecombe, P et al . 2021. “Spatio-temporal Variability of Airborne Particulate Matter in the São Paulo Subway”. Building and Environment 189: 107526. doi:10.1016/j.buildenv.2020.107526.
- Wang, K., W. Xia, and A. Zhang. 2017. “Should China Further Expand Its high-speed Rail Network? Consider the low-cost Carrier Factor. Transportation Research Part A.” Policy and Practice 100: 105–120.
- Wang, Y, and XF Li. 2018 STESS: Subway Thermal Environment Simulation Software . SUSTAINABLE CITIES AND SOCIETY, 38: 98–108 doi:10.1016/j.scs.2017.12.007.
- Wang, JJ, Zhao, LJ, Zhu, DL et al, et al. 2016. “Characteristics of Particulate Matter (PM) Concentrations Influenced by Piston Wind and Train Door Opening in the Shanghai Subway System. Transportation Research Part D.” Transport and Environment 47: 77–88.
- Wang, F, Liu, F, Han, JQ et al . 2020 Study on the train-induced Unsteady Airflow in aMetro Tunnel with multi-trains . TUNNELLING AND UNDERGROUND SPACE TECHNOLOGY,106: 103565 doi:10.1016/j.tust.2020.103565.
- Xiang, XT, Xue, LP, Wang, BL et al . 2018 Mechanism and Capability of Ventilation Openings for Alleviating micro-pressure Waves Emitted from high-speed Railway Tunnels . BUILDING AND ENVIRONMENT, 132: 245–254 doi:10.1016/j.buildenv.2018.01.045.
- Xue, P, You, SJ, Chao, JY et al . 2014 Numerical Investigation of Unsteady Airflow in Subway Influenced by Piston Effect Based on Dynamic Mesh . TUNNELLING AND UNDERGROUND SPACE TECHNOLOGY, 40: 174–181 doi:10.1016/j.tust.2013.10.004.
- Yang Z, Su, XC, Ma, F et al . 2015. “An Innovative Environmental Control System of Subway.” JOURNAL OF WIND ENGINEERING AND INDUSTRIAL AERODYNAMICS doi:10.1016/j.jweia.2015.09.015.
- Yu, YZ, You, SJ, Zhang, H et al . 2021. “A Review on Available Energy Saving Strategies for Heating, Ventilation and Air Conditioning in Underground Metro Stations”. Renewable and Sustainable Energy Reviews 141: 110788. doi:10.1016/j.rser.2021.110788.
- Yuan, H, D Zhou, and S Meng. 2019 Study of the unsteady aerodynamic performance of an inter-city train passing through a station in a tunnel . TUNNELLING AND UNDERGROUND SPACE TECHNOLOGY, 1–9 doi:10.1016/j.tust.2019.01.009. Vol. 86.
- Zhang, L., and H. Ma. 2021. “Investigation of Chinese Residents’ Community Response to high-speed Railway Noise.” Applied Acoustics 172: 107615. doi:10.1016/j.apacoust.2020.107615.
- Zhang, Y, and XF Li. 2021 Numerical Analysis on the Condenser Inlet Air Temperature of train-mounted Air Conditioner When aTrain Stops in Subway Station Tunnel. SUSTAINABLE CITIES AND SOCIETY, 69: 102793 doi:10.1016/j.scs.2021.102793.
- Zhang, H, Zhu, CG, Zheng, WD et al . 2016 Experimental and Numerical Investigation of Braking Energy on Thermal Environment of Underground Subway Station in China’s Northern Severe Cold Regions . , 880–893 doi:10.1016/j.energy.2016.10.029.
- Zhang, H, Cui, T, Liu, MZ et al . 2017 Energy Performance Investigation of an Innovative Environmental Control System in Subway Station. BUILDING AND ENVIRONMENT, 126: 68–81 doi:10.1016/j.buildenv.2017.09.023.
- Zhou, YL, Wang, HL, Bi, HQ et al . 2021 Experimental and Numerical Study of Aerodynamic Pressures on Platform Screen Doors at the Overtaking Station of a high-speed Subway . BUILDING AND ENVIRONMENT, 191: 107582 doi:10.1016/j.buildenv.2020.107582.