
 ?Mathematical formulae have been encoded as MathML and are displayed in this HTML version using MathJax in order to improve their display. Uncheck the box to turn MathJax off. This feature requires Javascript. Click on a formula to zoom.
ABSTRACT
Considering the inherent laws and logical relationships between disasters and poverty, the combination of poverty alleviation relocation (PAR) and earthquake reconstruction relocation (ERR) is valuable both theoretically and practically. This study compared PAR and ERR projects on a systematic basis in terms of implementation area, mode adoption, construction content, public engagement, and challenges. Moreover, four common types of villages (e.g., enclave, adjacent, centralized, and infill) and the two resident groups of the re-settler and local groups were recognized. Regarding the social restructuring after relocation, the performance of the double-directional degree of social isolation (SO) and spatial isolation (SP) between the two resident groups were evaluated and compared in types, which helps planners predict and clarify the social impact of the chosen type. The underlying social and spatial reasons affecting the social integration were explained to propose the corresponding planning measures for social integration promotion.
1. Introduction
People worldwide are relocated by force or voluntarily with different orientations (Terminski Citation2013). In rural China, the massive relocation projects have been mainly triggered by development and disasters. China has undergone a large scale of development-induced displacement and resettlement, represented by poverty alleviation relocation (PAR). Considering the principle of voluntariness, by relocating people from ecological poverty-stricken areas to places with better development conditions, resettlement can help achieve the improvement of production and living conditions, the alleviation of poverty, land resources utilization, and the ecological environment protection (Yang et al. Citation2020). “Targeted poverty alleviation” was initially proposed at the end of 2013, and the 13th Five-year Plan (FYP) for poverty alleviation relocation was released in 2016 (Zhou et al. Citation2018). After years of implementation, China declared the completion of the relocation task and the “miracle success” of eliminating absolute poor in early 2021.
In the same period, the Lushan earthquake occurred in 2013. The earthquake resulted in 196 people dead, 24 missing, and at least 11,826 injured with more than 968 seriously injured. Because of the substantial economic harm and loss of life, consequently, social and economic instability may be experienced for prolonged periods following their aftermath (Moltchanova et al. Citation2011), and displaced victims had to be involved in the disaster-induced resettlement. Influenced by geology and topography, the disaster-stricken areas in vast mountainous Sichuan have a high degree of coincidence with concentrated poverty-stricken areas (Zhou et al. Citation2021). Given fact that disasters and poverty have inherent laws and logical relationships, to realize comprehensive poverty alleviation and become a prosperous society (Long and Liu Citation2016), the Poverty Alleviation Office of the State Council emphasized that: the post-disaster reconstruction plan should be combined with poverty alleviation, accompanied by specifically designed planning to address issues of poverty and vulnerability (Dunford and Li Citation2011). Therefore, the combined study of poverty alleviation relocation (PAR) and earthquake reconstruction relocation (ERR) is important.
Assimilation and integration theories suggest that resettlement can be considered successful when an immigrant is fully integrated into the host society. Compared with in-situ reconstruction (Alba and Nee, Citation1997), Cernea (Citation2002) pointed out that reallocated reconstruction could lead to significant negative effects on the affected residents due to the loss of shelter, land, social network, and cultural assets. Compared to off-site resettlement, such as rural-urban relocation, nearby relocation within the rural area may result in a smaller reorganization of all sectors of production and living, allowing rapid recovery of previous lifestyles, feeling of belonging, and community cohesiveness, all of which contribute to social stability and may possibly enhance social integration (Peng Citation2013). However, quantitatively, how do the two main stakeholders, the local group and re-settler group, assimilate to each other in the PAR and ERR respectively? What are the social and spatial factors that influence the integration, respectively? What is the difference between them? This research aimed to answer the above questions.
2. Literature review
International data demonstrates that disasters and poverty are inextricably linked. Therefore, lowering risks, mitigating catastrophes, and strengthening people’s ability to deal with disasters entails poverty reduction. According to the available research, the impact of a disaster is proportional to the magnitude, population size, and vulnerability exposed to the event (Strömberg Citation2007; Wisner Citation1998).Vulnerability is determined by a multitude of socioeconomic variables, including the prevalence of poverty and the efficacy of governance. The impoverished are susceptible due to their geographical location; nevertheless, a lack of household income or local government revenue also makes individuals and areas more vulnerable (Huang et al. Citation2011). Natural disasters impoverish farmers in five ways: they deplete physical, human, financial, natural, and social capital (Pitchett, Suryahadi, and Sumarto Citation2000).The impact of the earthquake on poverty-stricken villages is lower than that on non-poverty-stricken villages. Data show that the total and per capita number of collapsed houses of non-poverty villages are higher than those in poverty villages 2.1 and 1.2 times, respectively (Jia et al. Citation2018).
However, the inclusion of the poor and vulnerable in post-disaster reconstruction processes is a challenging issue that has seldom been addressed effectively or comprehensively (Rawal et al. Citation2021). A review of numerous past experiences revealed that the reconstruction policies were either uninformed and oblivious of the socio-economic inequities, or inadequate to address such structural issues for ensuring inclusive and equitable reconstruction and recovery (Gould Citation2009; HIC Citation2005). Nevertheless, most of the research has only focused on the comparisons in policymaking, experience, and outcome situations between poor families and non-poor families in or after the reconstruction. Very few have systematically compared the earthquake reconstruction relocation projects and poverty alleviation projects. The lack of a comprehensive consideration of the above two categories may lead to duplication, inefficiency, and even conflicting work paths in actual work, thereby limiting the comprehensive performance of the relocation project in many aspects. Moreover, most research only captures the one-sided replies of the migrant groups, leaving out the viewpoints of locals who play an equally vital role. As a result, this study attempted to fill the above gaps by conducting a comparative analysis of PAR and ERR in terms of bi-directional social integration between the re-settler and local groups, as well as assessing and determining social and spatial influencing factors in order to propose social integration strategies.
3. General comparison
We found ERR generally more challenging than PAR projects, considering their higher construction standards and an additional focus on safety and disaster resistance, higher public engagement, and additional challenges of psychological reconstruction, as shown in .
Table 1. General comparison between PAR (A) projects and ERR (B) projects.
4. Methodology
4.1. Typology
We chose 37 villages for PAR and 29 villages for ERR. PAR villages are located in Zhushan County and Zhuxi County, in Shiyan City, considering its large numbers of relocated population and projects and good nation-wide praised achievement. ERR villages are located in the counties of Lushan, Baoxing, Tianquan, and Yucheng district, which were the most severely affected area after the Lushan earthquake. Hubei and Sichuan are neighboring provinces. Geographically, the above areas all locate in the fringe area of the Sichuan Basin, in the continuous mountainous area. Moreover, the strong connections and similarities in economic, social, and cultural aspects make them comparable. Those settlements were chosen for the typology study based on available data on resettlement population and household numbers, as well as discernible boundaries from satellite maps. We did not follow the administrative territory but focused on the residence’s actual physical proximity. Because physically accessible residential clusters sometimes cross administrative borders, but sometimes smaller.
We classified the villages by defining their demographical and physical environments from the relocation perspective. We adopted four dimensions that was proposed by Massey and Denton (Citation1988) for residential segregation, namely exposure, concentration, centralization, and clustering. Adapted from Hu and Ubaura (Citation2021b), shows the difinitions and simplified formulas to gain a more direct understanding of the resettlement.
Table 2. The four dimensions and the calculation method for the resettlement typology.
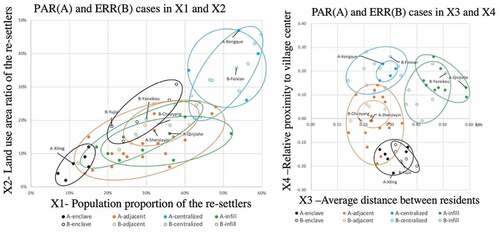
Following the above dimensions, we conducted a cluster analysis for the villages for PAR and ERR respectively. Four types of villages were determined: the enclave type, adjacent type, centralized type, and infill type. shows the case distribution in the two 2-dimensional graphs. The first graph is the dimensions of population proportion (X1) and land use area ratio (X2), which indicates the relocation intensity. Generally, the centralized type is highlighted for its higher values of both X1 and X2, indicating that it has a higher degree of relocation involvement. The other three types are similar with less intensive relocation involvement. The second graph contains the dimensions of average distance (X3) and relative centralization (X4), reflecting the spatial layout and relative location of the resettlement. The centralized type has highly positive centralization; the enclave type has highly negative centralization; the infill type is in scattered layout for its big average distance; whereas the adjacent type is in aggregation layout for its relatively smaller distance.
Figure 1. Distribution charts of the PAR and ERR cases in the four dimensions.
4.2. Case
We selected the representing cases following the common standards: 1) Suitable village size: the village should be of middle size, which guarantees sufficient respondent and appropriate workload, 2) Similar relocation year: the relocation year should be in a similar timeframe to ensure that residency years are uninfluential; also, residents need time to get to know one another; accordingly, we chose projects that were completed by the year 2016–2017. 3) Representativeness: the cases must be representative for each cluster, implying that it is close to the cluster center or distinguished at a certain dimension to highlight its characteristics. 4) Comparability: A and B cases should be comparable, judging from the proximity of the cluster distribution in .
Starting from PAR(A) case selection, we began with the adjacent type for its largest cluster size. Based on the standard 3) representativeness, we chose the A-Shenjiayin for its proximity to the adjacent cluster center of PAR (A). Then, we chose another other three villages to represent the other three villages, because they all have large distances from A-Shenjiayin village, highlighting the individualities and characteristics of the representative types. Following the selection of the four PAR(A) cases, each ERR(B) case in each cluster was picked based on its proximity to the PAR case. Moreover, all cases must adhere to the standards of 1) and 2), meaning that they all have similar population numbers (300–800) and similar relocation years (2016–2017), thus, make them comparable in pairs.
4.2.1. The enclave type
In this type, the re-settlers have a minority population and less land-use area than the locals. The re-settlers live in an enclave, which is far away from the local clusters. It is often adopted in situations with hard-to-solve problems, such as a lack of available and adequate land use nearby. The spatial separation contributes to the “independence” between the existing village and resettlement, as shown in .
Figure 2. Maps of cases of the enclave type.
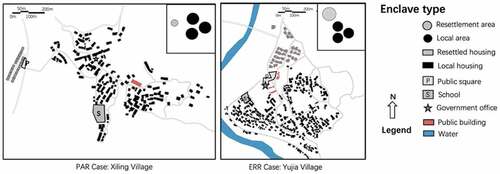
PAR is represented by Xiling village. The resettlement area is located far away from the local area as an enclave, whereas residential areas are in medium-sized clusters. There is no public square in the local area but a small one in the enclave, with some simple fitness equipment. Re-settlers are mainly engaged in the recycling of turquoise slag and the cultivation of shiitake mushrooms. They use the open space next to the house to build a mushroom greenhouse.
ERR is represented by Yujia village. It is located in a national 4A-level scenic spot. The relocated households live in an enclave located in the north part. The tourist service center and some public facilities are located in the buffer area between the local clusters and resettlement. Based on the industrial business model of “company + cooperative + base + farmer households,” it promotes the development of eco-cultural tourism and builds blueberry and strawberry center. The local enterprises are awarded by employing re-settlers, which helps increase income and achieve economic integration.
4.2.2. The adjacent type
In this type, the re-settlers have a smaller population and less land-use area than the locals. The average distance (“clustering”) is among the smallest, that is, all residents live closer than in other clusters, thus making the entire village a continuous aggregation. The “centralization” is approximately 0, implying that both groups have similar proximity to the village center because the re-settlers reside beside the local area adjacently, merging as one aggregation. The re-settlers can access existing public resources and development foundations of the existing village and form a “ “parasitic” relationship, as shown in .
Figure 3. Maps of cases of the adjacent type.

Shenjiayin village was selected to represent PAR. The resettlement is located in the northeast, next to the existing area. The public square, which features humble facilities, and a government building are located on the edge. Some Villagers were engaged in tea, Chinese herbal medicine, and mushroom cultivation in family unit, while some work in village-level enterprises engaged in barite mining, processing, and sales. The re-settlers are mainly engaged in the cultivation of mushrooms.
Chaoyang village was selected to represent ERR. The resettlement is located adjacently to the old area at the northwest. To avoid falling into a poverty cycle and fundamentally realize “continuous blood production,” industrial concentration area was built to achieve employment “at their doorstep,” such as tea and kiwi fruit bases to develop and expand the characteristic planting and breeding industries of Chinese medicinal materials.
4.2.3. The centralized type
In this type, the re-settlers and locals are balanced in population and land use area. An intensive resettlement cluster is centralized and surrounded by several local clusters, making the re-settlers have a highly positive relative centralization (X4) higher than the locals. Normally, it requires a centralized location that can benefit both groups and a relatively larger area of continuous land to accommodate the re-settlers. Both the existing village and resettlement can significantly benefit from the project and centralized infrastructure, therefore forming a “symbiosis” relationship, as shown in .
Figure 4. Maps of cases of the centralized type.
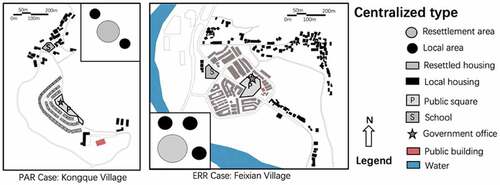
We selected Kongque village to represent PAR. A relatively large, compact, well-organized resettlement cluster is centralized. It is well equipped and maintained with large green space and clear spatial structure, and good functioning with sufficient space for multipurpose. Its garden-style resettlement make it a model project for rural revitalization. Villagers use the Internet live streaming combined with e-commerce and promote local agricultural products such as potatoes and mushrooms.
We selected Feixian village to represent ERR. The re-settler group occupies approximately 56% of the population and 37% of the land-use area. The resettlement concentratively is located in the middle and it is composed of Western Sichuan style traditional buildings. Relying on the nearby rich historical, cultural, and natural resources, it has been developed into a popular scenic spot. The small-sized businesses are developed in the resettlement, meeting the daily needs of the nearby population as well as supporting the tourism.
4.2.4. The infill type
In this type, the re-settlers have a smaller population and land-use area than the locals. Residents live in a scattered pattern with a high average distance (X3), whereas the positive “centralization” show that the re-settlers live relatively closer to the center. It has multiple divided and small-sized clusters, which is distancing from each other. These clusters are embedded in the existing settlement pattern, like filling the gaps. It is often adopted in mountainous areas, where available residential clusters are fragmented. Its even distribution along the road network indicates an “equal” relation with the existing village, as shown in .
Figure 5. Maps of cases of the infill type.
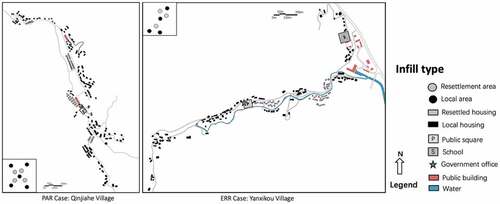
PAR is represented by Qinjiahe village, where re-settlers dwell across four small clusters, highly depend on road network. The school, government office building, and the public square are located jointly on the main road, acting as the central complex area. Located in a scenic spot, with a large area of virgin forest and mountain tea gardens, the village established professional cooperatives such as tea and mushroom planting.
ERR is represented by Yanxikou village. The village was “travel on foot only” in the old days, it became rich with the improvement of road traffic and the simultaneous development of medicinal materials and vegetable cultivation. Moreover, using idle land near the village cultural activity center as a pilot planting base for village-level collective economic development and the guidance from the specialist from “night school” enabled 37 relocated households to find employment.
4.3. Social integration degree Evaluation methodology
To evaluate the integration degree, we adopted socio-spatial isolation indices initially proposed by I. Schnell and Yoav (Citation2001). They are used to define an individual’s personal isolation status from the other group members by examining their social networks and the activity space in everyday life. The indices contain social isolation (SO) and spatial isolation (SP). The social isolation was measured along with the three spheres of daily activities: meetings with mates at work, meetings with friends and neighbors, and telecommunication. Four territorial bases in concentric circles designated the spatial isolation: close vicinity, cluster, neighborhood, and the village and beyond (). We quantified territorial sphere’s size based on the walking distances from the respondent’s home, following the definition of “life-circle”. Then “close vicinity” was defined as a 1-minute walk, 60 m from home; “cluster” as a 5-minute walk, 300 m from home; “neighborhood” as a 10-minute walk, 500 m from home, and “village and beyond” as an area that is farther than 500 m. SO and SP values were decided by proportion and weight:
Proportion: The proportions p were between the number of members belonging to the same group as the respondent and the number of members from alternative groups. For SO, with nq(i) being the number of those encountered by local i who are also local in activity q, and Nq(i) being the total encountered population in the same activity q, the proportion of local i is:
Figure 6. Definition and calculation method of socio-spatial indices.
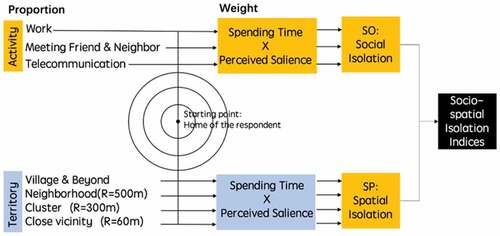
Similarly, for SP, with nr(i) being the number of locals living in territory r where local i lives and Nr(i) being the total number living in that same territory r, the proportion of local i is:
Re-expressing the above proportion p, precisely Sq(i) and Sr(i) through logistic transformations,
(2) Weight: Weight was decided by two factors: time weight and relative salience. The time weight of SO measures the proportion of time that a person spends in each of their daily activities, respectively. SP’s time weight measures the proportion of time a person spends in the four above territories, respectively. Similarly, two other sets of weights express the person’s relative salience to each of these spatial and social spheres. If Tq(i) is the time spent in activity q and Vq(i) is its perceived salience, their product is:
Then, normalize them to get the final weights of the three activity spheres:
Similarly, If Tr(i) is the time spent at territory r, Vr(i) is its perceived salience, and their product is:
Then, normalize the sum of these products to get the weights of the four territory bases:
Combining 1) proportions and 2) weights to get the social isolation indices and spatial isolation indices:
and
Then back-transforming them into the 0–1 scale using the re-expressions:
and
The index of SO and SP may range between 0 and 1, with 0 indicating extreme exposure to members of other groups, 1 representing extreme isolation from members of other groups, and the bigger value expressing higher spatial and social isolation. SO indicates to what extent the social integration has been achieved; SP indicates the demographic and physical condition.
4.4. Data collection
The data was collected through a questionnaire survey in the four selected cases. The survey was conducted through face-to-face and door-to-door interviews in November 2019 for PAR and January 2021 for ERR; 454 and 438 valid questionnaires were collected, respectively, as shown in . The respondents were picked randomly and proportionate with the demographic distribution. Three sections were designated in the questionnaire:
SO section: The relative weights calculation is done by asking people to describe the time duration and salience in three kinds of activities. As for the proportion part, residents were asked to what extent they interact with in-group members compared to out-group members during work, meeting with neighbors and friends, and telecommunication. They were asked to choose from “never/neither” (0%), “much less” (0–20%), “a little less” (20–40%), “about the same” (40–60%), “a little more” (60–80%), “much more” (80–100%), “only with in-group members” (100%). Then, the values 0%, 10%, 30%, 50%, 70%, 90%, and 100% were adopted respectively as the corresponding proportion answers.
SP section: Weights were obtained by asking people to describe time duration and salience for the four territories. The population proportion of SP was estimated through map counting, following these four steps: Step 1, set the home location of the respondent as the starting point; Step 2, draw three concentric circles with a radius of 60 m, 300 m, and 500 m, respectively, representing the four territories; Step 3, count household numbers that represent the population of both groups in each territory, multiply by the average family size, to arrive at a product that will reflect both groups’ population; and Step 4, obtain the proportion.
Personal information and opinion section. It contained social status criteria, including gender, age, education, family size; the social capital criteria, such as household assets change after resettlement, whether registered as the targeted poor household after in the poverty alleviation identification system; self-accessed criteria related to the project and disasters, such as opinions towards the relocation project, the information access degree in the decision-making process, frequency and personal appeal of the public facilities utilization. Additionally, ERR also contains physical injuries and mental health condition because of the earthquake.
Table 3. Basic information of the study cases.
5. Evaluation results and comparison
How do the mean SO and SP values in PAR and ERR projects differ across four types and two groups? We compared the mean SO and SP values for each of the four types. Apart from the enclave type, we discovered that the cases of PAR (A) and ERR (B) have a similar SO degree.
Through a simple effect test using univariate analysis, compared SO and SP mean values of the two cases of the enclave type, namely Xiling village in PAR (A) and Yujia village in ERR (B). Both Xiling village groups were spatially and socially more isolated than Yujia village. We found two possible reasons behind the promoted integration in the Yujia village. The first was the high engagement in the well-developed local eco-tourism industries. Being employed by the local enterprises, the re-settlers had a higher mixture in the workplace in Yujia village than the Xiling village. The second was that in the buffer area between the enclave and local clusters, instead of being vacuum in Xiling village, Yujia village was allocated with public spaces, which performed as a connection bridge between the two groups. It indicated that the isolation brought by the distance could be relieved with widely engaged local industries and the layout of the public facilities.
Table 4. Enclave type comparison.
The comparisons of the two cases of adjacent types are shown in . Except for the re-settlers’ SP, no statistical differences were found that Shenjiayin village of PAR(A) was more spatially isolated than Chaoyang village of ERR (B). Clues were found in the maps in . Both resettlements were adjacent to the local area; however, Chaoyang village enjoyed a considerably longer shared border with the local area, increasing the likelihood of greater mixture along the border. It demonstrates that the size and shape of resettlement and the length of the shared border could have a considerable effect on the spatial isolation of people residing in border areas. The statistically similar SO values indicated that the enhancement of spatial integration did not morph into social integration promotion.
Table 5. Adjacent type comparison.
compares two centralized cases, Kongque village in PAR and Feixian village in ERR. SP values show that re-settlers in Feixian village were more spatially isolated than the re-settlers in Kongque village. In the centralized type, a large resettlement area was centralized together with public facilities, regarded as the village center that assembles massive residents. In Feixian village, the resettlement was an integrated area for tourism, residence, commerce, and public service; its resettlement was more intensively centralized with multi-functional public facilities than that of Kongque village. Therefore, the re-settlers of centralized type were less likely to travel to wider territory from home, in other words, longer hours were spent in the nearby territory of close vicinity, which resulted in the higher degree of spatial isolation for the re-settler group in Kongque village. It implies that intensive centralization benefited re-settlers more than locals in social integration.
Table 6. Centralized type comparison.
As for the infill type in , the comparison shows that the two cases had similar social isolation degrees. The locals in Yanxikou village of ERR were more spatially isolated than the locals in Qinjiahe village of PAR because of the distribution pattern of scattered clusters. In both cases, the road network connected the scattered clusters, contributing to the “equal” relation between local and re-settlers in infill type.
Table 7. Infill type comparison.
With the data in , the four types are ranked in based on pairwise comparisons of mean values using a simple effect test in univariate analysis. The rankings made clear the social impact and performances brought by relocation when adopting different resettlement types, which offers the planners broad references when choosing the appropriate resettlement type for the relocation project when deciding the relocation destination and layout. We discovered that the centralized and infill types were similarly top-ranked: the centralized type consistently ranked first with the lowest SO value, demonstrating the its superior performance in promoting social integration during the relocation project, and thus is recommended. The infill type also ranked high with medium SO values and low SP values, making the infill type to be the best spatially integrated type. We consider it also a good choice in some circumstances regarding geographical and land use limitations. The enclave type was the most spatially and socially isolated type. It shows the natural disadvantage of enclave type and highlights the “independence” between the two groups. Therefore, it is suggested as the last option, but the gaps with other types are narrower in ERR compared to PAR. The adjacent type had mid-level performance, making it a considerable option for its intensive land use pattern, straightforwardness, and cost-effectiveness, as it could make use of the existing recourses to the largest extent.
Table 8. Rankings of mean SO and SP value in the four types and two groups respectively in A(PAR) and B(ERR) projects.
6. Social factor comparison
6.1. Residents’ socioeconomic attributes
We compared the socioeconomic attributes of PAR cases and ERR cases in the two groups, respectively. We found them similar in social status, such as gender, age, education level, family size. Differences were found in their social capital. Residents in ERR cases generally had higher social capital than those in PAR, reflected in more devised occupations and smaller economic gaps between groups. In total, 11% of the re-settlers in PAR villages were employed in the secondary and tertiary industries, while those in ERR villages reached 26.8%. Moreover, 20.2% of re-settlers and 24.1% of a local group from ERR villages reported monthly income over 5000 yuan. In contrast, only 5.5% of re-settlers and 30.4% of locals from PAR villages reported the same. Considering ERR projects had an additional working task, higher standard, and challenge, as mentioned in Section 3, the government provided them with more financial and legislative assistance, following “one village, one product” policy contributes to the local industry, narrowing the gap between the two groups. However, in the PAR cases, we observed the lack of employment diversification and the higher exclusive production mode in agricultural family workshops, which resulted in the insufficient integration in local industries and economic activities.
As for the projects, we found that the locals in ERR generally held a more positive view of the project and increased public engagement. In total, 83% of the locals in ERR held a more positive attitude, while 76.9% of the locals in PAR held a neutral opinion. The locals also experienced the earthquake, making them easier to understand the situation for the re-settlers, thus showing a more tolerant attitude toward the possible negative impacts of the project itself. On the contrary, most locals in PAR showed indifference and irrelevance. Moreover, disaster-victims were having a keener desire to the related information. Data shows 64.1% of re-settlers and 89.4% of locals in PAR villages thought about themselves uninformed during the decision-making process, while only 32.1% of re-settlers and 63.0% of locals in ERR villages had no information.
6.2. Influencing social factors
Based on the collected data of personal information and opinion, two multivariate linear regression models were adopted, one for the re-settler group and one for the local group, to determine the relationship between residents’ socioeconomic characteristics and their social isolation degree (SO). We summarized the influencing social factors in by listing the people’s characteristics that were the most likely and least likely to achieve social integration, respectively.
Table 9. Summary of influencing social factors for the local group and re-settler group.
The commonness we summarized for both PAR and ERR is that we found re-settlers who were older adults and lived alone, with low income and substantially decreased asset changes, were least likely to integrate. It demonstrates that the well-being of the aforementioned disadvantaged groups warrants special attention and providing assistance to them is particularly important. Even when the physical relocation initiatives are completed, the focus on these vulnerable populations in community governance must continue. Moreover, re-settlers who thought negatively and uninformed about the project were also found hard to integrate, revealing the importance of wider public participation. As concluded by Iwasawa and Onoda (Citation2016), disseminating information on disaster and reconstruction involves multistakeholders through sharing knowledge such as objective perspectives, the historical background of disaster responses and the reality of reconstruction. This study reveals that ERR cases generally had more intensive public engagement than PAR cases, we assumed this fact as one of the underlying reasons for its better integration performance in Yujia village of enclave type, ERR. It is conducive to ensuring that in the decision-making process, the public service demand orientation should be obtained from the bottom up to make scientific and reasonable arrangements and planning, providing a basic framework for other relocation projects as well.
For PAR, economic equality between the two groups was a big trigger for integration. In PAR, narrowing the economic gap contributed to the integration because middle-aged re-settlers and residents with middle-level income were more likely to integrate. Economic status was the main difference between the locals and re-settlers. When re-settlers achieved a similar higher income level with the locals, economic commonness made them believe that they were accepted by the host society, thus resulting in higher integration. Economic equality is a necessary component of social equality. It is very crucial for them to create a roughly equal community setting in order to mentally elevate themselves out of poverty as soon as possible. As a result, policy formulation and implementation process must be carefully examined and managed to avoid discriminated treatments to the largest extent.
For ERR, improving personal social capital promoted integration, as higher income brought higher integration. In ERR cases, we also found employment, workplace, whether they had been recognized as registered poor, and their physical injury caused by the earthquake were relevant for re-settlers. In terms of employment, for re-settlers engaged in the retail and service, business owners, and those who worked in the local tourism industry, their work required larger scope of interactions, resulting in intensive inter-group interaction and social integration. It demonstrates that enabling victims to recover and improve social capital by providing accessible self-development approaches is of critical urgency and importance. It not only assists them in becoming more economically integrated with local business, but it also speeds up their process of overcoming the physical and mental damages, as well as the social and economic instability following the disaster, allowing them to “build back better.”
7. Spatial factor comparison
What are the spatial factors for SO values? Adapted from Hu and Ubaura (Citation2021a), we summarized eight candidate factors drawing from the previous research. They are 1) SP, obtained through evaluation; home location factors of 2) distance to another group (D2AG), 3) distance to the school (D2S), 4) distance to the public square (D2PS), 5) distance to the main road (D2MR), obtained through measurement along the road path; public facility factors of 6) public square attractiveness (PSA) obtained through a questionnaire; land use factors of 7) building density (BD) and 8) road density (RD) in the close vicinity area through measurement. We built up nine regressions with the above factors: an overall one for all residents and the exceptional cases; the other eight specific ones are for the eight conditions after the adoption of typology and group. By determining the most critical spatial factors that influence SO for different categories, types, and groups, spatial strategies were accordingly proposed, providing the planners with community-level spatial planning suggestions and contributing to social integration.
7.1. Overall factors
Generally, presents that PAR is more influenced by the spatial proximity and the demographic distribution between groups, ERR is more affected by the attractiveness and accessibility to the public square. Judging through the P-value and absolute values of standardized coefficients, for both PAR and ERR, SP and PSA (public square attractiveness) were recognized as the top 2 critical spatial factors. It indicates the importance of demographic distribution and the attractiveness of public space for the common collective relocation projects in rural China. However, the order is a little different. For PAR, SP was of the greatest importance while PSA is the most prominent one for ERR. It indicates that ERR residents had higher psychological demands, thus making public activities, events, and spaces more essential for earthquake victims who suffered physical, mental, and financial loss, to promote public information disclosure, community interaction, and psychological reconstruction (Kobayashi et al. Citation2016). It means that in the ERR projects, more effort should be made regarding the public spaces to aid mental health, including location selection, functional and spatial design, maintenance and operations, and events planning, etc.
Table 10. Overall regression on social isolation degree (SO value) and spatial variables for all residents in A and B.
7.2. Factors for the enclave type
For both PAR and ERR, we recognized the influence of SP and PSA (public square attractiveness) from . The difference is that the factors related to the public square were more significant for ERR than those in PAR. Well-designed and accessible public spaces are critical to relieve the “natural barrier” of the enclave type, which may explain why Yujia village (ERR) had a significantly better integration performance than Xiling village (PAR). We observed that residents who were more attracted by the public square (PSA) and locals who lived closer to it (D2PS) were more integrated. A more attractive public space was built in Yujia village, which contained a tourists center, a Chinese traditional courtyard, and the villagers’ activity center. However, the public square in Xiling village was much smaller, with only several fitness pieces of equipment, which were rarely used. Moreover, Yujia village had an accessible public square located in the buffer area between the enclave and local clusters, which performed as a connection bridge between the two groups; while in Xiling village, it was located in the resettlement entrance but far from the local area, resulting in inconvenience. We suspected that as the enclave cannot easily mix with the local clusters, and more work should be focused on expanding residents’ activity scopes, such as enhancing the public squares by improving its accessibility with an appropriate location that bridge both groups.
Table 11. Regression on social isolation degree (SO value) and spatial variables for enclave type in A and B.
7.3. Factors for the adjacent type
As shown in , the “proximity effect” is highlighted in both PAR and ERR, in which PAR is the proximity with the same group members, ERR is the proximity with other group members. SP plays a more significant role in the case of PAR than ERR. In contrast, the proximity with another group (D2AG) is more influential in ERR. Chaoyang village (ERR) is adjacent by a longer border line, enabling much more intensive inter-group interaction along the borderline area. Thus, the closer to the border, the greater social integration. In contrast, Shenjiayin village (PAR) is adjacent by a connection point, the resettlement was connected by a road, making very few re-settlers lived next door to the locals. Their spatial isolation (SP) indicated by the demographic distribution in the territories reflected their interaction chances better. Reorganize the layout and function of the existing buildings for better utilization of the outdoor and indoor spaces, which may help to achieve a suitable building density within the cluster and promote ingroup interaction. For intergroup proximity, appropriate location, scale, and shape of the new area should be considered to minimize the intergroup social distance.
Table 12. Regression on social isolation degree (SO value) and spatial variables for the adjacent type in A and B.
7.4. Factors for the centralized type
For both PAR and ERR, the importance of public square is emphasized, indicated by the stronger influence of public square attractiveness (PSA) and the distance to public square (D2PS), as shown in . Defined by the natural characteristics of centralized type, a large-sized resettlement occupies in the middle together with designated public facilities. It indicates the importance of the centralized public square’s accessibility and its multi-function and space design to meet various demands. Besides, we also found that Feixian village (ERR) was influenced by distance to the main road (D2MR) while Kongque village (PAR) is not. The importance of appropriate road routing and structure was demonstrated in Feixian village, where the main roads carried a higher pedestrian traffic flow in its centralized tourism-based commercial area, contributing in activating the vitality of the entire community.
Table 13. Regression on social isolation degree (SO value) and spatial variables for the centralized type in A and B.
7.5. Factors for the infill type
For PAR and ERR, traffic related factors and intergroup proximity played vital roles in contributing to the social integration, indicated by the fact that, both cases were substantially influenced by distance to the main road (D2MR) and distance to another group (D2AG). In addition, re-settlers in Yanxilou village (ERR) were more influenced by the road density (RD), considering its courtyard layout of resettlements that 3–5 households as a group; while in Qinjiahe village (PAR), the resettlement is in determinant layout. Traffic can be improved by proposing proper route planning for road networks, increasing road density, and strengthening branch roads to achieve higher road connectivity. To minimize the intergroup distance, the proper location, scale, and shape of the new areas should be considered, and should be evenly mixed with the old areas ().
Table 14. Regression on social isolation degree (SO value) and spatial variables for the enclave type in A and B.
8. Conclusion
Given the usually combined occurrence of disaster recovery and poverty alleviation tasks in the resettlement project, however, very few studies have comprehensively examined the above two categories, thus, may limit the efficiency and performance of the relocation project in many aspects. Our research aims to fill the gaps by a combination study of poverty alleviation relocation (PAR) and earthquake reconstruction relocation (ERR) from a general perspective, as well as a specific perspective in terms of social integration.
Theoretically, by equally focusing on both groups, the re-settler group and the local group, this research helps to assess the relocation projects’ performances in mutual social integration, respectively in the enclave, adjacent, centralized, and infill types, is expected to enhance the understandings of certain bi-directional social issues in a more concrete physical and spatial framework, provides theoretical support for the sustainable development of rural society based on social equality, and contribute to the future establishment of a comprehensive performance assessment system for the similar collective relocation projects.
Practically, by comparing performance among resettlement types, the study contributes to the perfection of the working route in different phases to fully achieve social integration and enable the true success of collective relocation projects. While deciding on resettlement types and relocation destinations, the study provides planners with concrete proposals and community-level spatial layout strategies throughout the planning stage. Following the completion of the project, it assists them in evaluating the potential social impact, anticipating obstacles, and becoming more prepared and focused on critical tasks in long-term community governance and spatial improvement.
Firstly, we made a general comparison between PAR projects and ERR projects regarding implementation area, mode adoption, construction content, public engagement, and challenge. We found ERR generally more challenging, considering it had a higher construction standard and additional focus on safety and disaster resistance, higher public engagement, and extra difficulty of psychological reconstruction.
Secondly, we compared social isolation (SO) and spatial isolation (SP) in the common type and help planners predict and clarify the social impact of the chosen type. We found that ERR were significantly less socially and spatially isolated than PAR in the enclave type; the other three types were found similar in SO. Centralized and infill types could encourage integration, hence, were recommended to deal with different land-use conditions. The enclave type was the most spatially and socially isolated type. Thus it was suggested as the last alternative but still feasible if there are some pressing concerns.
Thirdly, we compared the social influencing factors for SO. We found PAR and ERR are similar in social status, such as gender, age, education level, family size. Differences were found in their social capital that residents in ERR cases generally had higher social capital than those in PAR and a narrower gap between the two resident groups. As for the projects, we found the locals’ opinions toward the projects in ERR were more positive, in contrast with the locals’ indifference and irrelevance to the project in PAR. For both PAR and ERR, we found re-settlers who were older adults and lived alone, with low income and substantially decreased asset changes, were least likely to integrate. This shows that the well-being of the vulnerable groups deserves special attention, and assistance to them is critical. For PAR, economic equality between the two groups was a big trigger for integration. Middle-aged re-settlers, residents with middle-level income were more likely to integrate, indicating that narrowing the economic gap to achieve the biggest commonness between the locals and re-settlers contributed to the integration. Therefore, equality for economic activities such as employment opportunities and access to public well-being will be the critical point. For ERR, the improvement of personal social capital directly promoted integration. Higher income and higher engagement in the local industry brought higher integration. Therefore, the support for the long-term development of the local cooperative industry that improves the income is of great importance.
Finally, we compared the spatial influencing factors for SO, and summarize the critical spatial factors to be prioritized in relocation projects while plannings. We conclude that PAR was more influenced by the spatial proximity and the demographic distribution between groups. Meanwhile, ERR was more affected by the attractiveness and accessibility to the public square considering that earthquake victims in ERR generally had higher psychological demands than average poor households in PAR. For the enclave type, the factors related to the public square was more significant for ERR than those in PAR We assumed that well-designed and located public spaces could be the critical point to relieve the “natural barrier” of the enclave type. For the adjacent type, the “proximity effect” was highlighted, in which PAR is the proximity with the same group members, and ERR was the proximity with other group members. For the centralized type, the importance of the public square was emphasized in both PAR and ERR. It was indicated by the stronger influence of public square attractiveness and the distance to the public square. For the infill type, both PAR and ERR, the road routing and structuring were important in contributing the social integration acting as a communication channel, indicated by the distance to the main road influenced both PAR and ERR cases.
While we picked only eight examples to represent the four types in two categories, we must acknowledge that some factors, such as the cases’ distinctive qualities, influenced the outcomes. With the limited case for each type and category, we need to specify that the condition in the real projects should be considered individually and comprehensively. Further research cases will enrich the results, experiences, and measures for each type.
Besides, this study only focused on the social integration study at a given point of time, we expect the future study can reveal longer-term evolutionary patterns through a period of observation, such as conducting follow-up surveys lasting a few years. We think it may be helpful to explore this issue from a sustainable development perspective and to provide more reliable planning suggestions for the decision-makers.
In addition, we hope to explore this issue in different regions and even countries with different social, economic, and cultural backgrounds in future studies. At a macro level, if the local policy and political and economic environment can be taken into account more comprehensively, hopefully, the study can provide us with more referable and expandable research results, and it would be beneficial to improve the utility of this study and provide a broader reference for broader types of cases in different physical, economic and social settings.
Disclosure statement
No potential conflict of interest was reported by the author(s).
Correction Statement
This article has been republished with minor changes. These changes do not impact the academic content of the article.
Additional information
Funding
References
- Akerkar, S., and M. Fordham. 2017. “Gender, Place and Mental Health Recovery in Disasters: Addressing Issues of Equality and Difference.” International Journal of Disaster Risk Reduction 23: 218–230. doi:10.1016/j.ijdrr.2017.03.014.
- Alba, R., and V. Nee. 1997. “Rethinking Assimilation Theory for a New Era of Immigration.” International Migration Review 31 (4): 826–874. doi:10.1177/019791839703100403.
- Alexander, D. 2012. “What Can We Do about Earthquakes? Towards a Systematic Approach to Seismic Risk Mitigation.” 2012 NZSEE Conference, Christchurch, New Zealand.
- Cernea, M. 2002. Impoverishment Risks Livelihood Reconstruction: A Model Resettling Displacement and Resettlement, 11–55. World Bank.
- Dunford, M., and L. Li. 2011. “Earthquake Reconstruction in Wenchuan: Assessing the State Overall Plan and Addressing the ‘Forgotten Phase’.” Applied Geography 31 (3): 998–1009. doi:10.1016/j.apgeog.2011.01.001.
- Gao, X., T. Chen, and J. Fan. 2010. “Population Capacity in the Wenchuan Earthquake Reconstruction Areas.” Acta Geographica Sinica 65 (2): 164–176.
- Gould, C. W. 2009. “The Right to Housing Recovery after Natural Disasters.” Harvard Human Rights Journal 22 169–204 .
- HIC. 2005. “Post-tsunami Relief and Rehabilitation: A Violation of Human Rights (Fact Finding Mission Report No. 8).” New Delhi, India: Habitat International Coalition.
- Hirayama, Y. 2000. “Collapse and Reconstruction: Housing Recovery Policy in Kobe after the Hanshin Great Earthquake.” Housing Studies 15 (1): 111–128. doi:10.1080/02673030082504.
- Hu, W., and M. Ubaura. 2021a. “A Study on Social Integration after Collective Relocation Projects for Poverty Alleviation in China (Part 1): Focusing on Spatial and Social Isolation.” Journal of Architecture and Planning 86 (781): 925–935. doi:10.3130/aija.86.925.
- Hu, W., and M. Ubaura. 2021b. “A Study on Social Integration after Collective Relocation Projects for Poverty Alleviation in China (Part 2): Focusing on Spatial and Social Isolation.” Journal of Architecture and Planning, AIJ 86 (789): 2473–2484. doi:10.3130/aija.86.2473.
- Huang, Q. H., M. C. Li, Z. J. Chen, and F. X. Li. 2011. “Land Consolidation: An Approach for Sustainable Development in Rural China.” Ambio 40: 93–95.
- Iwasawa, T., and Y. Onoda. 2016. “The Importance of Local Oriented Dissemination of Reconstruction: The Design of Tohoku Reconstruction & DRR Pavilion.” Journal of Disaster Research 11 (3): 504–511. doi:10.20965/jdr.2016.p0504.
- Jia, H., F. Chen, D. Pan, and C. Zhang. 2018. “The Impact of Earthquake on Poverty: Learning from the 12 May 2008 Wenchuan Earthquake.” Sustainability 10 (12): 4704. doi:10.3390/su10124704.
- Kobayashi, T., Y. Onoda, K. Hirano, and M. Ubaura. 2016. “Practical Efforts for Post-Disaster Reconstruction in the City of Ishinomaki, Miyagi.” Journal of Disaster Research 11 (3): 476–485. doi:10.20965/jdr.2016.p0476.
- Kongjian, Y., X. Liang, L. Qing, L. Wenjin, and L. Dihua. 2008. “Post Quake Resettlement Scenarios: With a Case Study of Sichuan Wolong Special Administrative Region.” New Architecture 4: 76–79.
- Lo, K., and M. Y. Wang. 2018. “How Voluntary Is Poverty Alleviation Resettlement in China.” Habitat International 73: 34–42. doi:10.1016/j.habitatint.2018.01.002.
- Long, H., and Y. S. Liu. 2016. “Rural Restructuring in China.” Journal of Rural Studies 47: 387–391. doi:10.1016/j.jrurstud.2016.07.028.
- Massey, D. S., and N. A. Denton. 1988. “The Dimensions of Residential Segregation.” Social Forces 67 (2): 281–315. doi:10.2307/2579183.
- Moltchanova, E., N. Khabarov, M. Obersteiner, D. Ehrlich, and M. Moula. 2011. “The Value of Rapid Damage Assessment for Efficient Earthquake Response.” Safety Science 49 (8): 1164–1171. doi:10.1016/j.ssci.2011.03.008.
- Peng, Y. 2013. “Decision Model for Developing Concentrated Rural Settlement in post-disaster Reconstruction: A Study in China.” Ph.D. thesis, Hong Kong Polytechnic University, Hong Kong.
- Pitchett, L., A. Suryahadi, and S. Sumarto 2000. “Quantifying Vulnerability to Poverty: A Proposed Measure, Applied to Indonesia, Policy Research Working Paper.” No. 2437. Washington: World Bank.
- Rawal, V., J. Bothara, P. Pradhan, R. Narasimhan, and V. Singh. 2021. “Inclusion of the Poor and Vulnerable: Learning from post-earthquake Housing Reconstruction in Nepal.” Progress in Disaster Science 10: 100162. doi:10.1016/j.pdisas.2021.100162.
- Schnell, I., and B. Yoav. 2001. “The Sociospatial Isolation of Agents in Everyday Life Spaces as an Aspect of Segregation.” Annals of the Association of American Geographers 91 (4): 622–636. doi:10.1111/0004-5608.00262.
- Strömberg, D. 2007. “Natural Disasters, Economic Development, and Humanitarian Aid.” Journal of Economic Perspectives 21 (3): 199–222. doi:10.1257/jep.21.3.199.
- Sun, M. J., B. F. Chen, J. Z. Ren, and T. T. Chang. 2010. “Natural Disaster’s Impact Evaluation of Rural Households’ Vulnerability: The Case of Wenchuan Earthquake.” Agriculture and Argricultural Science Procedia 1: 52–61. doi:10.1016/j.aaspro.2010.09.007.
- Tan, X. W. 2019. “The Evolvement of Poverty Alleviation for Resettled People in 70 Years: From 1949 to 2019.” Chinese Rural Economy 8 1–17 http://rdi.cass.cn/rdi_cssn_yjcg/201911/P020191115543950703436.pdf . (in Chinese).
- Terminski, B. 2013. Development-induced Displacement and Resettlement: Theoretical Frameworks and Current Challenges. Swizerland: University of Geneva.
- Wisner, B. 1998. “Marginality and Vulnerability: Why the Homeless of Tokyo Don’t ‘Count’ in Disaster Preparations.” Applied Geography 18 (1): 25–33. doi:10.1016/S0143-6228(97)00043-X.
- Yang, T. T., L. Wang, and L. F. Huang. 2020. “Comparing Three Approaches to Developing Concentrated Rural Settlement after the Lushan Earthquake.” Safety Science 125: 104624. doi:10.1016/j.ssci.2020.104626.
- Yang, Y. Y., A. Sherbinin, and Y. Liu. 2020. China's Poverty Alleviation Resettlement: Progress, Problems and Solutions, 102135. Vol. 98. Habitat International.
- Yang, Y. Y., A. Sherbinin, and Y. Liu. 2020. “China’s Poverty Alleviation Resettlement: Progress, Problems and Solutions.” Habitat International 98: 102135. doi:10.1016/j.habitatint.2020.102135.
- Zhen, X. Y. 2019. Evaluation of the Effects of Targeted Poverty Alleviation Policies. China: National Institute of Development and Strategy, Renmin University of China. (in Chinese).
- Zhou, Y., Y. Z. Guo, Y. S. Liu, W. X. Wu, and Y. R. Li. 2018. “Targeted Poverty Alleviation and Land Policy Innovation: Some Practice and Policy Implications from China.” Land Use Policy 74: 53–65. doi:10.1016/j.landusepol.2017.04.037.
- Zhou, W., Z. Ma, S. Guo, X. Deng, and D. Xu. 2021. “Livelihood Capital, Evacuation and Relocation Willingness of Residents in earthquake-stricken Areas of Rural China.” Safety Science 141: 105350. doi:10.1016/j.ssci.2021.105350.