
 ?Mathematical formulae have been encoded as MathML and are displayed in this HTML version using MathJax in order to improve their display. Uncheck the box to turn MathJax off. This feature requires Javascript. Click on a formula to zoom.
ABSTRACT
Residential visual privacy is an important issue in modern society. This paper proposes an improved Potential Visual Exposure Index (I-PVEI) to evaluate the privacy risks of visual exposure along building facades in a dense residential environment. Compared with the PVEI indicator, the proposed method introduces the observer’s view direction based on visual perception and applies a weighting scheme to construct the I-PVEI. To validate the I-PVEI, a case study with a neighborhood located at the center of Kowloon, Hong Kong, was evaluated. The results demonstrate: (1) Potential observers from building and pedestrian levels had different impacts on the neighborhood, resulting in different I-PVEI distribution patterns on the building facades; (2) Although significant changes of I-PVEI value could be found across building facades, I-PVEI values always presented a uniform change trend on the same façade; (3) The quantitative indicator can perceive subtle privacy risks of openings located at the corner of the building, which was overlooked by the PVEI. The results indicate that the proposed I-PVEI can be an optional indicator for the assessment of residential visual privacy in urban planning and building design.
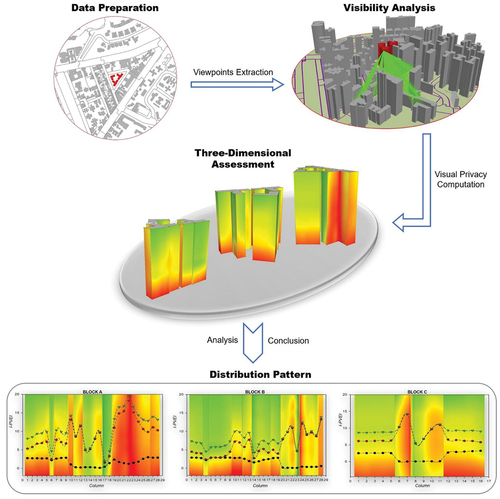
Graphical Abstract
1. Introduction
As a critical concern in urban planning, the quality of the residential environment has long been investigated from various domains (Lang et al. Citation2018). Fundamentally, a sustainable urban environment should balance building morphology and daily activities in neighborhoods (Dempsey Citation2008). However, the rapid growth of the urban population and the expansion of urbanization in the past decades have caused many environmental and social problems (Stone Citation2008; Lan et al. Citation2021), which have had a negative impact on the residential quality of life. Although great efforts have been made to study residential environments, such as daylight and sunlight (Jones et al. Citation2004; Asl and Safari Citation2020; Wang, Wei, and Ruan Citation2020), indoor and outdoor ventilation (Wang and Wong Citation2007; Wang and Malkawi Citation2019; Dai et al. Citation2022), residential thermal comfort (Pan et al. Citation2019; Chai et al. Citation2020; Li, Zhang, and Zhao Citation2021) and quality of the view-out (Yu et al. Citation2016; Chang and Park Citation2018; Motevalian and Yeganeh Citation2020), many problems still need to be explored and controlled at an early stage before environmental deterioration.
As a basic right of every person (Heydaripour et al. Citation2017), residential visual privacy has not yet attracted enough attention. With the continuous improvement of people’s living standards, the primary expectations of urban residents are shifting from basic needs to quality of life (Yu et al. Citation2016). As such, although the desired level of visual privacy differs among cultures (Tomah Citation2012), visual privacy is necessarily needed at every scale (Newell Citation1995). It is defined as the ability to perform daily activities at home without being observed by outsiders, including neighbors and passersby (Kodmany Citation1999). As a form of expression in the damage of visual privacy, the phenomenon of peeping through windows can be found in daily news now and then and has been widely existed in urban life across countries and cultures. And yet, the issue continues and is even worsening in modern cities with the urban centralization and population aggregation. Although it is closely related to social behavior (Traver Citation1976), individual psychology (Hwang and Lee Citation2017), residential satisfaction (Kodmany Citation1999; Ibem and Aduwo Citation2013) and crime (Newell Citation1995), residential visual privacy, has not been adequately addressed in past decades (Zheng et al. Citation2021).
In this context, evaluating visual privacy has become an important task in resolving conflicts between neighbors and improving the environmental quality of urban residents (Hwang and Lee Citation2017). Residential visual privacy, often regarded as visual exposure to outsiders in the built environment (Pinsly, Gewirtzman, and Burt Citation2007), can be quantitatively evaluated based on the visibility analysis. Four methods can be used to conduct visibility analysis between observers and targets, including isovist analysis (Benedikt Citation1979), Visibility Graph Analysis (VGA) (Turner et al. Citation2001), Asymmetry in Single Visual Interaction (ASVI) (Huangfu, Ostwald, and Chung Citation2021) and Geographical Information System (GIS)-based intervisibility (De Floriani and Magillo Citation1999). Specifically, an isovist is a closed 2D polygon and defined as the field of view available from a given vantage point. Unlike the isovist, VGA uses various measures to analyze the intervisibility connections through the construction of a visibility graph within buildings or urban networks. ASVI can be applied to measure the asymmetry of every realizable visual connection, and GIS-based intervisibility allows to generate visible sightlines with attributes of the azimuth, vertical angle and sightline length between the target and observer. For instance, Hwang and Lee (Hwang and Lee Citation2018) proposed an indicator, namely, the refuge area ratio (RAR), to indicate the level of visual privacy based on a visual simulation and numerical measurement. Lonergan et al. (Lonergan and Hedley Citation2015) applied 3D isovists to study the potential visibility between two neighboring buildings and measured relative urban privacy based on the overlay of multiple targeted isovists. Moreover, Shach-Pinsly et al. (Pinsly, Gewirtzman, and Burt Citation2007) introduced an evaluation method to rank the level of visual exposure on various building morphologies by calculating the distance and number of visible sightlines between the target and observer. However, these methods are mainly adopted to study the quality of the view-out from the perspective of residents or to explore indoor visibility for the optimization of interior design; little attention has been directed toward investigating the risks of visual damage from outsiders to residents. Most recently, Zheng et al. (Zheng et al. Citation2021) argued that urban privacy can be determined by several variables, including view direction, view distance and window area et al., and proposed a quantitative indicator, the Potential Visual Exposure Index (PVEI), to measure the residential visual privacy of each opening through a GIS-based intervisibility method. However, the impact of view direction on visual privacy is limited in the perspective of the target, and does not take into account the difference in the relative orientation of the building façade between the observer and the target, causing lower accuracy representation of visual privacy in certain openings.
In this paper, we propose an improved PVEI (I-PVEI) to explore and evaluate visual privacy based on human visual perception. The I-PVEI can accurately detect the changes from both horizontal and vertical dimensions of visual privacy, thereby reflecting how the building morphology had an impact on residential visual privacy in spatial order.
2. Method
2.1. Overview of the PVEI
To quantify residential visual privacy, Zheng et al. (Zheng et al. Citation2021) proposed an indicator, PVEI, which can be summarized as follows.
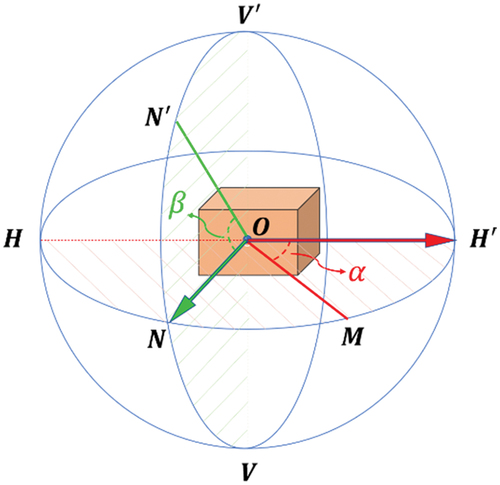
The PVEI of a building opening, is defined as the visual intrusion of the observers from the pedestrian activity space and building facades to the target. The value of PVEI is determined by the distribution of potential observers, including the visual direction, visual distance and area of openings where the observer and target are located. The larger the PVEI value, the worse the visual privacy. As shown in , the sightline is formed between the target and an observer based on the visibility, where represents the sightline length,
and
are the area of openings where the target and observer are located, respectively; and
and
are the horizontal and vertical angles, respectively.
Figure 1. Sightlines between the target and a potential observer.
According to Zheng et al. (Zheng et al. Citation2021), the PVEI can be quantified as follows:
The distance decay concept that visible objects are inversely proportional to the squared distance, has been widely applied in visual-related matters (An, Ko, and Kim Citation2015; Tara, Lawson, and Renata Citation2021). In addition, the larger area of a target or an observer, the higher the possibility of being visually incursive or achieving visual penetration, and both result in worse privacy. Thus, the functions of the area and visual distance can be expressed as EquationEquation. (2)(2)
(2) . In addition, the greatest risks of visual privacy can be created when the horizontal angle,
, equals
or the vertical angle,
, approaches 0 between an object and the target, so the horizontal and vertical angles can thus be expressed as EquationEquations. (3)
(3)
(3) and (Equation4
(4)
(4) ), respectively.
As such, the PVEI of each building opening can be quantified as follows:
As the PVEI of each opening is determined by all potential observers from both the building level and pedestrian level based on the visible sightlines, it can thus be defined as
where ;
;
is the visual privacy of the
opening;
is the area of the
target;
is the area of the
target; and
is the distance from the
target to the
observer, and ranges from 0 to the maximum view distance (
). A detailed description of the PVEI can be found in (Zheng et al. Citation2021).
Note that EquationEquations. (3)(3)
(3) -(Equation4
(4)
(4) ) are geometry-based approaches from the perspective of the target. As shown in , the sightlines
and
, formed between the target and observers, are both perpendicular to the target façade. According to EquationEquation. (3
(3)
(3) ), both observers
and
are considered as being at the same level of intrusive risk to the target. A similar issue can be found from the vertical dimension.
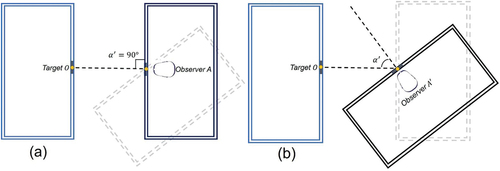
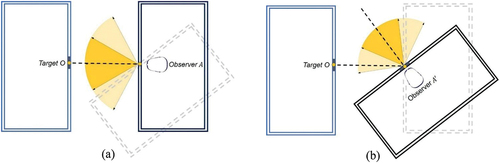
Figure 2. Top view (a) Observer directly against to the target; (b) an angle formed by the building facades.
Although observers and
are in exactly the same position, the difference in the relative orientation of the building façade between the observers and the target creates the differentiation of visual damage to the target. For instance, when people stand at the window aimlessly, their eyes will naturally focus on the targets in front of them. Compared with targets located at the visual center of the observer, targets located far away from the visual center of the observer are considered to have a lower level of privacy risks. Apparently, the visual damage of sightlines OA and OA’ to the target O should be distinguished, which cannot be detected by the PVEI. As this issue can be widely observed in the built environment, we attempted to identify and quantify this difference based on the observer’s visual perception for the evaluation of visual privacy.
2.2. Human visual perception
The perception of residential facades is regulated by human vision limits (Tara, Lawson, and Renata Citation2021), which are critical to measuring visual privacy in urban environments. The horizontal Field of View (FOV) of a steady gaze from both human eyes is considered to be (Panero and Zelnik Citation1979). The central FOV for most people covers an angle of
. Within this range, both eyes can observe a target simultaneously. The eyes’ ability to notice changes in the environment decreases as the distance from the central FOV increases (Tretten Citation2008). This means that targets beyond
are not clearly seen and are much more difficult to be noticed when they are beyond
. As such, two levels of visual perception corresponding to different horizontal angles can be defined. From
to
, targets in this range can be clearly seen and regarded as the most distinguished by the observer, followed by the ranges of
to
and
to
.
Similarly, in the vertical FOV, the limits for visually capturing objects above the standard light of sight is and below the standard light of sight is
(Tara, Lawson, and Renata Citation2021). The upper limit of color discrimination is
from the standard line of sight, while it is
from the same axis for the lower area. Any target beyond those stead gazes of both horizontal and vertical FOV requires the head rotation to be seen. Accordingly, there are three levels of visual perception corresponding to various ranges of vertical angle in the vertical dimension, as shown in . For the evaluation of visual privacy in this study, visual damage to the residents was considered as the naturally visual invasion by observers for non-special purpose. Thus, those targets that require the head rotation of the observer to be seen were considered beyond the visual perception of the observer. In this context, we attempted to adopt this concept for the computation of I-PVEI.
Figure 3. Human field of vision (a) horizontal angle of view, and (b) vertical angle of view.
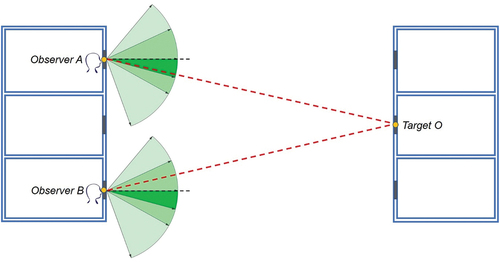
2.3. The formulation of I-PVEI
As shown in ), the two-building facades toward each other can create a direct sightline between the target and observer, which means that the target is at the greatest risk of privacy damage by Observer A. In contrast, when the two-building facades are formed to an angle , the target locates at the second level of horizontal FOV, as shown in ). Accordingly, a similar phenomenon can be found in the vertical FOV (). The perceived environment can be increased with the extension of FOV, but attention will be less focused (Florio Citation2018). As such, we can redefine the impact of view direction on the derivation of PVEI, as expressed in EquationEquations. (7)
(7)
(7) and (Equation8
(8)
(8) ).
Figure 4. FOV of the observer in the horizontal dimension (Top view).
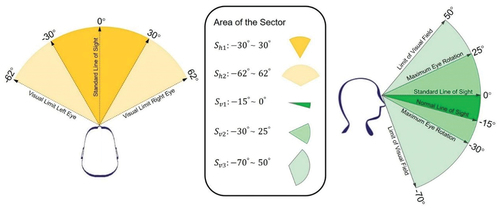
Figure 5. FOV of the observer in the vertical dimension (Side view).
where and
are the horizontal and vertical angles, respectively;
represents the weight in the horizon based on
; and
represents the weight in the vertical based on
.
To determine and
, we compared and calculated the area of Sectors in one’s FOV (). In the horizontal FOV, two levels of FOV correspond to two Sectors. The primary FOV (
to
) corresponds to the area of Sector
, and the second level of FOV corresponds to the area of Sector
. Accordingly,
can be expressed as EquationEquation. (9)
(9)
(9) :
Similarly, can be expressed as EquationEquation. (10)
(10)
(10) :
Therefore, the formular of I-PVEI can be expressed as EquationEquation. (11)(11)
(11) :
Concerning the total visible sightlines of observers from both the building level and pedestrian level in the built environment, the I-PVEI of each opening can thus be defined as
3. Case study
3.1. Description
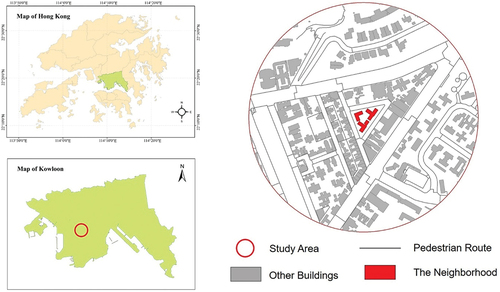
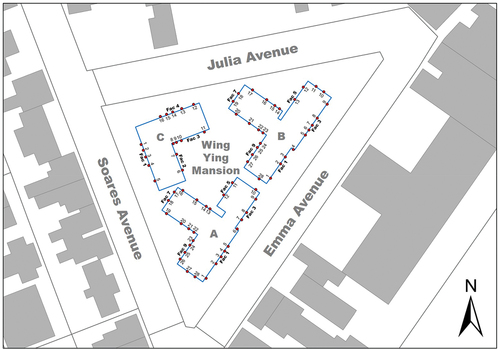
Hong Kong is a high-rise high-density city located on the coastline of southeast China with an average altitude of 8 m (Chen et al. Citation2012). As one of the most densely populated cities in the world, Hong Kong has long been a hotspot in research on various environmental issues (Tang et al. Citation2019). Located at the northern part of Hong Kong Island, Kowloon has its 2.2 million inhabitants scattered in around 47 of developed land (Census and Statistics Department Citation2017). The neighborhood, located at the central heart of Kowloon, including three blocks with 17 typical floors of each, is surrounded by high-rise high-density buildings and was thus selected for the risk evaluation of residential visual privacy. Accordingly, to fully realize the residential visual privacy of the neighborhood, the region with a radius of 200 m centered on the neighborhood was determined as the study area, as shown in .
Figure 6. Location of the neighborhood, Kowloon, Hong Kong, China.
3.2. Data preparation and analysis
Three core datasets, including the 1:1000 Topographic Map (Hong Kong Geodata Store Citation2021a), 3D Pedestrian Route (Hong Kong Geodata Store Citation2021b) and 3D Photo-Realistic Model (Hong Kong Geodata Store Citation2021c) were freely downloaded online and organized in this study. The 3D Photo-Realistic Model was adopted to identify all the building openings in the study area, including the neighborhood (). The 3D Pedestrian Route was used to extract the potential observers of the passersby. The Topographic Map was used to extract the 2D building footprint with the elevation information, and could then be converted into a 2.5D model for visibility analysis. Note that potential observers at building level were distributed in accordance with the building openings, and observers at pedestrian level were evenly distributed (an interval of 2 m) along the sidewalk at a viewing height of 1.5 m. Further details on methodological procedures and hypotheses assumed in this study can be found in (Zheng et al. Citation2021).
Figure 7. Building outlines (red dots represent the openings along the building facades).
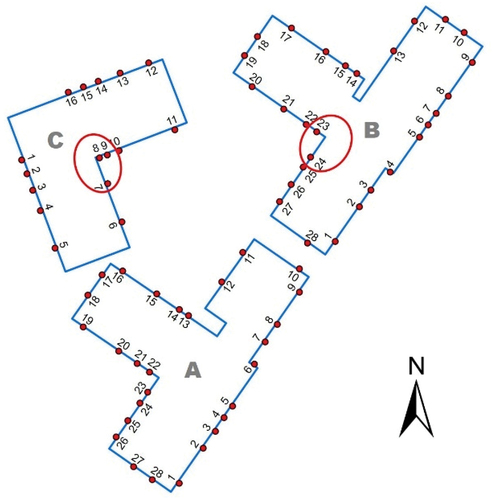
The neighborhood, located in a highly dense built environment, namely, Ming Ying Mansion, was built in 1964 and is surrounded by the streets of Julia Avenues, Emma Avenues and Soares Avenues. Three buildings are located in this neighborhood, with 17 typical floors in each building. Block A and Block B share a similar building layout, while Block C is quite different from them, as shown in . Block A and Block B have 28 openings on each floor, while 16 openings can be detected on each floor of Block C. The details of the openings on each building façade can be found in .
Table 1. Openings and facades of each block.
3.3. Procedure of I-PVEI computation
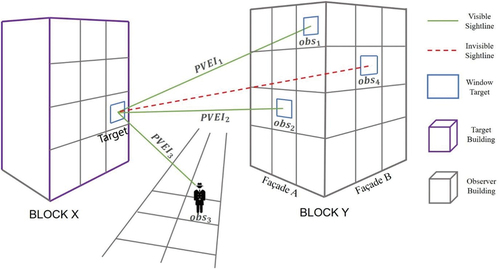
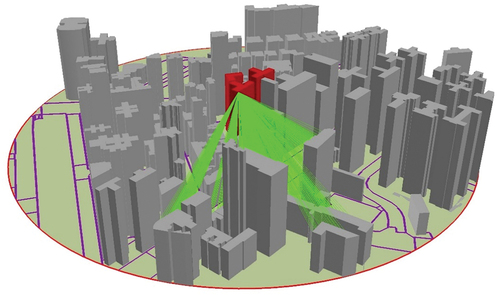
Three steps were required for the I-PVEI computation in this study. First, potential observers at the building level and pedestrian level were extracted from the 3D Photo-Realistic Model and Pedestrian Route, respectively. Target points were detected from the neighborhood, resulting in 1224 point-features in total. Next, by integrating various datasets into the same layer, the functions of Construct sightline and Intervisibility analysis were adopted to form and identify visible sightlines () with the platform of ArcGIS Pro, Esri. As such, all the visible sightlines could then be extracted with attributes of the vertical angle, azimuth, and sightline length at both building level and pedestrian level. Finally, the proposed quantitative model was applied to calculate the I-PVEI value of each opening.
Figure 8. Visible sightlines between a target and potential observers.
4. Results
4.1. Distribution patterns of visual privacy
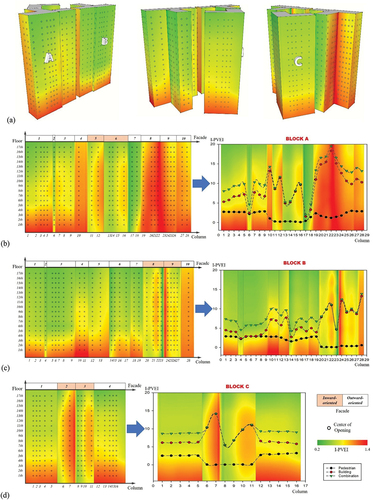
The distribution pattern of visual privacy was presented on a three-dimensional model ()). To better understand detailed changes of the I-PVEI value along the building facades, the statistical and visualized results were overlayed, as shown in ).
Figure 9. I-PVEI values shown with (a) a three-dimensional model in various views, and (b) overlaying numerical values of each column and visualized results of each facade.
In general, the I-PVEI of each column is mostly contributed by the observers at the building level. Although the observers at the pedestrian level may contribute the most to the I-PVEI of certain openings, it is limited to lower floors (lower than the 5th floor, actually) in this study. The pattern with the highest value of I-PVEI on the middle floor can be observed on several facades, including Facades A5, A6, B8, B9, C2 and C3, which are all orientating to the internal space of the neighborhood (see ). The openings on these facades are minorly influenced by the observers at the pedestrian level. As such, we conclude that the visual exposure of the building façade facing the internal space of the neighborhood comes primarily from the observers at the building level, thus the highest risks of visual privacy can be found on the middle floor. As the floor rises or falls from the middle floor, the privacy risk gradually decreases. However, the façade toward the external environment is affected by both the building and pedestrian levels, which shows that the distribution pattern of the I-PVEI value gradually decreases as the floor rises.
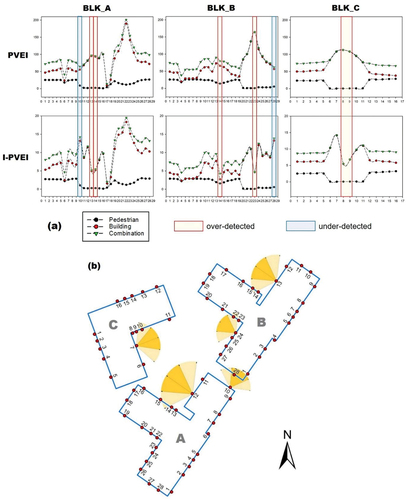
In addition, although significant changes in the I-PVEI value can be observed along the building facades, the I-PVEI values always show a uniform change pattern on the same façade. In other words, the change pattern allows for identifying which openings are included within the same façade. Nevertheless, exceptional columns can be found with the change of the I-PVEI. For instance, on the Façade B8, the I-PVEI of Column B8-23 is significantly lower than that of the rest of the columns. This is because Column B8-23 is located at the edge of Façade B8, which avoids the large amount of visual damage from Façade B9, resulting in much lower I-PVEI values compared to B8-20, B8-21 and B8-22. In other words, the I-PVEI value of the opening located at the corner of the building façade can be significantly different from other openings on the façade from the column dimension. A similar phenomenon can be found on Façade B6, where the I-PVEI values of Column B6-14 and B6-17 are both far lower than that of Column B6-15 and B6-16. Specifically, the situation of Column B6-14 is the same as that of Column B8-23, which is caused by the significant reduction in visible sightlines from the adjacent façade. Although Column B6-17 is as visually exposed to the adjacent façade as Column B6-15 and Column B6-16, the larger view distance between Column B6-17 and its adjacent façade leads to the lower I-PVEI value of this column.
Moreover, a few facades present unusual I-PVEI values, so the following can be concluded:
Extremely low values of I-PVEI can be observed on Façade 7, as shown in ). This is because the specific orientation of the building façade blocks most of the visual damage at the building level and pedestrian level.
Extremely high values of I-PVEI can be found on Façade A8 and A9. As both of them are orientating to the open space, a large number of visible sightlines can be created by potential observers at the building level and pedestrian level. Moreover, visual damage from each other makes the situation even worse.
The high values of I-PVEI can be found on both Façade A4 and B10, where Column A4-10 and B10-28 are directly facing each other at a close distance, resulting in a large amount of visual damage from each other. Also, both Façade C2 and C3 are at a high level of privacy risk from Façade A5, causing the high I-PVEI values for those two facades.
4.2. Comparison between PVEI and I-PVEI
To validate the performance of the PVEI and I-PVEI, numerical results of the visual privacy were both calculated and compared from the floor (horizontal) and column (vertical) dimensions.
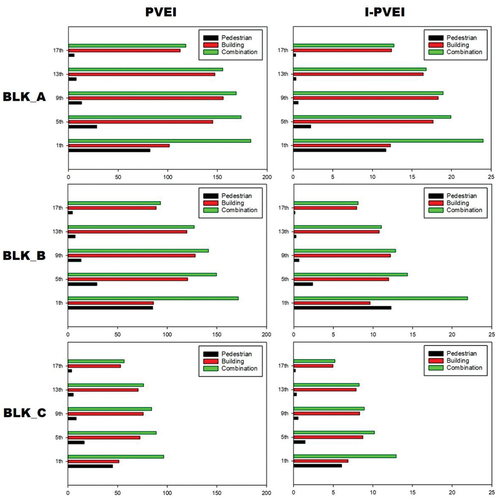
In the horizontal (floor) dimension, as shown in , the same trend of privacy distribution can be found from the computational results of PVEI and I-PVEI. That is, the level of visual privacy contributed by the building level (red bar) results in the highest value (greatest risk of visual privacy) on the middle floor and gradually decreases as the floor rises or decreases. Moreover, potential observers at the pedestrian level (black bar) create the greatest risk of visual privacy on lower floors and gradually decrease as the floor rises. Note that in the horizontal dimension, the smaller number of openings in Block C (16) causes the total values of I-PVEI to be systematically less than those of Block A (28) and B (28). As a result, two patterns of the visual privacy distribution with all the building facades can be found from both PVEI and I-PVEI results; that is, the greatest risks of visual privacy can be observed on either the middle floor or the lowest floor.
Figure 10. Comparison between PVEI and I-PVEI from the floor dimension (Only Floors 1, 5, 9, 13 and 17 are listed here).
Further, we conducted the investigation on each opening from the vertical dimension (column) to compare the performance of PVEI and I-PVEI, as shown in .
Figure 11. Comparison between PVEI and I-PVEI from the column dimension (a) numerical comparison and (b) visual perception of observers at particular locations.
Although the numerical results of PVEI and I-PVEI are under different dimensions, we could still compare the performance between the PVEI and I-PVEI methods based on the trends of their numerical results. As shown in ), tremendous changes in privacy risks can be found with building facades from both the PVEI and I-PVEI results. Notably, for the entire neighborhood, the PVEI and I-PVEI values for each column present a consistent trend in visual privacy at the pedestrian level, indicating that the overall difference between PVEI and I-PVEI results is due to privacy varying at the building level.
At the building level, although the results of PVEI and I-PVEI are similar in tendency, significant differences can be found in several columns, such as Column A4-10, A6-13, A6-14, B6-14, B8-23, B10-28, C3-8 and C3-9, as highlighted in ). According to the result of PVEI, Column A6-13, A6-14, B6-14, B8-23, C3-8 and C3-9 are facing at a high level of privacy risks as their neighbors. From the result of I-PVEI, however, those columns are more preserved in visual privacy compared to their neighbors. As shown in ), Column A6-13 and A6-14 are located at the corner of Façade A6, and Column A5-11 and A5-12 belong to their adjacent Façade A5. Considering the façade orientation where Column A5-12 is located, observers from Column A5-12 can barely notice the targets on Column A6-13 in reality. However, the PVEI method still includes the visual impact from Column A5-12 and considers it as the greatest risk of visual intrusion for Column A6-13, as Column A5-12 is the closest to Column A6-13. With the method of I-PVEI, in contrast, Column A6-13 is not visually exposed to Column A5-12 even though it is close to Column A5-12, according to the horizontal FOV ( to
) of one’s visual perception ()). Thus, a lower level of privacy risk on Column A6-13 can be obtained compared to Column A6-15 or A6-16. Similar cases can be found on Columns A6-14, B6-14, B8-23, C3-8 and C3-9, which are all over-detected in privacy risk by the method of PVEI. Moreover, Columns A3-10 and B10-28 are under-detected for the privacy risks by the PVEI. As the two columns are close and directly face (
) each other, their visual privacy is greatly affected by each other and should be at high risk, as demonstrated by the I-PVEI method.
In summary, the various orientations of building facades in the built environment create a variety of intervisibility levels between observers and targets. Owing to the combined effects of visual intrusion from potential observers in various directions, the phenomenon of significant differences of the visual privacy can be widely observed among the targets on the same building façade. Specifically, those observers can have an insignificant visual impact on the targets located at the corner of the façade, but may highly influence the others on the façade. The phenomenon is not well-detected by the PVEI, which creates the over-detection or under-detection issues for the quantification of visual privacy. The I-PVEI, however, adequately takes this phenomenon into consideration based on perceptual vision, and can thus solve the over-detection and under-detection issues. Therefore, it is concluded that the privacy risks of visual privacy can be better represented and realized based on the result of I-PVEI, which can also well reflect the characteristics of the building environment where the target is located.
4.3. Change of I-PVEI with a newly built dwelling involved
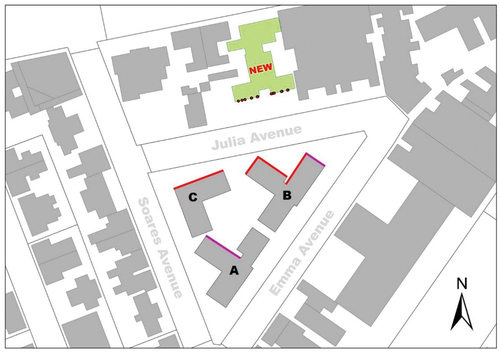
To investigate I-PVEI changes in the neighborhood by including a newly built dwelling in the built environment (as shown in ), we calculated the original and updated I-PVEI values for comparison. The newly built dwelling, namely, 3 Julia Avenue, located at 116 Argyle Street, Ho Man Tin, Kowloon, was built in 2015 with 24 typical floors.
Figure 12. Newly built dwelling in the study area.
It is to be expected that the main I-PVEI changes should be found on the facades that are mostly close to the newly built dwelling (red line in ). In addition, the building facades (purple line) that are orientated to the newly built dwelling detect the changes in I-PVEI values as well. Overall, building facades including A6, B4-B7 and C4 are visually exposed to the newly built dwelling, resulting in the increase of PVEI values with these building facades. Among them, various changes of visual privacy can be observed with different columns, as shown in .
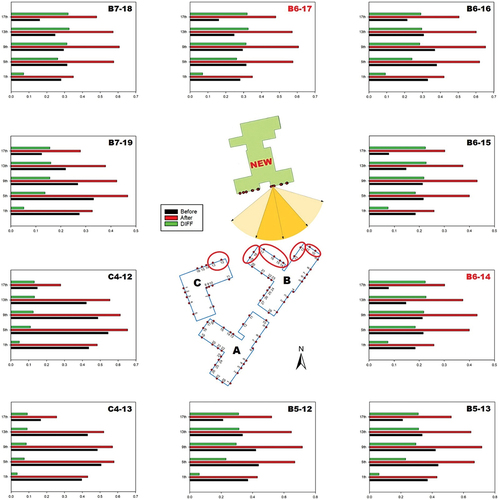
Figure 13. I-PVEI changes of several columns with the involvement of the newly built dwelling.
From the floor dimension, all the columns as listed in present the same distribution pattern of I-PVEI values; that is, the highest I-PVEI values can be found on the middle floor. With the newly built dwelling involved, the distribution pattern remains the same. It is noticed that the most influenced opening can be found on the upper floor of each column, and the change of I-PVEI goes down as the floor decreases. More specifically, the largest change (I-PVEI = 0.325) can be found on Floor 17, Column B6-17 after the involvement of the newly built dwelling. Also, the maximum rate of I-PVEI change can be found at the opening on Floor 17, Column B6-14 with the rate of I-PVEI increase of 290%.
In general, the most influenced façades can be observed at B5 and B6. This is because these two facades are so close to the newly built dwelling that potential observers from the new construction can clearly perceive the targets on Facades B5 and B6. Moreover, Facades B5 and B6 are directly faced with a façade of the new construction, where a large number of potentially visible sightlines can be formed, resulting in a high level of privacy risk on Facades B5 and B6.
5. Discussion
5.1. Unperceived visual damage
As shown in , In the horizontal FOV of the target O, although different levels of visual damage can be created on the target, the potential observers from A to E can be visually captured by the target. However, observers F and G, located on both sides of the target (red sector), are considered out of the sight of the target, causing the differential intervisibility between the target and observers. Although the observers from those areas may have little effect on the I-PVEI value of a target, it is necessary to realize where those observers are located, to what extent and how they create the visual impact on the target.
Figure 14. Unperceived potential observers by the target (top view).
To find out the unperceived potential observers for each opening in the neighborhood, we extracted all the visible sightlines formed by each opening and the observers from the red sectors. The targets most affected by the unperceived potential observers are identified in and shown in .
Figure 15. Impact of unperceived observers on PVEI of the opening.
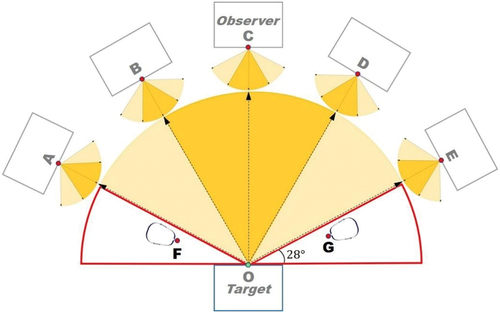
Table 2. Columns with most affected by unperceived potential observers.
The openings on Column B9-24 are highly influenced by its adjacent column, B8-23 (red circle), while observers from Column B8-23 are considered out of sight of the targets from Column B9-24, indicating the existence of differential intervisibility between these two columns. Similarly, the same concern can be given to Column C2-7, which is greatly influenced by its adjacent Columns C3-8 and C3-9. In fact, this issue can be found in other columns across the neighborhood, which is caused by the building layout with the “L” shape, resulting in a large number of unperceived privacy risks for the residents, especially when those observers are close enough. As an environmental or social concern to the residents, unperceived observers were not adequately examined in this study, but need to be covered in architectural design in the future.
5.2. Identification of upper bound of I-PVEI
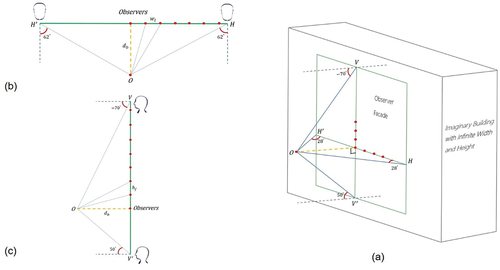
Although the I-PVEI value of each opening can be computed based on the proposed quantitative model, the range of the I-PVEI value remains uncertain. Theoretically, the visual privacy of an opening can be most preserved when its I-PVEI equals 0, which can thus be considered the lower bound of the I-PVEI value domain. To find out the upper bound of the I-PVEI, an imaginary building with an infinite width and height in front of a target is regarded as the greatest risk of visual privacy for a resident, as shown in ). A target O in the built environment is visually exposed to the imaginary building, with potential observers spreading all over the façade. As described in section 2, the ranges of horizontal and vertical FOV are () and (
), respectively. As such, the maximum range of the observer who can visually perceive the target is shown in the horizontal dimension ()) and vertical dimension ()), respectively, where
is the minimum building separation,
is the window distance, and
represents the floor height. In this context, once
,
and
are confirmed, the I-PVEI value of Target O can be calculated to determine the value range of the I-PVEI. As
,
and
can be varied across regions and cultures, the range of I-PVEI values should be calculated under local standards of the building design.
Figure 16. Greatest risks of visual privacy for a resident from the perspective of (a) three-dimension, (b) horizontal and (c) vertical dimensions.
5.3. Desirable I-PVEI in building design
Naturally, the lower the I-PVEI, the better the visual privacy that can be obtained. However, it is noted that building openings with extremely low I-PVEI (for instance, Façade A7 in this study) can be accompanied by the damage of daylight or ventilation, as well as the obstruction of the green views. Considering the great benefit of the daylight, ventilation and green views to people’s physical and mental health, seeking a relatively qualified I-PVEI can thus be a better solution for urban designers and residents.
The Standard Potential Visual Exposure Index (SPVEI), proposed by Zheng et al. (Zheng et al. Citation2021), is defined as the acceptable level of visual privacy for the building opening. To determine the SPVEI, a questionnaire survey that investigates the visual privacy requirements of residents is a possible solution. To ensure the quality of the questionnaire survey, the interviewees should have a full awareness of the residential visual environment, including the unperceived observers across the neighborhood, as described in section 5.1. Even so, the questionnaire survey may not be easy or may even be impossible as a universal solution as the desired visual privacy can be varied across culture, gender, and features of a society (Pinsly, Gewirtzman, and Burt Citation2007).
Most importantly, to provide a harmonious, stable and sustainable domestic environment, how to balance the visual privacy and residential environment (such as daylight, ventilation and green views) should be given more attention in building design or urban planning.
6. Conclusion
This study proposed a quantitative approach to assess residential privacy risks of visual exposure and detect the risk changes along the building facades. Using this approach, residential visual privacy, which may be a vague concept in people’s minds, can be quantified as numerical values across building facades. Compared with traditional qualitative methods based on questionnaire surveys, the proposed approach more objectively measures the visual privacy for each opening of the building facade without subjective preferences. In addition, the introduced model can solve the over-detection and under-detection issues that exist in the PVEI and accurately detect the changes from both the horizontal and vertical dimensions of the visual privacy, thereby reflecting the three-dimensional geometric characteristics of the built environment where each opening is located.
Figure 17. Greatest risks of visual privacy for a resident from the perspective of 423 (a) three-dimension, (b) horizontal and (c) vertical dimensions
This approach was demonstrated in a case study with a neighborhood, located at the center of Kowloon, Hong Kong, in which several major findings can be concluded: (1) Potential observers from building and pedestrian levels had different impacts on the neighborhood, resulting in different I-PVEI distribution patterns on the building facades. At the building level, middle floors were under the greatest risk of visual damage, while people living on upper floors or lower floors were visually exposed in a relative lower level. At the pedestrian level, the I-PVEI values decreased with floor rises, as expected. (2) Although significant changes of I-PVEI value could be found across building facades, the I-PVEI values always presented a steady change pattern on the same façade. (3) The quantitative model could better detect the privacy risks of openings located at the corner of the building, and thus improve the applicability of the indicator.
The application of I-PVEI is limited to the extraction of building openings, which were manually identified and digitized based on the 3D Photo-Realistic Model in this study. A further investigation of automatic and efficient extraction of building openings can rely on techniques such as deep learning or machine learning. Moreover, as a building opening can be generally visually exposed to a large number of potential observers in a dense urban area, an effective algorithm for the intervisibility analysis is required to apply the I-PVEI to a large-scale area.
The understanding of privacy risks of visual exposure provides insight into urbanization and helps avoid or reduce the conflicts between neighborhoods and improve the environmental quality of urban life (Tomah, Ismail, and Abed Citation2016). Based on the intervisibility analysis between the target and observer, the proposed I-PVEI can be an optional indicator for the assessment of residential visual privacy. A more automatic procedure in the further study is required when applying it to a large-scale area. As the level of residential visual privacy can be limited by the quality of green views, more attention should be paid to balancing visual privacy and green views in building design and urban planning in the future.
Highlights
An Improved Potential Visual Exposure Index (I-PVEI) for the assessment of residential visual privacy is proposed.
The level of visual privacy does not consistently increase as the floor rises, and residents living on the middle floor may suffer the most serious.
Although significant changes of I-PVEI value could be found across building facades, the I-PVEI values always presented a steady change pattern on the same façade.
The I-PVEI can be an optional indicator for the quantitative assessment of visual privacy.
Author Contributions
Conceptualization, Bo Wu; methodology, He Zheng and Jinmu Zhang; investigation, Jinbiao Yan and Heyi Wei; software, He Zheng; resources, Xianhua Zhang; writing original draft preparation, He Zheng; writing review and editing, Bo Wu and He Zheng; visualization, Heyi Wei and Jinbiao Yan; supervision, Bo Wu; All authors have read and agreed to the published version of the manuscript.
Acknowledgments
The authors would like to thank the anonymous reviewers and editors for their valuable comments. We are also thankful for The Hong Kong Government (Planning Department and Lands Department) for providing the datasets.
Disclosure statement
The authors declare that they have no known competing financial interests or personal relationships that could have appeared to influence the work reported in this paper.
Data Availability Statement
Publicly available datasets were analyzed in this study. 3D Photo-realistic Model dataset can be found here: [https://www.pland.gov.hk/pland_en/info_serv/3D_models/download.htm]. 3D Pedestrian Network dataset can be found here: [https://geodata.gov.hk/gs/view-dataset?uuid=201eaaee-47d6-42d0-ac81-19a430f63952&sidx=0#]. iB1000 datasets can be found here: [https://www.hkmapservice.gov.hk/OneStopSystem/map-search?product=OSSCatB&series=iB1000&locale=en].
Additional information
Funding
Notes on contributors
He Zheng
He Zheng is currently a Ph.D. candidate at Jiangxi Normal University, and he is also a lecture at Jiangxi College of Applied Technology. His research interests include 3D modeling, quantitative assessment of building environment and urban sustainability.
Bo Wu
Bo Wu is a Professor at Jiangxi Normal University. His research interests include spatiotemporal big data analysis, remote sensing image processing and building information modeling.
Jinmu Zhang
Jinmu Zhang is a Senior engineer at Jiangxi Normal University. Her research interests include civil engineering and building information modeling.
Jinbiao Yan
Jinbiao Yan is a Ph.D. candidate at Jiangxi Normal University. His research interests include spatiotemporal big data analysis, geographic information system and 3D modeling.
Heyi Wei
Heyi Wei is a lecture and founding director of Geodesign Research Centre at Jiangxi Normal University. His research interests include the Geodesign, Digital Simulation, GIS&RS in Landscape Architecture.
References
- An, K. J., H. Ko, and C. S. Kim. 2015. “Development and Implementation of Visual Exposure Indicator for Residential Development.” International Journal of Smart Home 9 (2): 1–10. doi:10.14257/ijsh.2015.9.2.01.
- Asl, S. R. M., and H. Safari. 2020. “Evaluation of Daylight Distribution and Space Visual Quality at Medical Centers through Spatial Layout.” Journal of Asian Architecture and Building Engineering 20: 512–519. doi:10.1080/13467581.2020.800476.
- Benedikt, M. L. 1979. “To Take Hold of Space: Isovists and Isovist Fields.” Environment and Planning B: Planning and Design 6 (1): 47–65. doi:10.1068/b060047.
- Census and Statistics Department. 2017. “Demographic Trends in Hong Kong 1986–2016.” Statistical Reports, Accessed 17 August 2021. https://www.censtatd.gov.hk/en/EIndexbySubject.html?pcode=B1120017&scode=150
- Chai, Q., H. Wang, Y. Zhai, and L. Yang. 2020. “Using Machine Learning Algorithms to Predict Occupants’ Thermal Comfort in Naturally Ventilated Residential Buildings.” Energy and Buildings 217. https://dx.doi.org/10.1016/j.enbuild.2020.109937.
- Chang, D., and J. Park. 2018. “Quantifying the Viusal Experience of three-dimensional Built Environments.” Journal of Asian Architecture and Building Engineering 17 (1): 117–124. doi:10.3130/jaabe.17.117.
- Chen, L., E. Ng, X. An, C. Ren, M. Lee, U. Wang, and Z. He. 2012. “Sky View Factor Analysis of Street Canyons and Its Implications for Daytime intra-urban Air Temperature Differentials in high-rise, high-density Urban Areas of Hong Kong: A GIS-based Simulation Approach.” International Journal of Climatology 32 (1): 121–136. doi:10.1002/joc.2243.
- Dai, T., S. Liu, J. Liu, N. Jiang, W. Liu, and Q. Chen. 2022. “Evaluation of Fast Fluid Dynamic with Different Turbulences Models for Predicting Outdoor Airflow and Pollutant Dispersion.” Sustainable Cities and Society 77: 103583. doi:10.1016/j.scs.2021.103583.
- De Floriani, L. M., and P. Magillo. 1999. “Intervisibility on Terrains.” In Geographic Information Systems: Principles, T Echniques, Managament and Applications, edited by P. A. Longley, M. F. Goodchild, D. J. Maguire, and D. W. Rhind, 543–556. London: John Wiley & Sons.
- Dempsey, N. 2008. “Quality of the Built Environment in Urban Neighbourhoods.” Planning Practice and Research 23 (2): 249–264. doi:10.1080/02697450802327198.
- Florio, P. 2018. “Towards a GIS-based Multiscale Visibility Assessment Method for Solar Urban Planning.” Ph.D, thesis, EPFL. doi:10.5075/epfl-thesis-8826.
- Heydaripour, O., F. Behmaneshnia, E. Talebian, and P. H. Shahi. 2017. “A Survey on Privacy of Residential Life in Contemporary Apartments in Iran.” International Journal of Scientific Study 5: 254–263. doi:10.17354/ijssJuneI/2017/037.
- Hong Kong Geodata Store. 2021a. Accessed 10 August 2021a. https://www.hkmapservice.gov.hk/OneStopSystem/map-search?product=OSSCatB&series=iB1000&locale=en
- Hong Kong Geodata Store. 2021b. Accessed 10 August 2021b. https://geodata.gov.hk/gs/view-dataset?uuid=201eaaee-47d6-42d0-ac81-19a430f63952&sidx=0
- Hong Kong Geodata Store. 2021c. Accessed 11 August 2021c. https://geodata.gov.hk/gs/view-dataset?uuid=1d2997e3-b5ca-43a4-b3e2-14518b61654c&sidx=0
- Huangfu, W., M. J. Ostwald, and T. Chung. 2021. “Visual-asymmetry in Adolf Loos’s Moller House: A Computational Analysis Testing Propositions about Performance and Spectation.” Nexus Network Journal 23 (1): 57–83. doi:10.1007/s00004-020-00481-5.
- Hwang, J., and H. Lee, “3D Visual Simulation and Numerical Measurement of Privacy in Traditional Korean Palace.” In Proceedings of the 22nd International Conference of the Association for Computer-Aided Architectural Design Research in Asia (CAADRIA), Hong Kong, China, 5-8 April 2017.
- Hwang, J. H., and H. Lee. 2018. “Parametric Model for Window Design Based on prospect-refuge Measurement in Residential Environment.” Sustainability 108: 19–29. doi:10.3390/su10113888.
- Ibem, E. O., and E. B. Aduwo. 2013. “Assessment of Residential Satisfaction in Public Housing in Ogun State, Nigeria.” Habitata International 40: 163–175. doi:10.1016/j.habitatint.2013.04.001.
- Jones, P. J., D. Alexander, A. Marsh, and J. Burnett. 2004. “Evaluation of Methods for Modelling Daylight and Sunlight in-high Rise Hong Kong Residential Buildings.” Indoor and Built Environment 13 (4): 249–258. doi:10.1177/1420326x04045177.
- Kodmany, K. A. 1999. “Residential Visual Privacy: Traditional and Modern Architecture and Urban Design.” Journal of Urban Design 4 (3): 283–311. doi:10.1080/13574809908724452.
- Lan, T., G. Shao, Z. Xu, L. Tang, and L. Sun. 2021. “Measuring Urban Compactness Based on Functional Characterization and Human Activity Intensity by Integrating Multiple Geospatial Data Sources.” Ecological Indicators 121: 107177. doi:10.1016/j.ecolind.2020.107177.
- Lang, W., T. Chen, E. H. W. Chan, E. H. K. Yung, and T. C. F. Lee. 2018. “Understanding Livable Dense Urban Form for Shaping the Landscape of Community Facilities in Hong Kong Using fine-scale Measurements.” Cities 84: 34–45. doi:10.1016/j.cities.2018.07.003.
- Li, K., H. Zhang, and L. Zhao. 2021. “Thermal Comfort Interventions of Landscape Elements in a Humid and Subtropical Residential Area in China.” Journal of Asian Architecture and Building Engineering. doi:10.1080/13467581.2021.1900857.
- Lonergan, C., and N. Hedley. 2015. “Unpacking Isovists: A Framework for 3D Spatial Visibility Analysis.” Cartography and Geographic Information Science 43 (2): 87–102. doi:10.1080/15230406.2015.1065761.
- Motevalian, N., and M. Yeganeh. 2020. “Visually Meaningful Sustainable in National Monuments as an International Heritage.” Sustainable Cities and Society 60: 102207. doi:10.1016/j.scs.2020.102207.
- Newell, P. B. 1995. “Perspectives on Privacy.” Journal of Environmental Psychology 15 (2): 87–104. doi:10.1016/0272-4944(95)90018-7.
- Pan, Z., G. Wang, Y. Hu, and B. Cao. 2019. “Characterizing Urban Redevelopment Process by Quantifying Thermal Dynamic and Landscape Analysis.” Habitat International 86: 61–70. doi:10.1016/j.habitatint.2019.03.004.
- Panero, J., and M. Zelnik. 1979. Human Dimension & Interior Space: A Source Book of Design Reference Standards. New York: Watson-Guptill.
- Pinsly, D. S., D. F. Gewirtzman, and M. Burt. 2007. “Visual Exposure’ Analysis Model: A Comparative Evaluation of Three Case Studies.” Urban Design International 12 (2–3): 155–168. doi:10.1057/palgrave.udi.9000199.
- Stone, B. 2008. “Urban Sprawl and Air Quality in Large US Cities.” Journal of Environmental Management 86 (4): 688–698. doi:10.1016/j.jenvman.2006.12.034.
- Tang, W. S., J. W. Y. Lee, T. W. Hui, and M. K. C. Yip. 2019. “The “Urban Density” Question in Hong Kong: From Absolute Space to Social Processes.” City, Culture and Society 17: 46–53. doi:10.1016/j.ccs.2018.10.002.
- Tara, A., G. Lawson, and A. Renata. 2021. “Measuring Magnitude of Change by high-rise Buildings in Visual Amenity Conflicts in Brisbane.” Landscape and Urban Planning 205: 103930. doi:10.1016/j.landurbplan.2020.103930.
- Tomah, A. N., “Visual Privacy in Residential Areas: Amendment of Building Regulations.” Proceedings of the Institution of Civil Engineers - Urban Design and Planning Amman, Jordan, 165 (2012) 43–53. doi:10.1680/udap.2012.165.1.43.
- Tomah, A. N., H. B. Ismail, and A. Abed. 2016. “The Concept of Privacy and Its Effects on Residential Layout and Design: Amman as a Case Study.” Habitat International 53: 1–7. doi:10.1016/j.habitatint.2015.10.029.
- Traver, H. 1976. “Privacy and Density: A Survey of Public Attitudes Towards Privacy in Hong Kong.” Hong Kong Law Journal 6: 327–343.
- Tretten, P. 2008. “The Driver and the Instrument Panel.” Licentiate Thesis. Lulea University of Technology, Lulea.
- Turner, A., M. Doxa, D. O. Sullivan, and A. Penn. 2001. “From Isovists to Visibility Graphs: A Methodology for the Analysis of Architectural Space.” Environment and Planning B: Planning and Design 28 (1): 103–121. doi:10.1068/b2684.
- Wang, L., and N. H. Wong. 2007. “The Impacts of Ventilation Strategies and Facade on Indoor Thermal Environment for Naturally Ventilated Residential Buildings in Singapore.” Building and Environment 42 (12): 4006–4015. doi:10.1016/j.buildenv.2006.06.027.
- Wang, B., and A. Malkawi. 2019. “Design-based Natural Ventilation Evaluation in Early Stage for High Performance Buildings.” Sustainable Cities and Society 45: 25–37. doi:10.1016/j.scs.2018.11.024.
- Wang, J., M. Wei, and X. Ruan. 2020. “Characterization of the Acceptable Daylight Quality in Typical Residential Buildings in Hong Kong.” Building and Environment 182: 107094. doi:10.1016/j.buildenv.2020.107094.
- Yu, S., B. Yu, W. Song, B. Wu, J. Zhou, Y. Huang, J. Wu, F. Zhao, and W. Mao. 2016. “View-based Greenery: A three-dimensional Assessment of City Buildings’ Green Visibility Using Floor Green View Index.” Landscape and Urban Planning 152: 13–26. doi:10.1016/j.landurbplan.2016.04.004.
- Zheng, H., B. Wu, H. Wei, J. Yan, and J. Zhu. 2021. “A Quantitative Method for Evaluation of Visual Privacy in Residential Environments.” Buildings 11 (7): doi:10.3390/buildings11070272.