
 ?Mathematical formulae have been encoded as MathML and are displayed in this HTML version using MathJax in order to improve their display. Uncheck the box to turn MathJax off. This feature requires Javascript. Click on a formula to zoom.
ABSTRACT
The purpose of this study is to evaluate the effect of air curtains on indoor environment and dehumidification energy consumption for different air supply angle and velocity. The numerical investigation is conducted in a low-humidity plant located in the atmospheric boundary layer. The standard k-epsilon turbulence model is used in the simulation study. The optimum air supply angle and velocity are evaluated based on temperature and humidity distribution. The simulation cases range in air supply angle from 0° to 20° and velocity from 6 m/s to 14 m/s, which is studied by means of orthogonal experiments. Simulation results show that air curtain can reduce the average indoor temperature of the plant by up to 3.9°C and reduce the average moisture content by up to 86.6%. The energy saving assessment of the dehumidification rotor system shows a parabolic variation in energy consumption with increasing air velocity at a certain air supply angle. The optimum energy consumption occurs in the range of 9–11 m/s for air supply velocity. When air supply velocity is over 11 m/s, the airflow exchange is enhanced by air curtain at the plant opening, resulting in higher energy consumption from air leakage for dehumidification.
GRAPHICAL ABSTRACT
1. Introduction
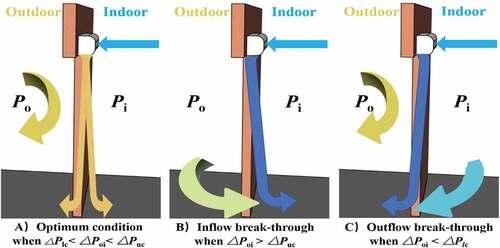
The temperature and humidity distributions of the plant are significant factors that affect production safety and are of great importance to ensure product quality. In the case of power battery production, its cathode processing process needs to maintain a very low relative humidity (1%) to avoid instantaneous discharge that generates a large amount of current and to avoid battery spontaneous combustion or explosion. Therefore, the temperature and humidity control in the power battery production plant has been the primary issue for its industrial production safety. An effective way to control temperature and humidity is to reduce external air infiltration. For openings on plant facades, air curtain can be used to reduce air infiltration to improve indoor temperature and humidity stability and to isolate the heat and humidity exchange between indoor and outdoor. The air curtain produces a flat air jet parallel to an opening that blocks air flow perpendicular to the opening in order to reduce the heat and mass transfer from one area to another area with different conditions () (Guyonnaud et al. Citation2000). When the pressure difference ΔPoi is changed for different outdoor pressure Po and indoor pressure Pi, the relationship between ΔPoi and two threshold values (the lower critical pressure difference ΔPlc and the higher one ΔPuc) can affect the airflow pattern around the opening. The appropriate jet flow causes lower infiltration in ). But for the stronger or weaker jet flow, the higher inflow or outflow breakthrough can increase the infiltration rate as shown in ) 1 (1) (Wang and Zhong Citation2014). The use of air curtain not only changes the air flow rate and flow direction near the building opening but also effectively reduces the heat and moisture exchange between both sides of the opening to achieve the air isolation effect.
Figure 1. Characteristics of an air curtain jet under different pressure differences.
Outdoor approaching airflow can enter the indoor environment by natural ventilation through openings on the building surfaces, which results in the increase of heating or cooling loads. There are two types of natural ventilation in buildings: wind-driven ventilation and buoyancy-driven ventilation (Toparlar et al. Citation2017; Ramponi and Blocken Citation2012; Liu and Niu Citation2016; Shen, Zhang, and Bjerg Citation2012; Blocken, Citation2015). Wind-driven ventilation arises from the different pressures created by wind around a building or structure, and cross ventilation can be formed by openings on building facades.
Buoyancy-driven ventilation results from the density differences between interior and exterior air. The temperature distinction makes the warm air to rise above the cold air and create the upward and downward airstream. Currently, Computational Fluid Dynamics (CFD) methods have been widely used to study the wind environment of buildings and validated by field measurements or wind tunnel tests. Some studies used CFD to investigate the airflow generated by air curtain as a barrier to isolate the building from the outdoor (Goubran et al. Citation2016). The results show that air curtain can effectively reduce air infiltration and energy consumption. Yang et al. (Yang Citation2019) investigated and verified the effect of the angle and velocity of air curtain jets to block outdoor air. It is found that the lower part of the door is easily penetrated by air. Therefore, it is necessary to evaluate the effectiveness of different installation and operation schemes of air curtain against outdoor air disturbance.
In recent decades, air curtain has been widely used in environment where stable temperature distribution is required, such as cold storage, refrigerated trucks, and refrigerated cabinets. Navaz et al. (Navaz et al. Citation2005) used CFD simulations to evaluate the effect of air curtains on the suppression of cold air leakage in refrigerated cabinets, and verified the design of energy-efficient open display cabinets by simulation. Tomas et al. (Gil-Lopez et al. Citation2014) conducted an experimental studied of air curtain applications in cold storage on an existing installation in an industrial warehouse. The results show that air curtain can reduce heat exchange through doors, prevent icing and fogging, and then reduce energy consumption by 40% compared with sliding doors. Ashika et al. (Rai, Sun, and Tassou Citation2019) used CFD simulations to study the effectiveness of air curtains in the application of refrigerated trucks indoor and outdoor. It is found that the energy reduction performance of air curtain placed outside is 8% lower than that for air curtain placed inside, but the sealing effect of indoor air curtain is higher than that of outdoor air curtain. On the other hand, several studies focused on dust isolation ability of air curtain. Yin et al. (Yin et al. Citation2019) performed numerical simulations and field measurements to investigate the effect of air curtain on dust isolation in tunnel work, which provided a better method for environmental sustainability of tunnel extraction activities. Fan et al. (Geng et al. Citation2019) performed simulations to study air curtains in mine work to solve the dust problem in coal mine tunnel and found that air curtain is effective to improve the work environment during mining process. However, these researches mainly focused on the application of air curtain for heat insulation and air pollution isolation. The blocking effects of heat and moisture were not fully investigated for air curtain in low-humidity environment. And the effect of air curtain on energy consumption of indoor dehumidification was not evaluated. Therefore, the above research cannot provide guidance for the design and operation of air curtain in low-humidity plants.
Some researches point out that air curtain with different jet velocity provides different isolation effect. Foster et al. (Foster et al. Citation2007) investigated the impact of air curtain with different jet velocities on the blocking effect of air infiltration, and proposed to use a 3-D CFD analytical model to predict the feasibility of air curtain for reducing air infiltration. On the other hand, the jet angle of air curtain is another important factor that affect air infiltration. Yu et al. (Yu et al. Citation2018) performed numerical simulations and small-scale experiments to evaluate the effect of air curtain jet angle on the distribution of small-scale fire test and found that the jet angle has a significant effect on the seal effect of air curtain. Chen et al. (Chen Citation2009) numerically studied the thermal insulation performance of recirculated single-band refrigerated air curtain and the results show that the jet angle of the air curtain would influence the thermal insulation performance of the air curtain. Based on the different insulation effects of jet velocity and jet angle of air curtain, some studies focus on the combined effects of the simultaneous changes of the two factors. Yang et al. (Yang Citation2019) evaluated the interaction of different wind velocities and directions of outdoor air with air curtain jets and analyzed the temperature distributions for different jet angles. The results clarify that air curtains with appropriate jet velocity and angle would be helpful for the sealing stability. Elham et al. (Alipourtarzanagh et al. Citation2020) investigated the heat loss of the cavity with different jet velocities and different jet angles, and concluded that the use of air curtains can reduce the natural and mixed convective heat loss by 40–66%. Duan et al. (Duan and Liu Citation2020) studied the barrier effect of different jet flows on outdoor pollution and concluded that the barrier effect of air curtain with different jet angles is related to the jet velocity. Therefore, it is necessary to evaluate the interaction effect of jet velocity and jet angle in the low humidity plant in natural ventilation when air curtain is applied to maintain temperature and humidity distribution and reduce dehumidification energy consumption.
In this paper, the feasibility of air curtain is studied for low humidity plant in natural ventilation. The experimental data from previous research is applied to validate the numerical results of coupled indoor and outdoor airflow fields around buildings in natural ventilation. The indoor temperature and humidity in the plant is investigated by numerical method to analyze the energy cost of dehumidification. The interaction of jet velocity and jet angle is considered. These results provide optimization basis for air curtain control of temperature and humidity. The conclusions of this paper provide reference for air curtain to reduce dehumidification consumption in low humidity situations.
2. Simulation methods
2.1. Building geometry and computational domain
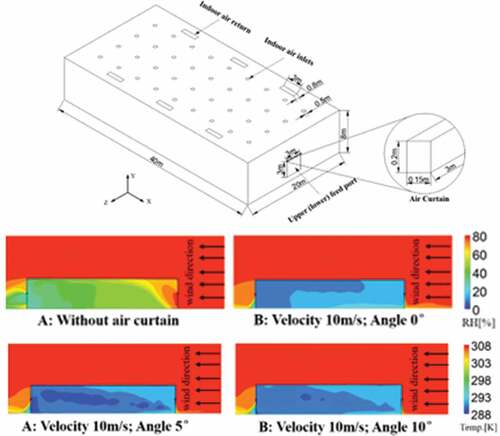
The dimensions of the factory are 40.0 m × 20.0 m × 8.0 m. In order to ensure the daily incoming and outgoing of goods by trucks, there are incoming or outgoing windows of 3.0 m × 3.0 m on each side of the factory. There are 36 evenly distributed air supply vents on the top of the factory, which are simplified to 36 air inlets with dimensions of 0.5 m × 0.5 m. Also distributed on both sides of the air supply window are 6 equal-sized return air inlets, simplified to air outlets of size 0.8 m × 3.0 m. As the windows on the left and right sides of the plant are open when incoming or outgoing operations, air curtains are now added to both sides of the window inside and outside, not only to avoid convective heat exchange leading to a rise in temperature and humidity but also to better maintain the internal temperature and humidity balance of the plant. The air curtain is simplified to two side-by-side air curtains with dimensions of 1.5 m × 0.15 m × 0.2 m, making the total length of air curtain coverage consistent with the width of the window, with the results shown in . The dimensions of computational domain for external environment are established according to AIJ guidelines (Tominaga et al. Citation2008), as shown in . The H represents the height of the studied plant.
Figure 2. Simplified geometry of the plant.
Figure 3. Dimensions of the outdoor computational domain.
2.2. Grid resolution
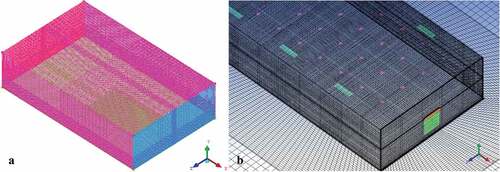
Mesh classification is an important part of the numerical simulation pre-processing, and the quality of the divided mesh can directly determine the accuracy, computation time, and convergence of the numerical calculation. Because of the regular shape of the plant as a whole, this paper used structured meshes with good-quality generation to partition the computational domain. In order to ensure the smooth simulation and the accuracy of the simulation results, the quantity and quality of the mesh are controlled as follows: (1) O-block mesh is used around the plant; (2) the mesh is encrypted for the air supply and return air openings, the inlet and outlet windows on both sides and the areas with large velocity gradients; (3) the mesh is encrypted for the near-wall and ground areas of the plant. The final mesh number is determined to be 2,048,008 for the computational model and the mesh division is shown in .
Figure 4. Global and local resolution (A. Global Grid, B. Local grid).
2.3. Governing equations
The governing equations include the continuity equation, momentum equation, energy conservation equation, component transport equation, k equation, and ε equation, which is solved simultaneously in the numerical simulation. The steady Reynolds-averaged Navier–Stokes equations (RANS) are applied to solve the airflow field in computational domain. The turbulence model is the standard k-ε model, which has wide applicability in the simulation of wind environment around buildings (Huang Citation2005). All equations are shown in .
Table 1. Governing equations.
where k is the thermal conductivity of the fluid; = (Cp×µt)/Prt:Sh is the internal heat source of the fluid. cs is the volume concentration of the component S; ρcs is the mass concentration of the component equation; Ds is the diffusion coefficient of the component; and Ss is the mass of the component produced by chemical reaction per unit volume per unit time within the system. Where Gb = 0;YM = 0;C1ε, C2ε, C3ε are empirical constants; Sk and Sε are custom source terms; σk and σε are the Prandtl numbers corresponding to the turbulent kinetic energy k and turbulent dissipation rate ε, respectively. In this paper, the constants taken from reference (ANSYS Citation2013) are C1ε = 1.44, C2ε = 1.92, Cµ = 0.09, σk = 1.0 and σε = 1.3, respectively.
2.4. Boundary conditions and source terms
In this paper, the sparsely populated townships and factories on the outskirts of the city of Ningde are selected. According to China’s Load code for the design of building structures (GB 50009–2012) (GB Citation2012), the area is a Class B wind field with a ground roughness index of α = 0.16 and a gradient wind height of ZG = 350 m. The turbulence characteristics of the incoming inlet wind in the calculated domain are given by the values of the turbulent kinetic energy k and turbulent dissipation rate ε. (where Z0 = 4 m, v = 3.7 m/s; IrZ is the turbulence intensity and LZ is the turbulence integration scale, which is calculated using the Japanese code (P4450E Citation1996)), All equations are shown in .
Table 2. Boundary conditions.
where α is the ground roughness index, Z is the ground height and ZG is the gradient wind height. Because the plant is a Class B wind field, Zb = 5 m and ZG = 350 m.
The plant discussed in this paper is a workshop where the part of the lithium battery production process is located and needs to be kept at very low humidity levels. However, the enthalpy humidity of the ambient air is high and cannot be dropped directly into the plant interior. Therefore, the air is dehumidified through a low dew point air treatment process to keep it relatively dry, the mechanism of which is shown in .
Figure 5. Air treatment process for low dew point.
Point A ss the outdoor air inlet, where the temperature and humidity with the same external flow field. Point K is the indoor air supply outlet. Point D is the indoor air return point, where the temperature and humidity with the same indoor. Other points for the air state point, the specific parameter values of each point as shown in , air state points corresponding to the Psychrometric Chart shown in .
Figure 6. Psychometric chart corresponding to each air state point.
Table 3. Parameters of each point for the state of the moist air.
The indoor supply air outlet velocity is given according to the data in and its dimensions, Vin = 3.067 m/s. Its turbulence is given using the regulated turbulence and hydraulic diameter, the turbulence is set at 10%, the hydraulic diameter is calculated as 0.5 m according to the return air outlet dimensions and the rest of the parameters are set according to the K points.
The movement of people inside a factory generates heat and humidity. Based on points D and K to calculate the heat and humidity dissipation inside the factory, we get the indoor heat dissipation Qin = 43.467 W/m3 and the humidity dissipation Win = 1.5 × 10⁻⁶kg×s/m3.
The pressure return air outlet is used for the indoor return air outlet and its gauge pressure is calculated as P = −1.085 Pa. Here, the turbulence is given by the regulated turbulence and hydraulic diameter, the turbulence is set at 10%, the hydraulic diameter is calculated as 1.263 m based on the size of the return air outlet and the other parameters is set based on the point D. The k equation and ε equation imported by the UDF are chosen for outdoor turbulence, the other parameters are given based on the point A. All other walls inside and outside of the plant are set to Wall. The temperature inside the plant is 295 K and the temperature outside is 308 K. The outflow field boundary is shown in , with the bottom set to Wall and the sides and top set to Symmetry. The temperature distribution, moisture distribution, heat exchange, and mass exchange between indoor and outdoor environments are calculated simultaneously in every iteration.
Based on the planned plant, air curtains are planned to be installed on the inside and outside of the left and right windows. Therefore, 46 sets of orthogonal experiments are set up to simulate the effect of different incident velocities and incident angles of the air curtain on the temperature and humidity control inside the plant, one of which is used as a control group without the air curtain. Research is carried out with up-flow air curtains, and from the direction of energy saving (Liu and Wang Citation2020), the through-flow mode air curtain is chosen irrespective of the impact of the air curtain on the comfort of the personnel. Based on the parameter requirements of the Chinese standard for air curtains (JB/T Citation9067-1999 Citation1999), the incident velocity range of 6 m/s-14 m/s and the incident angle of 0°–20° are selected for orthogonal experiments. The basic parameters of the air curtain are given in and the incident velocity and incident angle are given in .
Table 4. Parameters of air curtain for the reference case.
Table 5. Selection of air curtain incident velocity.
Table 6. Selection of air curtain incident angles.
2.5. Calculation of indoor humidity and energy consumption
In this paper, the relative humidity is used to assess the effect of the air curtain on the humidity field and the relative humidity (Zhao Citation2009) is calculated as follows.
Where φ denotes relative humidity, d denotes moisture content of water vapour; db denotes saturated moisture content. Where the saturated moisture content can be derived from the temperature distribution using the following empirical formula (Li Citation2003).
where temperature t = T-273.15, T is the absolute temperature; Mh2o indicates the mass of water. A1 = 3.70; A2 = 0.268; A3 = 9.164 × 10⁻³; A4 = 1.446 × 10⁻⁴; A5 = 1.741 × 10⁻⁶; A6 = 5.195 × 10⁻⁸。
The equations for cooling energy consumption and regenerative steam consumption (Zhao Citation2009) are shown in
Table 7. Energy consumption formula.
In the above equation cp·g represents the constant pressure-specific heat of the fluid, qv represents the air supply volume, ρ represents the air density, ∆h represents the enthalpy difference and ∆t represents the temperature difference. Based on practical application experience with lithium batteries, calculations using the mechanism shown in can yield a cooling capacity of 1619.4 kW and regenerative steam consumption of 787.39 kg/h per 7.65 g/s of moisture treated (boiler unit conversion (Liu Citation2006) produces 1 kg/h of steam per 0.7 kW of power consumed).
2.6. Flow chart for modelling and analysis
A flow chart based on the modelling and calculation process in this paper is shown in .
Figure 7. Flow chart for modelling and analysis.
2.7. Model validation
The numerical model validation consists of two basic components: (1) natural ventilation in an isolated building with coupled indoor and outdoor airflow field, and (2) jet flow from an air curtain in a limited space. The two parts of validation are performed by experimental data from previous research to ensure the accuracy of the numerical simulation results.
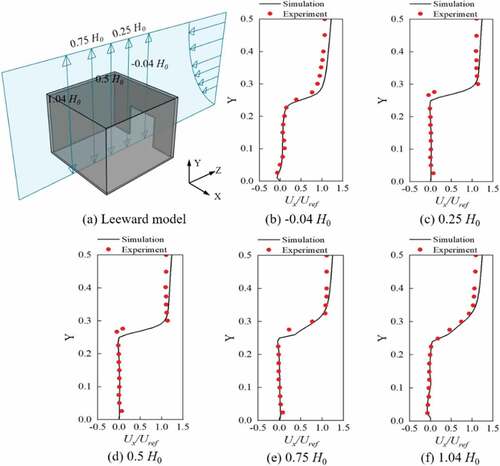
Model validation of the coupled indoor and outdoor airflow fields of the building is performed by comparing the numerical results with experimental results from Jiang et al. (Jiang et al. Citation2003) The reference experiments are performed in wind tunnel for a cubic building with one windward or leeward opening, as shown in ) 8 8(a). The length L0, width W0 and height H0 of the building are all set as 0.25 m. The opening is located on the central line of the facade. The width and height of the door are 0.336H0 and 0.5H0, respectively. Numerical simulations are performed for the reference velocity Uref 5 m/s at the reference height H0. The boundary conditions are described in the same formulas as Eq.1- Eq.6. Other model and solver settings are the same as those in Section 2.4. The comparisons of dimensionless velocity Ux/Uref between experimental and numerical data around the building are shown in . The velocity distribution obtained from the simulation is found to be in good agreement with the experimental test data. The absolute deviations of dimensionless velocity in the cases with the windward or leeward opening are 0.076 and 0.093, respectively. The results show that the numerical settings have good accuracy in predicting the airflow fields of the ventilated building. And it is feasible to use numerical simulation to investigate indoor environment with natural ventilation.
Figure 8. Validation of the dimensionless velocity distribution for the building with a windward opening.
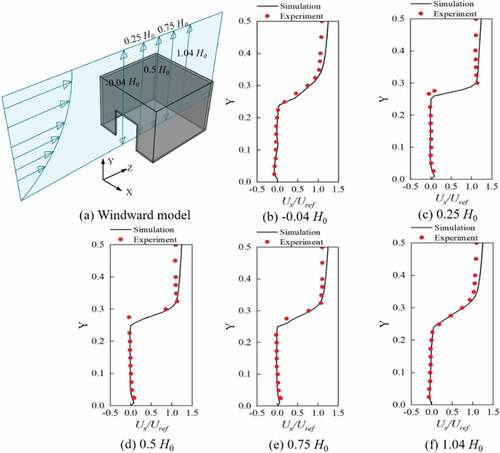
Figure 9. Validation of the dimensionless velocity distribution for the building with a leeward opening.
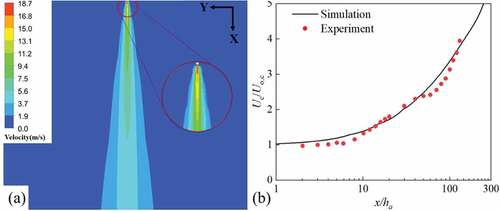
The velocity distribution of air jet from air curtain is validated by the experiments from Deo et al (Deo, Nathan, and Mi Citation2007). The experimental velocity results are measured in the mid-axis of the jet stream from a slit with AR = 60 (length wa/width ha). The uniform jet velocity Uo,c is set as 18.7 m/s, resulting the Reynolds number Re = 7000. The contour of velocity Uc around the vertical airflow is shown in ), and the dimensionless velocity Uc/Uo,c on the central line is compared with the experimental data by Deo et al. in ). The simulation and experimental results present the same tendency that the velocity away from the air curtain is smaller. The absolute deviation of the dimensionless velocity is 0.069 for the dimensionless velocity, which shows a good agreement between the numerical data and the experimental test data.
Figure 10. Validation of the dimensionless velocity distribution Uc/Uo,c for air jet.
3. Results and discussion
3.1. Analysis of temperature and humidity
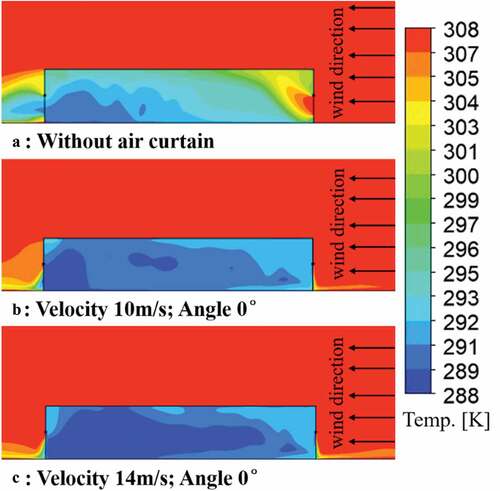
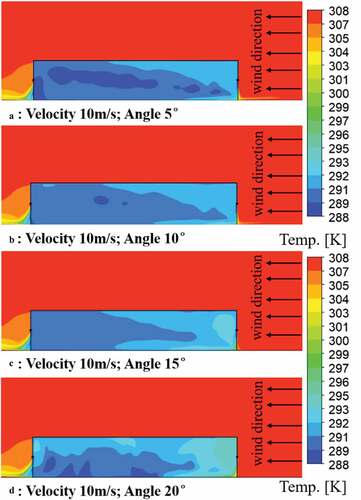
shows the contours of the temperature distribution at Z = 10 m for different incident velocities at an incident angle of 0°. It can be seen that the air curtain effectively weakens the heat exchange between indoor and outdoor while having a good wrapping effect on the plant. At the windward side, the air curtain effectively blocked the airflow exchange between indoor and outdoor. At the leeward side, the deflection of the air curtain incident has little effect on the temperature field in the vicinity of the indoor outlet, as the direction of airflow flows out of the room. The air curtain incident velocity of 14 m/s had a relatively uniform temperature distribution, but there is a loss of cooling at the inlet. It means that when the velocity increases to a certain value, the air curtain reaches a threshold value for the wrapping effect of the plant. At this point, a further increase in incident velocity will result in a loss of indoor cooling.
Figure 11. Temperature distribution at Z = 10 m for different incident velocities at the same angle.
shows a cloud of the temperature distribution at Z = 10 m for different incident angles at the same incident velocity of 10 m/s. It can be seen that at the same incident velocity, temperature distribution at the air inlet becomes more uniform as the incident angle increases. At an incident angle of 20°, the temperature distribution of the flow field at the inlet can be seen to be more turbulent. Thus, increased incident angle of the air curtain has a certain influence on the temperature distribution of the plant. When the air curtain incident angle reached a certain value, the air curtain on the plant wrapping effect is weakened, then the incident angle should be properly reduced to achieve the best wrapping effect.
Figure 12. Temperature distribution at Z = 10 m for different incident angles at the same velocity.
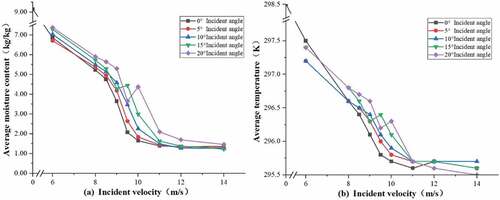
Calculated average room temperature and average moisture content for 46 experimental groups, the results of which are shown in . It could be seen that the room temperature and humidity decreased as the incident velocity increased. When the incident velocity reached 11 m/s the room temperature and humidity stabilized, the average temperature tended to be close to 295.5 K and the average moisture content tended to be close to 1 kg/kg. Compared to the situation without air curtains, it is possible to derive an average temperature drop of 2.9°C and an average reduction in moisture content of 86.6%.
Figure 13. Average moisture content and average temperature in different cases (a. average indoor moisture content; b. average indoor temperature).
3.2. Relative humidity and inhomogeneity analysis
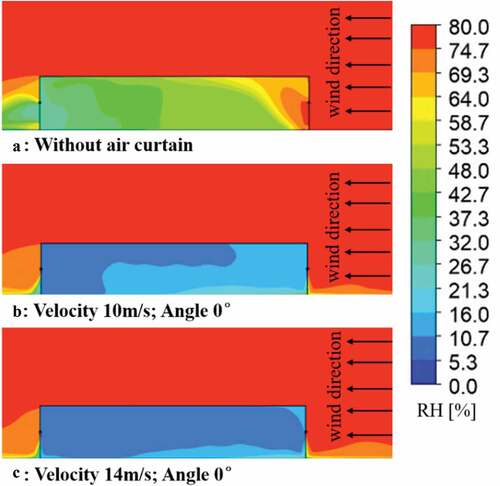
shows the relative humidity distribution at Z = 10 m for different incident velocities at an incident angle of 0°. It can be seen that the installation of an air curtain significantly weakens the exchange of moisture between indoor and outdoor, while changing the location of the maximum relative humidity within the room. Without an air curtain, the highest relative humidity is located at the inlet window on the windward side near the ceiling. With an air curtain, the maximum relative humidity is located at the intersection of the windward side of the plant and the floor. Finally, it can be seen that the relative humidity distribution becomes more uniform at Z = 10 m as the incident velocity increases.
Figure 14. Distribution of relative humidity at the same angle for different incident velocities at Z = 10 m.
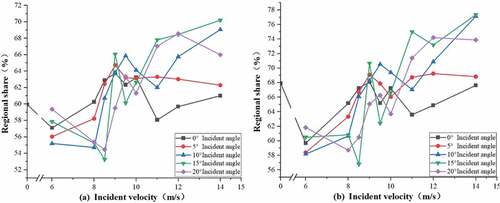
shows the distribution of relative humidity inhomogeneity at different incident angles of 0% and 5% at an incident velocity of 14 m/s. Combined with the percentage of areas in the plant with a relative humidity inhomogeneity of less than 5% and 10% under different air curtain velocity and angle controls. It can be concluded that as the incident velocity and incident angle increase, the relative humidity within the room becomes more uniform. When the incident velocity is greater than 8 m/s and the incident angle is greater than 5°, interior relative humidity unevenly less than 5% of the area accounted for more than 60% of the plant, as well as mainly distributed in the plant on both sides of the central axis. Therefore, processes with low relative humidity requirements can be produced in this area, helping to reduce the impact of the plant environment on product quality. Finally, compared with , it can be seen that when the incident velocity is greater than 10 m/s, the choice of 15° for the incident angle of the air curtain is effective in reducing the amount of moisture exchanged at the window, while keeping the relative humidity of the plant at a low level to a certain extent.
Figure 15. Distribution of relative humidity inhomogeneity for different incident angles at the same velocity.
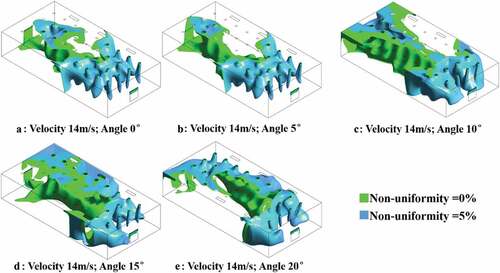
Figure 16. Non-uniformity of relative humidity for different air curtain settings (a. Percentage of areas with an indoor relative humidity inhomogeneity of less than 5%, b. Percentage of areas with an indoor relative humidity inhomogeneity of less than 10%).
3.3. Energy consumption analysis based on heat and moisture transfer
In the calculation of building energy consumption, the heat and humidity transfer from external windows is an important basis for the calculation of indoor heat and humidity loads, the results of which could influence the operation and regulation of indoor air conditioning systems. To clarify the effect of increased air curtains on the control of plant temperature and humidity and the effect of changing the incident velocity and incident angle on the control effect. The heat and humidity transfer at the left and right windows of the plant for each of the 46 experiments are calculated separately to calculate the cooling energy consumption and regenerative steam consumption.
Based on the equations listed in 1.7 above, the energy consumption for cooling and regenerative steam consumption for each of the 46 experimental groups in operation are calculated, the results of which are shown in .
Figure 17. Cooling energy consumption and regenerative steam consumption (a. Cooling energy consumption, b. regenerative steam consumption).
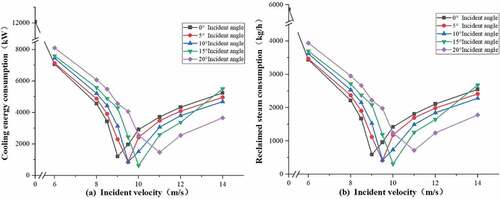
The graph shows that when the incident velocity is less than 9.5 m/s, the increase in angle had an opposite effect on the energy efficiency of the plant. Therefore, a vertical incident is the best choice when the incident velocity is less than 9.5 m/s. The optimum cooling energy consumption is reduced by 84.03% compared to the absence of an air curtain. The optimum incident velocity is found to be 10 m/s and the optimum incident angle is 15° when the incident velocity is in the range 9.5 m/s – 11 m/s. The cooling energy consumption and regenerative steam consumption with this control effect is reduced by 94.73% compared to no air curtain. Therefore, it is concluded that the use of an air curtain with this parameter effectively isolates the exchange of moisture between indoor and outdoor areas and reduces the energy consumption of the plant for low dew point treatment. Finally, combined with the temperature distribution, it can be seen that at incident velocity greater than 10 m/s, cool air is lost from the windows at the windward side of the plant, increasing the energy consumption for low dew point treatment of the plant. Thus, choosing an air curtain with an incident velocity of in the range 9.5 m/s – 11 m/s will achieve the best energy savings.
4. Conclusions
This paper proposes and evaluates the selection of air curtains with different incident velocity and different incident angle to improve the control of temperature and humidity inside the plant. Numerical simulations are performed to evaluate the distributions of temperature and relative humidity in coupled indoor and outdoor environment of the plant. The incident velocity of air curtain ranges from 6 m/s to 14 m/s, and the incident angle of airflow ranges from 0° to 20°. There are 45 cases performed to investigate the control effect of air curtains on plant temperature and humidity. The case without air curtain is set as the reference case to evaluate the distinction of temperature and humidity in other cases with air curtain(s) in the plant. The conclusions and design recommendations are as follows:
(1) The incident angle and velocity of airflow from air curtain have a significant influence on indoor temperature and humidity of the plant. For the incident velocity smaller than 9.5 m/s, the cases with incident angle 0° have the best performance to reduce the exchange of heat and humidity between indoor and outdoor of the plant. When the incident velocity is greater than 9.5 m/s, the impact of the incident angle is smaller. The average plant temperature and moisture content tend to converge to certain values, respectively. It is found that the average temperature drops by 2.9°C and the average humidity content drops by 86% for the best settings of air curtain. The results from the cases with different jet velocities and angles can provide reference data for low humidity plants to determine a better range of air curtain settings.
(2) For all cases, the average temperature and moisture content of indoor environment decrease as the airflow velocity from air curtain increases. The volume fraction in the plant is above 60% for the humidity inhomogeneity of less than 3%. And the relative uniform fields are mainly located along the central axis. For the processes that require lower humidity, the facilities should be located in specific regions to ensure the quality of the products. Therefore, the humidity inhomogeneity distributions from different cases can help to select the best locations for processes performed in low humidity.
(3) For the low dew point dehumidification, the energy consumption of cooling and steam generating are analyzed. The optimum parameters of air curtain are discussed according to the indoor environment and energy consumption. It is found that the case with an incident velocity of 10 m/s and an incident angle of 15° can provide the best wrapping effect on the plant and have the lowest energy consumption. The methods and results of the investigation of dehumidification energy consumption can help low-humidity plants to evaluate the effectiveness of air curtains on maintaining indoor environment of the plant and conduct further economic analysis.
Acknowledgments
The study was sponsored by the Natural Science Foundation of Fujian Province (No.2020J01691).
Disclosure statement
No potential conflict of interest was reported by the author(s).
Additional information
Funding
References
- Alipourtarzanagh, E., A. Chinnici, G. J. Nathan, and B. B. Dally. 2020. “Experimental Investigation on the Influence of an Air Curtain on the Convective Heat Losses from Solar Cavity Receivers under Windy Condition.” AIP Conference Proceedings Daegu, South Korea. 080001.
- ANSYS. 2013. “ANSYS Fluent 14.0: Theory Guide.” Canonsburg: Ansys Inc, in Chinese.
- Blocken, B. 2015. “Computational Fluid Dynamics for Urban Physics: Importance, Scales, Possibilities, Limitations and ten Tips and Tricks Towards Accurate and Reliable Simulations, Build.” Environment 91: 219–245.
- Chen, Y.-G. 2009. “Parametric Evaluation of Refrigerated Air Curtains for Thermal Insulation.” International Journal of Thermal Sciences 48 (10): 1988–1996. doi:10.1016/j.ijthermalsci.2009.03.003
- Deo, R. C., G. J. Nathan, and J. Mi. 2007. “Comparison of Turbulent Jets Issuing from Rectangular Nozzles with and without Sidewalls.” Experimental Thermal and Fluid Science 32 (2): 596–606. doi:10.1016/j.expthermflusci.2007.06.009.
- Duan, R., and J. Liu. 2020. “Comparative Study on pollution-block Performance of ceiling-supply Air Curtain System for Commercial Building Entrance”. Building Simulation Conference Proceedings Rome, Italy.650–656.
- Foster, A. M., M. J. Swain, R. Barrett, P. D’Agaro, L. P. Ketteringham, and S. J. James. 2007. “Three-dimensional Effects of an Air Curtain Used to Restrict Cold Room Infiltration.” Applied Mathematical Modelling 31 (6): 1109–1123. doi:10.1016/j.apm.2006.04.005.
- GB 50009-2012. 2012. Load code for the design of building structures. Beijing: National Standards of the People’s Republic of China, in Chinese. 30–62 .
- Geng, F., C. Gui, Y. Wang, F. Zhou, S. Hu, and G. Luo. 2019. “Dust Distribution and Control in A Coal Roadway Driven by an Air Curtain System: A Numerical Study.” Process Safety and Environmental Protection 121: 32–42. doi:10.1016/j.psep.2018.09.005.
- Gil-Lopez, T., J. Castejon-Navas, M. A. Galvez-Huerta, and P. G. O’Donohoe. 2014. “Energetic, Environmental and Economic Analysis of Climatic Separation by Means of Air Curtains in Cold Storage Rooms.” Energy and Buildings 74: 8–16. doi:10.1016/j.enbuild.2014.01.026.
- Goubran, S., D. Qi, W. F. Saleh, L. (Leon) Wang, and R. Zmeureanu. 2016. Experimental Study on the Flow Characteristics of Air Curtains at Building Entrances. 105 225–235. doi:10.1016/j.buildenv.2016.05.037
- Guyonnaud, L., C. Solliec, M. Dufresne de Virel, and C. Rey. 2000. “Design of Air Curtains Used for Area Confinement in Tunnels.” Experiments in Fluids 28 (4): 377–384. doi:10.1007/s003480050397.
- Huang, Y. 2005. “Numerical Simulation of Flow-field around the Building Based on FLUENT”. Master Thesis. Huazhong University of Science and Technology, in Chinese.
- JB/T 9067-1999. 1999. “Air Curtain.” S. Beijing: National Standards of the People’s Republic of China, in Chinese.
- Jiang, Y., D. Alexander, H. Jenkins, R. Arthur, and Q. Y. Chen. 2003. “Natural Ventilation in Buildings: Measurement in a Wind Tunnel and Numerical Simulation with large-eddy Simulation.” Journal of Wind Engineering and Industrial Aerodynamics 91 (3): 331–353. doi:10.1016/S0167-6105(02)00380-X.
- Li, S. B. “Empirical Formula of Temperature and Saturated Humidity Ratio, HV&AC.” 2003. 112–113.
- Liu, F. R. 2006. “Conversion between Mass Flow Rate of Evaporating Water and Heat Power of Steam Boilers.” China Special Equipment Safety 22: 63–68.
- Liu, J., and J. Niu. 2016. “CFD Simulation of the Wind Environment around an Isolated high-rise Building: An Evaluation of SRANS.” Building and Environment 96: 91–106. doi:10.1016/j.buildenv.2015.11.007.
- Liu, Y., and H. L. Wang. 2020. “Exploration of energy-saving Design of HVAC in Industrial Plants.” Plant Maintenance Engineering 20: 179–181.
- Navaz, H. K., B. S. Henderson, R. Faramarzi, A. Pourmovahed, and F. Taugwalder. 2005. “Jet Entrainment Rate in Air Curtain of Open Refrigerated Display Cases.” International Journal of Refrigeration 28 (2): 267–275. doi:10.1016/j.ijrefrig.2004.08.002.
- P4450E-1996. 1996. Recommendations for Loads on Building. Tokyo: Architectural Institute of Japan, in Japanese.
- Rai, A., J. Sun, and S. A. Tassou. 2019. Three-dimensional Investigation on the Positioning of Air Curtain on Its Effectiveness in Refrigerated Vehicles Used for Food Distribution. 224–231. Energy Procedia.
- Ramponi, R., and B. Blocken. 2012. “CFD Simulation of cross-ventilation for a Generic Isolated Building: Impact of Computational Parameters.” Building and Environment 53: 34–48. doi:10.1016/j.buildenv.2012.01.004.
- Shen, X., G. Zhang, and B. Bjerg. 2012. “Comparison of Different Methods for Estimating Ventilation Rates through Wind Driven Ventilated Buildings.” Energy and Buildings 54: 297–306. doi:10.1016/j.enbuild.2012.07.017.
- Tominaga, Y., A. Mochida, R. Yoshie, H. Kataoka, T. Nozu, M. Yoshikawa, and T. Shirasawa. 2008. “AIJ Guidelines for Practical Applications of CFD to Pedestrian Wind Environment around Buildings.” Journal of Wind Engineering and Industrial Aerodynamics 96 (10–11): 1749–1761. doi:10.1016/j.jweia.2008.02.058.
- Toparlar, Y., B. Blocken, B. Maiheu, and G. J. F. van Heijst. 2017. “A Review on the CFD Analysis of Urban Microclimate.” Renewable Sustainability Energy Review 80: 1613–1640.
- Wang, L., and Z. Zhong. 2014. “An Approach to Determine Infiltration Characteristics of Building Entrance Equipped with Air Curtains.” Energy and Buildings 75: 312–320. doi:10.1016/j.enbuild.2014.02.020.
- Yang, S. 2019. Wind effects on air curtain performance at building entrances. Building and Environment. 13
- Yin, S., W. Nie, Q. Liu, and Y. Hua. 2019. “Transient CFD Modelling of space-time Evolution of Dust Pollutants and air-curtain Generator Position during Tunneling.” Journal of Cleaner Production 239: 117924. doi:10.1016/j.jclepro.2019.117924.
- Yu, L.-X., F. Liu, T. Beji, M.-C. Weng, and B. Merci. 2018. Experimental study of the effectiveness of air curtains of variable width and injection angle to block fire-induced smoke in a tunnel configuration 134: 13–26. doi:10.1016/j.ijthermalsci.2018.07.044
- Zhao, R. 2009. Air Conditioning. Beijing: China Architecture & Building Press, in Chinese.