
 ?Mathematical formulae have been encoded as MathML and are displayed in this HTML version using MathJax in order to improve their display. Uncheck the box to turn MathJax off. This feature requires Javascript. Click on a formula to zoom.
ABSTRACT
The objective of this study is to perform an economic analysis of the luminaire-level control of LED lighting in a small office. For this, energy consumption and illuminance were measured for one year in a space where the luminaire-level controller of LED lighting was installed, and the evaluation of the integrated energy performance of dimming control LED was performed through energy analysis simulation. The annual energy saving cost was calculated based on the annual energy consumption, and the economic analysis was performed through the payback period method by comparing the energy consumption with the initial cost. As a result of the simulation to which the measured data was applied, the annual energy cost was reduced by 26.8–34.2% according to the Window-to-Wall Ratio (WWR) of dimming control LED compared to fluorescent lamps. In the case of 100% WWR and south-facing orientation, the payback period of dimming control LED was 2.41 years compared to the fluorescent lamp, which was the smallest, while in the case of 40% WWR and east-facing orientation, the payback period was 3.89 years, which was the largest. In addition, when occupancy sensor control is considered, it was found that the payback period can be further reduced.
1. Introduction
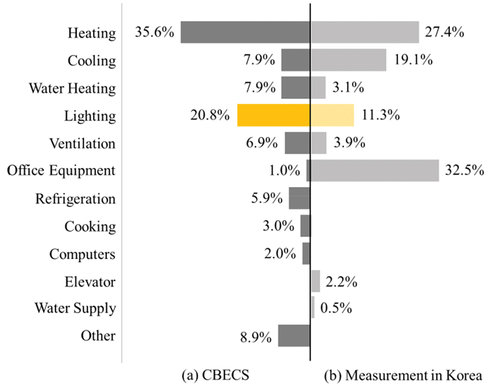
Interest in energy conservation has been continuously growing as global warming is maximized around the world. Also, Korea is promoting the transition to a carbon-neutral country with the goal of 2050. Efforts are needed to reduce greenhouse gas emissions in each major sector, and the reduction in the building sector, which accounts for approximately 34% of total energy consumption, is no exception. If the energy used in a building is classified by main use, it can be composed of heating, cooling, hot water supply, lighting, ventilation, elevator, etc. According to CBECS data, lighting energy consumption in buildings accounts for 20.8% (Landsberg et al. Citation2020), and actual measurement of energy consumption by use of office buildings in Korea showed that the ratio of energy consumption for lighting reached 11.6% (Ministry of Land, Infrastructure and Transport of the Republic of Korea Citation2020) as shown in . Furthermore, lighting energy is important in terms of overall energy consumption because it can affect the consumption of heating and cooling energy in a building, and an appropriate saving strategy is required (Kim and Yim Citation2009).
Figure 1. End-use percentages in building energy.
LED (light emitting diode) lighting with characteristics such as eco-friendliness and high efficiency has attracted attention to reducing the energy consumed by lighting (Kim et al. Citation2020). LED lighting has a higher unit cost and higher initial cost compared to fluorescent lamps, however, energy consumption and carbon emissions are lower due to low power consumption and the longer lifespan of the light source (Cho et al. Citation2012).
Also, most offices are open during the day, therefore we can take advantage of the abundant natural light resources, and there is a growing interest among architects and building engineers in integrating daylight and artificial lighting as a means to reduce the energy consumption of buildings (Li and Lam Citation2000; Krarti, Erickson, and Hillman Citation2005).
Daylight control systems can now detect typical daylight levels and automatically dim artificial lighting accordingly (Lee and Selkowitz Citation2006). Furthermore, if the occupancy sensor control is added to individual LED lightings, it will have the effect of further reducing the annual lighting energy consumption. It has also been found that the influx of daylight can lower the lighting load of the building, and the luminous efficiency of daylight is much greater than that of artificial lighting. Thus, less artificial lighting is required for the same amount of lighting requirement, and consequently less heat is emitted (Udhwani and Soni Citation2021).
When a building is properly designed, daylight helps to reduce the electricity consumption and cooling load caused by artificial lighting (Alrubaih et al. Citation2013), while a reduction in LPD (lighting power density) can have a negative effect by increasing the heating load, therefore an integrated study on how to optimize the total energy consumption is needed (Galasiu, Atif, and MacDonald Citation2004; Yang and Nam Citation2010; Chung, Liu, and Seong Citation2019).
Intelligent control such as Luminaire-Level Lighting Control (LLLC) (ASHRAE, U.S. GBC, and U.S. DOE Citation2019) used for increasing energy saving of LED lighting is emerging recently. LLLC integrates daylight and occupancy sensor control for each individual luminaire and has a built-in wireless network interface. These intelligent LED lightings control the brightness using a sensor that detects the illuminance and movement of occupants for each luminaire while maintaining the indoor target illuminance and remarkably reducing lighting energy.
However, there are few papers on LLLC of LED lighting except for control algorithm (Pandharipande and Caicedo Citation2015) and strategy (Snyder Citation2020). This is because LLLC is the latest control technology applied to LED lighting, and it is thought to be due to the initial stage in actual building application. Therefore, for effective decision-making to efficiently apply LLLC of LED lighting, it is necessary to analyze the energy saving effect through actual measurement for a sufficient period and to perform an integrated economic analysis considering the effect of lighting control on heating and cooling energy consumption.
Thus, in this study, a lighting control system was applied to an actual space to analyze the light environment performance and energy-saving effect when dimming control of LED lighting was applied, and illuminance and energy consumption were measured for one year. Furthermore, the DesignBuilder ()(DesignBuilder Software Ltd 2022) program was used as a building energy analysis simulation tool for an integrated study of lighting and cooling/heating energy consumption. The energy-saving performance of the dimming control system was evaluated from the perspective of total energy consumption that integrates the lighting and cooling/heating energy through energy simulation under various conditions. The annual energy consumption was also analyzed in consideration of the lighting energy saving rate through the addition of the occupancy sensor, and the economic feasibility was evaluated through the payback period method. The objective of this study is to present reference data that can help in decision-making on the application of LED lighting control systems to reduce energy and energy costs in office buildings by utilizing the quantitative results of this economic analysis.
2. Preliminary study of measurement
2.1. Outline of measurement
In this study, the energy-saving effect of the LED dimming control system of LLLC was measured, and D University’s laboratory located in Seoul was selected to evaluate the indoor light environment performance. The measurement was carried out for one year from January to December 2021, the measurement time was from 09:00 to 18:00 based on the actual occupancy schedule in a general office, and the schedule was set to turn on automatically only at that time. Measurement data were stored in the data logger every 1 minute. shows the conditions for the measurement room and shows the relationship between the test building and the adjacent building and the floor plan of the test building.
Figure 2. The relationship between the measurement room and the adjacent building.
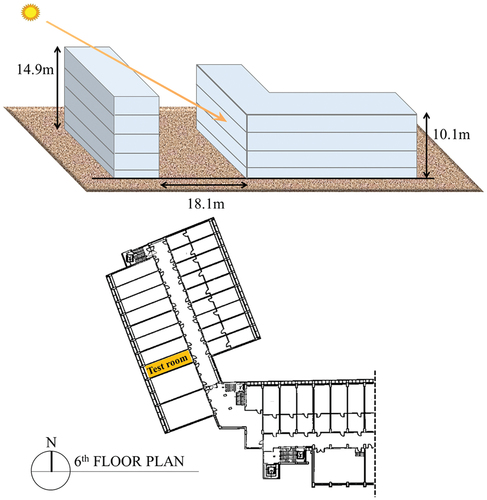
Table 1. Test building information.
4 illuminance meters for measuring the illuminance of the indoor work plane are installed at the bottom of each LED lighting at a height of 0.8 m from the floor to verify the target illuminance maintenance performance of the dimming control system through the analysis of the indoor illuminance distribution according to the sky condition, and illuminance sensors (vertical and horizontal) for measuring external daylight illuminance were installed on the window side and the roof, respectively.
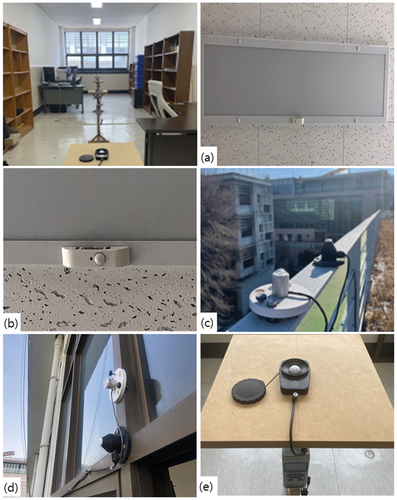
In addition, a wattage analyzer was installed to measure the lighting energy consumption, and the lighting energy-saving effect was evaluated. The luminaire used is four lightings of 40 W LED, the one located closest to the window is named LED #1, and the one located farthest from the window is named LED #4. shows the configuration diagram of the measurement system installed in the measurement room, shows the view of the measurement room, and the actual system installation of labeled (a) to (e))
Figure 3. System diagram for measurement.
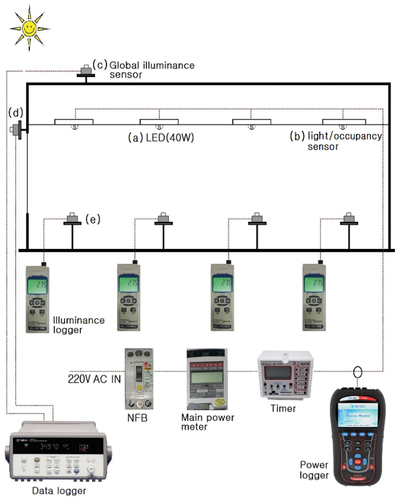
Figure 4. Measurement room view and detailed system image.
The lighting equipment was replaced with four lightings of 40 W LED from the existing 4 lamps of 32 W × 2 fluorescent before the application of the dimming system to find out the lighting design conditions of the measurement room, and the indoor illuminance distribution and power consumption of fluorescent lamps and LED lighting were measured. Through this, the lighting design conditions of the measurement room were identified.
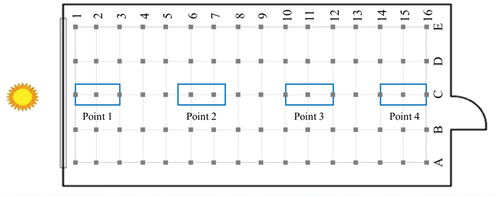
Next, an LLLC system with integrated dimming and occupancy sensor control was attached to each LED lighting, and the power consumption when replaced with a dimming control LED was measured and compared with existing lighting equipment. The target illuminance was set to 500 lux during dimming control, which is the recommended illuminance for an office space according to KS A 3011, and shows the illuminance measurement points.
Figure 5. Measurement points of measurement room.
2.2. Measurement of power consumption for each lighting source
In this section, the power consumption of each lighting luminaire was measured with a wattage analyzer to compare the power consumption when replacing the existing lighting equipment from fluorescent lamps to LED lighting before applying the control system. The average value of the three measurements of the power consumption of a total of 4 lamps of 32 W × 2 fluorescent installed in the measurement room is 233.5 W.
The rated power consumption of the fluorescent lamp is 32 W, but the actual measured power is approximately 29 W, which is slightly different. Based on this, the daily power consumption is calculated as 233.5 W × 9 hours = 2,101.5Wh.
The power consumption of four lightings of 40 W LED installed in the measurement room after replacing the fluorescent lamp was measured three times for each dimming rate of 10 to 100%, and the average value was summarized. As a result of power measurement, the rated power consumption of LED lightings is 40 W, but the actual measured power is 41.5 ~ 42.0 W, which is different. Therefore, the daily power consumption is 167.1 W × 9 hours = 1,503.9Wh if the dimming rate of LED lighting is 100%.
The illuminance of the fluorescent and LED lightings was measured, respectively, during the nighttime when daylight was not introduced to understand the lighting design conditions of the measurement room, and shows the illuminance measurement points.
shows the result of the illuminance measurement of a fluorescent lamp, and the ranges of the abscissas (1–16) and the legends (A to E) indicate the same illuminance measurement points as in . The LED lighting showed a 100 lux higher illuminance distribution than the fluorescent lamp when compared to the case where the LED lighting maintained a dimming output of 100%. The dimming output of LED lighting should be maintained at 90% to maintain a similar illuminance value for LED lighting and fluorescent lamps as shown in .
Figure 6. Illuminance distribution of the fluorescent lamp.
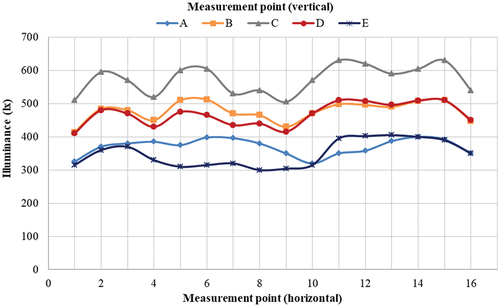
Figure 7. Illuminance distribution of LED lighting.
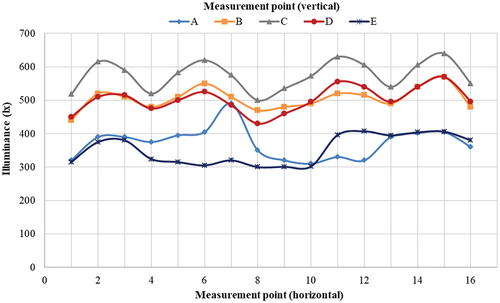
Therefore, if the dimming rate of the LED lighting is 90%, the daily power consumption is 139.1 W × 9 hours = 1,251.9Wh.
2.3. Analysis of indoor illuminance before applying the dimming control system
shows the distribution of illuminance on the work plane when the lighting is turned off on June 21 (4 cloud amount, 11.1 h of sunshine hours), a summer solstice day with a lot of daylight inflow. The external illuminance was 58,004 lux in the horizontal plane and 46,557 lux in the vertical plane.
Figure 8. The illuminance of work plane when the lighting is off.
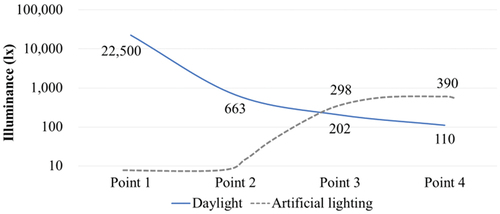
A lot of daylight enters the window side, which can cause visual discomfort, and the illuminance tends to decrease considerably as you go inside the room. In , the part indicated by the dotted line requires artificial lighting to maintain the target illuminance, point 1 and Point 2 are turned off, and point 3 and point 4 need partial lighting. Therefore, a daylight-responsive lighting control system is needed to maintain a uniform illuminance in the indoor space and save lighting energy as the lighting rate changes according to the depth of the room with the proper harmony of daylight and artificial lighting.
3. LED performance evaluation using dimming control
3.1. Outline of dimming control system
The LLLC used in this study is equipped with an intelligent complex sensor consisting of a passive infrared sensor (PIR) that detects the movement of an infrared emitter, and an ambient light phototransistor sensor that detects the amount of ambient light in each luminaire.
This reduces lighting energy consumption while maintaining optimal illuminance through daylight-responsive dimming, which controls the brightness of each LED lighting according to the ambient illuminance, and turns on/off by detecting the movement of occupants. Thousands of lightings can be wirelessly controlled and managed with a single remote control without additional devices by simply attaching a controller to the lightings.
In this study, motion detection control is excluded and only dimming control is applied since the measurement room is a space used intermittently as a laboratory.
3.2. Illuminance on work plane and energy-saving performance according to sky condition
Since the direct daylight component of the sun directly affects the illuminance sensor, it is very important to consider the sky condition to analyze the dimming rate by daylight or to evaluate the effect on energy saving (Kim and Kim Citation2003).
In this study, the classification of sky conditions using the number of clouds is applied. The sky condition is classified into clear sky, partly cloudy sky, and overcast sky (Yang, Kim, and Kim Citation1991). This is a method in which the amount of cloudiness in the sky is divided into 10 equal parts, and the amount of cloudiness of 0 ~ 2, 3 ~ 7, 8 ~ 10 is a clear sky, partly cloudy sky, and an overcast sky, respectively.
For this purpose, actual meteorological data from the Meteorological Data Open Portal ()(Korea Meteorological Administration 2021) was used.
The external illuminance distribution and the indoor illuminance distribution were analyzed according to the three sky conditions to analyze the illuminance on the indoor work plane according to the external illuminance. The summer solstice, the spring equinox, and the winter solstice, which are the measurement days, where the change in illuminance according to the sky conditions are expected to be mostly clear, were analyzed as measurement cases, and cases that did not meet the classification criteria for sky conditions were analyzed by setting them as adjacent days.
shows the distribution of external illuminance and indoor illuminance in clear sky conditions as an example of measurement on June 04 (1 cloud amount, 10.9 h of sunshine hours). The maximum external illuminance on the measurement day was 97,551 lux on the horizontal plane at 13 o’clock, 53,089 lux on the vertical plane at 10 o’clock, and the average illuminance on the indoor work plane was 1,279 lux.
Figure 9. External and internal illuminance and power under dimming control (clear sky, June 04).
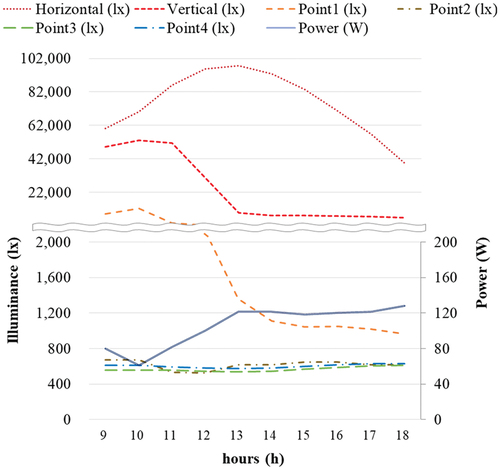
This high average illuminance resulted from strong direct sunlight entering point 1 located on the window side in the morning when the sun’s altitude is low while uniform illuminance is maintained at points 2, 3, and 4 (shown in ). Furthermore, instantaneous power fluctuated according to changes in indoor illuminance as a result of instantaneous power measurement, and the power consumption for that day was 974.0Wh. The energy-saving rate was 35.2% on June 04 (clear sky) since the no dimming LED consumes 1,503.9Wh without dimming control.
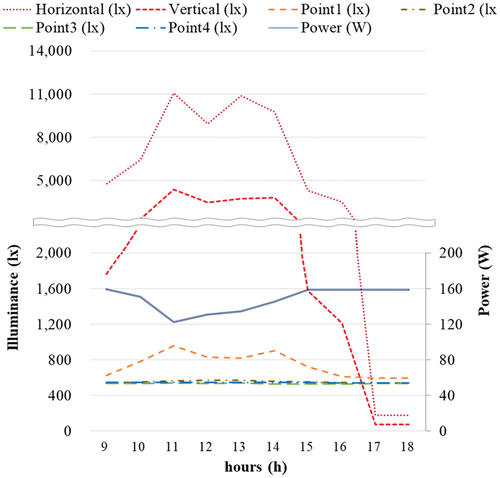
shows the distribution of illuminance in the partly cloudy sky conditions as a measurement case of September 23, the autumn equinox day (6 cloud amount, 8 h of sunshine hours). The maximum external illuminance on the measurement day was 79,679 lux at 13 o’clock in the horizontal plane and 65,987 lux at 10 o’clock in the vertical plane. The average illuminance on the indoor work plane including daylight and artificial lighting is 1,134 lux, which maintains a relatively uniform illuminance on the work plane compared to that of the clear sky, but the illuminance at point 1 is far exceeding the target illuminance of 500 lux due to the influence of direct daylight.
Figure 10. External and internal illuminance and power under dimming control (Partly cloudy sky, September 23).

In addition, the maximum illuminance on the vertical plane around 10 am in both measurement cases is because the building is adjacent to the east side of the measurement room.
In addition, the amount of power consumed on this day was 1,048.9Wh, which showed a 30.3% energy saving rate compared to the no dimming LED.
shows the distribution of illuminance in the condition of the overcast sky as a measurement case on December 24 (9 cloud amount, 0 h of sunshine hours). The maximum external illuminance on the measurement day was 11,074 lux and 4,358 lux on both the horizontal and vertical planes at 11 o’clock.
Figure 11. External and internal illuminance and power under dimming control (Overcast sky, December 24).
The average illuminance on the indoor work plane including daylight and artificial lighting is 592 lux, maintaining a uniform illuminance level, but it is predicted that the energy-saving rate will be low because the illuminance on work plane is maintained mainly by artificial lighting. The amount of power consumed on the day of measurement was determined to be 1,373.8Wh, and the energy-saving rate was 8.7%, which is relatively low. However, it is concluded that the potential of lighting energy-saving effect is clear when the lighting control system is applied as a result of measurement in three sky conditions.
As the room is facing east, daylight availability (or dimming rate) may be lower compared to other orientations because there is a sufficient amount of daylight available in the morning but not in the afternoon (Babu et al. Citation2019).
In addition, there is a result that south-facing has a higher probability of daylight inflow than east-facing or west-facing (Kunwar et al. Citation2019).
Therefore, it is necessary to comprehensively evaluate the performance of the LLLC system in terms of the impact on the total energy consumption according to the building orientation, which will be discussed in detail in Chapter 4.
3.3. Weekly performance evaluation
shows an example of LED power consumption under dimming control and the illuminance of the vertical plane of the window by the daylight from 09:00 to 18:00 for 7 days (from May 31 till June 06), and it consists of weather conditions of 1 day in a clear sky condition, 3 days in a partly cloudy sky condition, and 3 days in an overcast sky condition.
Figure 12. Vertical illuminance and power consumption.
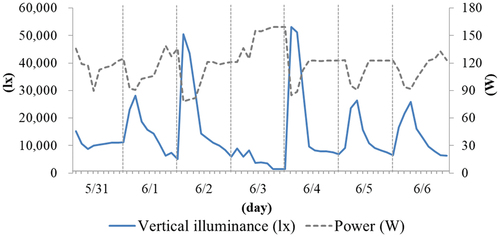
The LED lighting is automatically dimmed as the brightness of daylight gets brighter, showing that the instantaneous power is reduced.
On the other hand, the instantaneous power does not decrease below 80 W no matter how high the external illuminance is because LED #3 and LED #4, which are luminaires far from the window, are always on because they are less affected by daylight. When the power consumption during the measurement week was compared with the expected existing LED power consumption without dimming control, the energy-saving rate was 29.6%.
3.4. Yearly lighting energy-saving performance
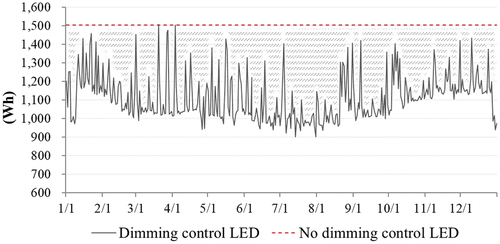
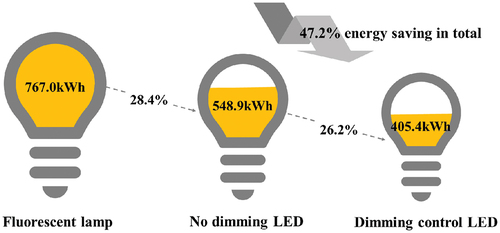
shows the daily power consumption according to whether or not LED dimming control is applied during the measurement period of one year (January 01 to December 31). In the case of clear sky condition, when the LED dimming system is applied, the daily power consumption is shown as low as 900 ~ 1,100Wh or less, and in most cases, it does not exceed 1,400Wh even in the case of overcast sky condition. In this study, the shaded part represents the amount of energy savings. In this actual measurement, the power consumption for one year was reduced from 548.9 kWh to 405.4 kWh when the no dimming LED was replaced with a dimming control LED, which showed a 26.2% reduction effect.
Figure 13. The daily power consumption comparison.
Next, the reduction rate of total power consumption when fluorescent lamps were changed to dimming control LEDs, was calculated based on the actual measurement results of the amount of power consumption for each luminaire.
First, when the fluorescent lamp (32 W × 2EA) is changed to 40 W LED, the energy-saving rate is as follows:
When the fluorescent lamp is changed to a dimming control LED, the energy saving rate is as follows:
is a diagram showing the energy saving rate between fluorescent lamps, 40 W LEDs, and dimming control LEDs.
Figure 14. Energy saving rate for each lighting.
4. Evaluation of electric energy consumption and economic analysis using building energy simulation
4.1. Outline of energy simulation
The energy saving performance and economic feasibility of the dimming control system were analyzed through the analysis of the total energy consumption including cooling, heating, and lighting energy between fluorescent lamps, no dimming LED, and dimming control LED under various conditions by changing the variables in the same modeled state as in the actual measurement room.
The WWR (Window-to-Wall Ratio) and azimuth were set as representative variables that simultaneously affect the daylight inflow and the heating and cooling load.
In addition, it was impossible to evaluate motion detection during the actual measurement due to the characteristics of the actual measurement room, but in this section, the economic feasibility was analyzed through adding the occupancy sensor control. Therefore, in this study, DesignBuilder ()(DesignBuilder Software Ltd 2022), a building energy analysis simulation program based on EnergyPlus ()(U.S. Department of Energy 2022), was used to comprehensively analyze energy consumption between daylight usage and heating and cooling loads.
The model to be calculated for the annual energy consumption was modeled the same as the actual measurement room except for the WWR and azimuth.
In addition, shows the detailed building information for energy simulation, and the simulation period was set for one year including holidays.
Table 2. Building description for simulation.
shows the LPD of a fluorescent lamp and no dimming LED calculated through the power consumption and energy saving ratio based on the measurement data, and was input as lighting data for lighting energy simulation.
Table 3. Lighting power density for simulation.
The annual energy consumption of dimming control LED was calculated by applying the measured LPD of no dimming LED to the simulation of dimming control. In addition, the WWR is set to 4 types of 40%, 60%, 80%, and 100%, and azimuth is set to 3 types of −90E° (east-facing orientation), 0S° (south-facing orientation), and 90 W° (west-facing orientation) to compare the annual energy consumption according to the glazing type and building orientation. Here, the base case is based on WWR 40%, −90°E, which has the largest annual energy consumption, and the energy-saving rate according to the change of the variable is summarized.
Therefore, the simulation was performed by changing the LPD, WWR, and azimuth, and the total number of simulation cases was 36.
4.2. Analysis of energy consumption according to the window to wall ratio and azimuth
To analyze the total energy consumption according to WWR and azimuth that affect lighting energy and heating and cooling energy, an energy analysis simulation was performed, and annual energy consumption was calculated considering even motion detection, which was difficult to apply in actual measurement. When occupancy sensor control was applied, lighting energy consumption was reduced by approximately 17.4% (Thornton et al. Citation2010). Using this value, the annual energy consumption and payback period were calculated based on the assumption that the lighting energy saving rates due to motion detection were 10% and 20%.
shows examples of calculation results for annual energy consumption by the lighting system, WWR, and azimuth based on the base case (WWR 40%, −90°E). In addition, the annual energy consumption is shown in the table assuming that lighting energy is reduced by 10% and 20% when dimming control LED and motion detection are applied.
Table 4. Example of the annual energy consumption comparison.
First, lighting energy and cooling energy tend to decrease while heating energy increases as a result of analyzing the energy consumption according to the lighting system in the base case (WWR 40%, −90°E). This means that the application of the lighting system is advantageous for cooling energy consumption and disadvantageous for heating energy consumption due to the decrease in internal heat gain due to artificial lighting, which is similar to the results of related studies (Bodart and Herde Citation2002; Yang and Nam Citation2010). The total annual energy consumption of dimming control LED, which integrates lighting and heating and cooling energy, was reduced by 14.3% compared to no dimming LED and 26.8% compared to fluorescent lamps; therefore, the energy-saving effect of the dimming control system was verified.
Secondly, the simulation results of the dimming control LED according to the change in WWR are shown in shades in based on the base case (WWR 40%, −90°E). As a result of the analysis, as the WWR increased, lighting energy was reduced by 22.4%, 26.6%, and 43.1%, respectively, compared to the base case by 60%, 80%, and 100%, and heating energy increased by 1.9%, 2.6%, and 4.0% and cooling energy were increased by 15.0%, 35.0%, and 50.1%.
Heating energy consumption increases with increase in WWR, but it is analyzed that the degree is very small. It is concluded that the decrease in the heating load due to the inflow of daylight and the increase in the heating load through the decrease in the density of illuminance due to the inflow of daylight has a complex effect, and the results are concluded to be similar in degree.
In the case of cooling energy, it was analyzed that the increase of summer cooling energy consumption due to the increase of solar heat gain through the window was higher than the decrease of cooling energy consumption due to the decrease of internal heat gain through the daylight-responsive lighting control.
Therefore, the reduction rate of the total annual energy consumption through integrating lighting and heating and cooling energy was 3.4%, 0.0%, and 1.6%, respectively, from 60%, 80%, and 100% compared to the base case. In this study, the case of 60% WWR shows the lowest annual energy consumption.
In the dimming control LED, the energy consumption according to the change of azimuth based on the base case (WWR 40%, −90°E) is indicated by the text frame in .
As a result of the analysis, the heating energy decreased by 1.6% at 0°S and increased by 4.0% at 90°W, and the cooling energy was decreased by 8.5% at 0°S and increased by 1.6% at 90°W compared to the base case.
Since the analysis building is located in the northern hemisphere, in terms of heating energy consumption, there is a lot of solar radiation flowing into the building because the solar altitude is low in winter, and in terms of heating energy consumption, there is less solar radiation flowing into the building because the solar altitude is high in summer, meaning that the south-facing is effective.
Considering that lighting energy is reduced by 24.6% in case of 0°S and 11.8% in case of 90°W compared to the base case, as the azimuth changes, energy consumption is affected as the sensitivity in the order of lighting>cooling>heating energy.
As a result, it is analyzed that annual energy consumption is reduced by 11.0% and 1.9% when the azimuth is 0°S and 90°W compared to the base case. Therefore, it was determined that the annual energy consumption was the lowest at 0°S.
4.3. Computation of the initial cost and the annual saving cost of the dimming control system
The payback period method was used to analyze the economics of the lighting control system. The payback period is the period it takes to recover all the cost of the investment, usually expressed in years.
There are two methods for calculating the payback period which are: simple payback and discounted payback.
The simple payback period has the disadvantage of ignoring the time value of money, while the discount payback period is calculated by applying the interest rate and discount rate in consideration of the present value of money (Serageldin et al. Citation2020).
In this study, the payback period of the dimming control system was calculated using both the simple payback period and the discount payback period to evaluate the economics from various viewpoints. First, the initial cost between fluorescent lamps, no dimming LEDs, and dimming control LEDs applied to the actual measurement room is compared.
The initial cost includes the cost of materials such as luminaires, lamps, and ballasts, and was calculated based on the cost of the Korean market as shown in . Currency units were converted based on the exchange rate (1,211KR₩ = 1US$) as of 31 March 2022. The analysis result showed that the initial cost of no dimming LED and LLLC LED was 3.6US$ and 102.7US$ more than that of fluorescent lamps.
Table 5. The initial cost for each lighting system.
The annual energy saving cost was calculated from the electrical energy consumption calculated through simulation in Section 4.3 to calculate the payback period.
Lighting is electric energy, and the VRF system is applied for heating and cooling, therefore the energy source consists of only electricity, and the energy cost is calculated through applying the Korean electricity rate system.
As of 1 January 2021, the electricity rate is 0.083 US$/kWh in summer (June to August), 0.050 US$/kWh in spring and autumn (March to May, September to October), and 0.072 US$/kWh in winter (November to February) (KEPCO Citation2021).
Therefore, if the electricity rate is calculated by summing it up for each month and then averaging the weighted average, it is 0.066US$/kWh, and the annual electricity rate is calculated by applying this value.
shows the annual energy saving cost of LED lighting compared to fluorescent lamp. In case of no dimming LED (base case: WWR 40%, −90°E), when the WWR becomes 40%, 60%, 80%, and 100%, the saving cost compared to fluorescent lamp showed a tendency to decrease to 14.6%, 14.1%, 13.6%, and 13.2%, respectively.
Table 6. Comparison of the energy saving cost.
For dimming control LED, the cost is reduced by 26.8% at 40% WWR, 31.3% at WWR 60%, 31.3% at WWR 80%, and 34.2% at WWR 100%. The energy cost is decreases with increase in WWR.
Also in Section 4.2, the cost of energy-saving attributed to the reduction of lighting energy through occupancy sensor control compared to fluorescent lamps is additionally presented in . As a result of analysis according to azimuth, energy-saving cost is reduced by 0°S > 90°W>-90°E regardless of WWR. For dimming control LED, −90°E is 26.8%, 0°S is 33.5%, 90°W was determined to reduce energy costs by 29.6%.
4.4. Analysis of the payback period of the dimming control system
In this section, the economics of the dimming control system was evaluated through applying the payback period method. The payback period of the LLLC system was calculated by comparing the initial cost in and the annual energy saving cost in .
presents the payback period through applying the simple payback period method and the discounted payback period method in parentheses. Furthermore, the economics of dimming control LED was evaluated from various viewpoints through calculating the payback period of dimming control compared to the fluorescent lamp and the payback period of dimming control LED compared to no dimming LED.
Table 7. Computation of the payback period of dimming control LED against fluorescent.
A discount rate of 3% was applied when calculating the discounted payback period, and the discount rate was calculated based on the average interest rate in the construction industry for the last five years from 2017 to 2021 and applied to this study ()(Bank of Korea 2021).
As a result of economic analysis, in the case of WWR of 40%, 60%, 80%, and 100%, the payback period of dimming control LED was determined as 3.89 years, 3.23 years, 3.13 years, and 2.78 years, respectively, when compared to fluorescent lamps based on the base case (WWR 40%, −90°E). Therefore, the payback period becomes shorter with an increase in the WWR, which is economical.
In addition, as a result of analysis according to azimuth in the base case (WWR 40%, −90°E), it was determined as 3.89 years at −90°E, 3.17 years at 0°S, 3.46 years at 90°W, and 0 In the order of °S > 90°W>-90°E, the payback period is shortened, thus showing good economics. Therefore, the case of WWR 100% and 0°S showed the shortest payback period of 2.41 years, while longest payback period was 3.89 years at WWR 40% and −90°E.
Energy Efficiency Measures (EEMs) are selected for energy savings for small office buildings that are available in the market and that together provide energy cost savings and total first cost which approaches a five-year simple payback. (Thornton et al. Citation2010). Therefore, it is concluded that dimming control LED compared to the fluorescent lamp is economical in all cases and can be applied as EEM. In this study, it was analyzed that if occupancy sensor control is additionally applied, the payback period of 2.41 years at WWR 100% and 0°S can be reduced to 2.36 years and 2.31 years.
shows the payback period of dimming control LED compared to no dimming LED. The larger the WWR, the shorter the payback period, and the shorter the payback period in the order of 0°S > 90°W>-90°E, depending on the azimuth, indicating good economics.
Table 8. Computation of the payback period of dimming control LED against no dimming LED.
On the other hand, when the WWR is 40%, the simple period is longer than 5 years, therefore it is not economical. The payback period of WWR 40% and −90°E of 8.23 years can be reduced to 6.84 years and 5.85 years if occupancy sensor control is applied. The payback period of WWR 100% and 0°S was 3.52 years, which was the shortest, and it can be reduced to 3.41 years and 3.31 years if occupancy sensor control is additionally applied. Therefore, occupancy sensor control can greatly contribute to increasing the economic feasibility of the lighting control system.
5. Conclusion
In this study, illuminance and wattage were measured for one year to evaluate the performance of the LLLC system using daylight.
Also, after modeling, the same as in the measurement room, energy analysis simulations were performed under various conditions such as the WWR (40%, 60%, 80%, and 100%) and the azimuth (−90°E, 0°S, and 90 °W).
Through this, the economics of LLLC was analyzed by calculating the annual energy consumption and payback period. The results of this study are as follows:
1) When the dimming control system is applied, the measurement room facing the east has the largest amount of power consumption reduced in the morning, while unwanted direct daylight can penetrate and cause glare.
2) The average illuminance on the indoor work plane was 568 lux, maintaining a uniform indoor illuminance level. The annual lighting energy consumption of the dimming control system was reduced by 47.2% compared to fluorescent lamps and 26.2% compared to no dimming LEDs, confirming significant lighting energy savings.
3) As a result of building energy analysis simulation, daylight inflow and LPD according to WWR and azimuth have a complex effect, therefore it should be considered when designing, and the annual energy consumption was the lowest at 60% WWR and 0°S.
4) As a result of the simulation of dimming control LED base case (WWR 40%, −90°E), energy cost was reduced by 26.8% compared to fluorescent lamps. According to WWR, when the WWR was 60%, 80%, and 100%, the cost was reduced by 31.3%, 31.3%, and 34.2%, respectively. In addition, the energy cost according to the azimuth was reduced by 33.5% for 0°S and 29.6% for 90°W, thus reducing energy costs in the order of 0°S > 90°W>-90°E.
5) As a result of the economic evaluation of dimming control LED, the simple payback period compared to fluorescent lamps was 100% WWR, which was the shortest at 0°S (2.41 years), and the WWR was 40%, and in the case of −90°E, it was the highest at 3.89 years. Therefore, the azimuth was shown to be advantageous in the order of 0°S > 90°W>-90°E with increase in WWR.
6) When additional occupancy sensor control is included, it was concluded that the simple period was reduced by 4.1–15.7% compared to fluorescent lamps. Dimming control LEDs are reduced by 6.0–28.9% compared to no dimming LEDs, but there are cases in which economic efficiency is lowered depending on lighting design conditions.
However, due to technological advances, the price of LED lightings and control systems is rapidly decreasing, therefore it is expected to be more economical in the future.
In this study, the building energy consumption by integrating the lighting control system and the heating and cooling system of a measurement room located in Seoul, Republic of Korea was analyzed. Although the ratio of heating energy appears to be larger than that of cooling energy due to the climatic characteristics of the region, there will be a difference in the ratio of energy consumption in regions with different climatic characteristics. Therefore, a design strategy considering climate and region is required.
In addition, this study was conducted in small offices, but if LED lighting in a large office building is controlled in an integrated way, including schedule control, the savings will be even greater. In conclusion, further studies are needed to analyze the economic effect of the LLLC system under various conditions.
Disclosure statement
No potential conflict of interest was reported by the author(s).
References
- Alrubaih, M. S., M. F. M. Zain, M. A. Alghoul, N. L. N. Ibrahim, M. A. Shameri, and O. Elayeb. 2013. “Research and Development on Aspects of Daylighting Fundamentals.” Renewable and Sustainable Energy Reviews 21: 494–505. doi:10.1016/j.rser.2012.12.057.
- ASHRAE, U.S. GBC, and U.S. DOE. 2019. “Achieving Zero Energy: Advanced Energy Design Guide for Small to Medium Office Buildings.”
- Babu, S., J. Zhou, M. P. Wan, A. S. Lamano, J. N. Sarvaiya, Z. Zhang, D. E. V. S. Kiran Kumar, et al. 2019. “Investigation of Integrated Automated Blinds and Dimmable Lighting System for Tropical Climate in a Rotatable Testbed Facility.” Energy and Buildings 183 (15): 356–376. doi:10.1016/j.enbuild.2018.11.007.
- Bodart, M., and A. D. Herde. 2002. “Global Energy Savings in Offices Buildings by the Use of Daylighting.” Energy and Buildings 34 (5): 421–429. doi:10.1016/S0378-7788(01)00117-7.
- Cho, S. H., M. W. Lee, H. S. Choi, and H. Kim. 2012. “Development of Economic Evaluation of Indoor Lighting System.” Journal of the Korean Institute of Illuminating and Electrical Installation Engineers 26 (1): 8–14. doi:10.5207/JIEIE.2012.26.1.008.
- Chung, W. J., C. Liu, and Y. B. Seong. 2019. “Potential Lighting and Thermal Demand Reduction in Office Buildings Using Blind Control considering Surrounding Buildings.” Journal of Asian Architecture and Building Engineering 18 (3): 262–270. doi:10.1080/13467581.2019.1641409.
- Galasiu, A. D., M. R. Atif, and R. A. MacDonald. 2004. “Impact of Window Blinds on daylight-linked Dimming and Automatic on/off Lighting Controls.” Solar Energy 76 (5): 523–544. doi:10.1016/j.solener.2003.12.007.
- KEPCO. 2021. “Electric Rates Table - General Service (A).” Accessed February 12 2022. https://cyber.kepco.co.kr/ckepco/front/jsp/CY/E/E/CYEEHP00202.jsp
- Kim, H. S., and K. S. Kim. 2003. “A Study on Lighting Energy Conservation in A Small Office Space with Daylight Dimming Control System.” Journal of the Korean Institute of Illuminating and Electrical Installation Engineers 17: 15–21.
- Kim, B. S., and O. Y. Yim. 2009. “Analysis of Light Environment and Building Energy Performance of LED Lamp Installed in Office Building.” Journal of the Architectural Institute of Korea Planning 25 (7): 329–336.
- Kim, C. H., M. K. Park, W. H. Kang, K. H. Lee, and K. S. Kim. 2020. “Mock-up Experiment and LCC Economic Analysis of LED Lighting System Dimming Control for Lighting Energy Saving in Office Buildings.” Journal of Korean Institute of Architectural Sustainable Environment and Building Systems 14 (3): 283–297.
- Krarti, M., P. M. Erickson, and T. C. Hillman. 2005. “A Simplified Method to Estimate Energy Savings of Artificial Lighting Use from Daylighting.” Building and Environment 40 (6): 747–754. doi:10.1016/j.buildenv.2004.08.007.
- Kunwar, N., K. S. Cetin, U. Passe, X. Zhou, and Y. Li. 2019. “Full-scale Experimental Testing of Integrated dynamically-operated Roller Shades and Lighting in Perimeter Office Spaces.” Solar Energy 186: 17–28. doi:10.1016/j.solener.2019.04.069.
- Landsberg, D. R., S. Carlson, F. Goldner, M. MacDonald, and R. Slosberg. 2020. Energy Efficiency Guides for Existing Commercial Buildings (Advanced Energy Design Guide), Peachtree Corners: ASHRAE.
- Lee, E. S., and S. E. Selkowitz. 2006. “The New York Times Headquarters Daylighting Mockup: Monitored Performance of the Daylighting Control System.” Energy and Buildings 38 (7): 914–929. doi:10.1016/j.enbuild.2006.03.019.
- Li, D. H. W., and J. C. Lam. 2000. “Measurements of Solar Radiation and Illuminance on Vertical Surfaces and Daylighting Implications.” Renewable Energy 20 (4): 389–404. doi:10.1016/S0960-1481(99)00126-3.
- Ministry of Land, Infrastructure and Transport of the Republic of Korea. 2020. “Development of Building Energy Integrated Support System for the Spread of Low-Energy Building.” Final Report 120. (In Korean).
- Pandharipande, A., and D. Caicedo. 2015. “Smart Indoor Lighting Systems with Luminaire-Based Sensing: A Review of Lighting Control Approaches.” Energy and Buildings 104: 369–377. doi:10.1016/j.enbuild.2015.07.035.
- Serageldin, A. A., A. Abdeen, M. M. S. Ahmed, A. Radwan, A. N. Shmroukh, and S. Ookawara. 2020. “Solar Chimney Combined with Earth to-air Heat Exchanger for Passive Cooling of Residential Buildings in Hot Areas.” Solar Energy 206: 145–162. doi:10.1016/j.solener.2020.05.102.
- Snyder, J. 2020. “Energy-saving Strategies for luminaire-level Lighting Controls.” In Building and Environment, 169.
- Thornton, B. A., W. Wang, Y. Huang, M. D. Lane, and B. Liu. 2010. “Technical Support Document: 50% Energy Savings for Small Office Buildings.” Pacific Northwest National Laboratory 2: 1.
- Udhwani, L., and A. Soni. 2021. “Evaluation of Daylighting Performance in an Office Building: A Case Study.” Materials Today: Proceedings 46 (11): 5626–5631.
- Yang, I. H., K. W. Kim, and M. H. Kim. 1991. “A Study on the Classification of Sky Condition by Cloud Ratio.” Journal of the Architectural Institute of Korea Planning & Structure 11 (1): 274–278.
- Yang, I. H., and E. J. Nam. 2010. “Economic Analysis of the daylight-linked Lighting Control System in Office Buildings.” Solar Energy 84 (8): 1513–1525. doi:10.1016/j.solener.2010.05.014.