
 ?Mathematical formulae have been encoded as MathML and are displayed in this HTML version using MathJax in order to improve their display. Uncheck the box to turn MathJax off. This feature requires Javascript. Click on a formula to zoom.
ABSTRACT
In-situ production of precast concrete (PC) members is affected by various factors, such as cost, time, quantity, lead time, number of molds, production cycle, number of cranes, and yard stock area. In particular, the yard stock area accounts for more than 84% of the total required area, which is considerably larger than the production area. This study proposes a novel scenario-based four-dimensional (4D) dynamic simulation model for sustainable in-situ production and yard stock of PC members. Using 4D simulation, this study confirms that the production and yard stock of 960 beams can be sufficiently produced on large sites of long-span and heavy-loaded buildings. Additionally, production and yard stock simulations can be quickly and easily performed according to quantity using the developed dynamic simulation algorithm. Lastly, the proposed algorithm can be used to conduct simulation studies applicable in various environments according to field conditions that change frequently.
Graphical abstract
1. Introduction
In-situ production can reduce environmental loads by 14.58% or more (Na, Han, and Son Citation2021; Lim and Kim, Citation2020a; Lim and Kim, Citation2020a) and construction cost by up to 39.4% compared to in-plant production (Hong et al. Citation2014; Lim Citation2016). Additionally, if precast concrete (PC) members are produced in-situ under the same conditions, a quality equal to or higher than that of in-plant production can be secured (Lim et al. Citation2011a, Citation2011b; Lee et al. Citation2011a). Several comparative studies have been conducted on the in-situ production of PC members considering convenience, quality, cost, and time (Li and Love Citation2000; Osman et al., Citation2003; Ning et al., Citation2010; Abdul-Rahman et al., Citation2011; IPCC, Citation2013).
In-situ production uses the same process as in a factory to perform processed rebar installation, concrete pouring, curing, and stacking. If a cured PC member has partial damage to the surface after stacking, the same process is manually performed to ensure the quality and finish (Lim and Kim Citation2021; Oh Citation2017). To elaborate, if PC members are manufactured in a factory, the production process is mostly carried out manually in the same way as in-situ production rather than through automation or robotics (Lim and Kim, Citation2020a). In general, even if PC columns and beams of the same size are designed, the arrangement of reinforcing bars is not designed with the same PC members. Therefore, manual work is required to manufacture, check, and install such PC members to match the required specifications.
Lee (Citation2012) studied the in-situ production management model of composite PC members and suggested using cost, quality, process, resources, and safety as management factors. Won et al. (Citation2013) studied the energy efficiency of in-situ production through steam curing, derived formulas to predict required input thermal energy, and presented necessary information for practical cases. Lim and Kim (Citation2020a) calculated CO2 emissions from in-situ production using a life cycle assessment method through a case study and derived a CO2 emission reduction ratio according to the quantity ratio. However, the aforementioned studies mainly focused on the production area and neglected the yard stock area.
The available space that can be secured at a construction site consists of in-situ production and yard stock areas. The yard stock area occupies more than five times the production area, accounting for a significantly high percentage of the total. It is a crucial factor because the availability of in-situ production is determined by securing the yard stock area. Lim and Kim (Citation2021) analyzed influencing factors on yard stock area, and developed an integrated management model of production and yard stock for in-situ PC production. However, the study only confirmed on a plane view whether PC members stacking was actually possible, but did not verify spatially through simulation. In other words, because verifying the practicality of yard stock by performing calculations is difficult, simulations are necessary to confirm its applicability and installation in the field. Practicality and alternative analyses of the production, yard stock, and erection process for PC members can be performed using a scenario-based 4D dynamic simulation (3D + schedule) model. To this end, a novel model of in-situ production and yard stock is proposed for PC members in this paper. Our study is limited to the in-situ production of PC beams; long-span and heavy-loaded buildings with a large floor area of 10 000 m2 or more; a floor height of approximately 10 m or more; and a unit member with weight of 10 tons or more.
This paper presents the study in the following sequence:
1) Review existing studies for in-situ production of PC members.
2) Define the factors that influence production and yard stock simulation.
3) Develop production and yard stock simulation algorithm.
4) Develop scenario model using simulation algorithm.
5) Develop production and yard stock dynamic simulation model.
6) Conduct scenario-based 4D dynamic simulation at the case site.
2. Literature review
2.1. Existing studies for in-situ PC production
Large-scale warehouse facilities require prompt construction to recover investment costs (Oh Citation2017) by reducing construction costs (labor, equipment, and overhead expenses) and shortening the construction period, allowing them to reap the economic benefits of early operation. Consequently, a PC structure is reportedly more advantageous than a reinforced concrete (RC) structure for large warehouse facilities (Park et al. Citation2007, Citation2011; Song et al. Citation2005). The PC method is gaining prevalence worldwide due to the development of and investment in related new technologies (Kang and Kim Citation2006), as well as the recent trend of large-sized warehouse facilities. Additionally, the capital-intensive PC method is advantageous when equipment and material costs are falling, and labor costs are rising (You et al. Citation2001; Yoon, Hong, and Yoon Citation2010; Hong, Kim, and Kim Citation2010). Large warehouse facilities require erecting 5–10-m-long columns and beams; therefore, temporary construction is required at a considerable scale during the construction period.
As PC is generally produced in a factory and moved to the construction site (Son et al. Citation1997; Lee Citation1994), moving a PC member with a large unit and a long span is disadvantageous considering transportability. If the PC member is not transported according to the assembly order, due to problems such as communication between the site manager and factory worker, extra space is required for storage at the site. In addition, the inside and outside of the member can be damaged while stacking, moving, and unloading for transportation. To this end, in-situ production of 5–10-m-long columns and beams can solve these problems for large warehouse facilities. Additionally, in-plant production requires various equipment, facilities, and manpower for factory operation, but in situ production involves only small-scale resources, such as equipment, curing facilities, and manpower necessary for field production. In situ production refers to the production of PC members only on-site and proceeds in the same order as in factory production: installation of processed rebar, pouring concrete, and curing. As in situ production is added to the yard stock process in in-plant production process, the site operation plan must be established in consideration of this. In other words, yard stock management is critical for in-situ production.
While researching open storage yards at construction sites, Yun, Yu, and Kim (Citation2011) calculated the economic order quantity considering the extra size information of the storage yard using the theory of manufacturing. Lee et al. (Citation2008) collected data on material procurement by interviewing a manager and established a dynamic material information database to present the procurement process at the construction site. Lee, Yu, and Kim (Citation2007) calculated the economic order quantity for rebar under a fixed ordering system that considered the size of the storage yard. Kim, Kim, and Kang (Citation2004) compared and analyzed the models that determine the order quantity of various materials for construction work as well as investigated choosing the most suitable method for determining the appropriate order quantity and inventory cost. Thomas et al. (Citation2003) analyzed the relationship between material inventory and labor productivity performance by comparing them in the rebar assembly and installation process as well as proposed the appropriate material inventory level. The aforementioned studies investigated the procurement and storage of required materials using the theory of manufacturing industry for proper inventory management at construction sites.
However, these studies differ from production and yard stock management for in-situ production of PC members. The layout and operation strategy of the PC members significantly influence the storage system and are important for designing the open storage yard. However, the concept and storage process for yard stock management of in-situ PC production have not been defined accurately. Therefore, this study focuses on integrated management of production and yard stock centered on yard stock management while considering that PC members are produced and erected over time with the yard stock area varying accordingly.
While researching a simulation of in-situ PC production, Hong et al. (Citation2014) analyzed influencing factors through production management and arrangement as well as stated that approximately 14.5–21.6% of the cost was reduced compared to in-plant production. Lim (Citation2018) analyzed various risk factors for in-situ production and applied the developed risk management model to the case project. Lim et al. (Citation2020b) analyzed the factors that influence calculating the in-situ production quantity and applied the developed simulation model to six scenarios for deriving an appropriate quantity. Lim and Kim (Citation2020a) defined various influencing factors for in-situ production, derived an objective function, and developed an optimization model to minimize environmental load. However, there has been no study focused on simulating the influencing factors related to yard stock area. Lim et al. (Citation2020b) explained the detailed process of in-situ production through an experimental study and derived the degree of cost reduction ratio according to the quantity ratio.
2.2. Applied techniques
1) Game theory
Game theory is a theory of interdependent decision making. A game refers to an action performed by participants seeking to maximize utility to obtain the best reward with a certain strategy (Wikipedia Citation2021). Game theory helps the participants understand the changing situation as they interact and mathematically analyzes the development of interaction and the benefits of different actions (Lee Citation2009). In this study, the dynamic simulation for production and yard stock is approached as a type of game. Production and yard stock want to maximize profits in case of success or minimize losses in case of failure; moreover, field managers determine the best move. The game has its own rules, players, strategy, results, and rewards. Game theory is implemented to mathematically model these parts. Strategic interactions are crucial while modeling. The core of game theory is to understand the strategic interactions, such as “how the opponent will react when a player chooses a strategy” and “how a player will use that reaction.” Therefore, strategic interaction is analyzed through the game model (Kim Citation2008).
Game theory was proposed in the book “Theory of Games and Economic Behavior” by Neuman and Morgenstern (Citation1994), and the book mainly dealt with two-person zero-sum games. Subsequently, in 1951, John Nash proposed the concept of equilibrium as a solution in a non-zero-sum game and proved that there is an improvement (Shin, Citation2003), which is called Nash equilibrium. (Brandenburger and Nalebuff Citation1995). explained corporate management strategy using games. Notably, Prisoner’s Dilemma is a one-time game, but the Nash Equilibrium changes through iterations of a game. One Nash equilibrium case is the “Tit-for-tat strategy,” which determines the opponent’s characteristics first and selects the advantageous one (Kim Citation2008). In this study, the number of scenarios not considered by Lim and Kim (Citation2021) is calculated, and the process of reducing the number of scenarios through rational selection among them is shown. In addition, an optimal scenario is derived under the assumed conditions.
2) Dynamic simulation
For in-situ PC production and yard stock, the complexity of the relationship between influencing factors limits the ability to identify with static analysis that the independent variable unilaterally (Moon Citation2001) affects the dependent variable (Choi, Kim, and Kim Citation2015; Hyari, Shatarat, and Khalafallah Citation2017; Gransberg and Riemer Citation2009; Yeh Citation1998). For example, if PC members are produced in-situ in a limited space (Abdul-Rahman, Wang, and Eng Citation2011; Li and Love Citation2000; Osman, Georgy, and Ibrahim Citation2003; Ning, Lam, and Lam Citation2010) on a construction site, the influencing factors are mutually interfering, and production proceeds simultaneously with yard stock (Lim and Kim, Citation2020a). Additionally, all processes must be in accordance with the erection plan of PC members, and a production plan that can be supplied in the just-in-time method must be established, i.e., various influencing factors are affected by each other as time progresses.
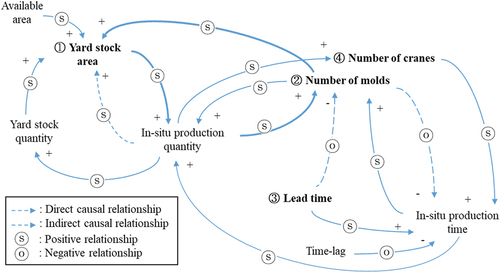
System dynamics is a methodology for understanding complex systems that explains the changes in a system over time, focusing on the causal and feedback relationships (Kim, Moon, and Kim Citation1999; Forrester Citation1987; Kim et al., Citation2007). Thus, this methodology can overcome the limitations of static analysis. In-situ PC production is mainly affected by eight factors: cost, time, quantity, lead time, number of molds, production cycle, number of cranes, and yard stock area (Lim Citation2018). Among them, lead time, number of molds, and number of cranes significantly influence the yard stock area. Lim and Kim (Citation2021) studied the estimation of the yard area using five influencing factors considering the effect on quantity because quantity affects the yard stock area. However, in this study, quantity is regarded as a fixed variable, and the yard stock area according to the time is calculated. In other words, this study is conducted using system dynamics centering on these four influencing factors, including the yard stock area. shows a causal loop diagram that schematically illustrates the influencing factors.
Figure 1. Causal loop diagram for production and yard stock simulation.
System dynamics can model an actual phenomenon through simulation and evaluate various strategies for improving the phenomenon, or it can conduct experiments to understand the phenomenon through the model (Shannon Citation1975). In other words, simulation involves building models, such as physical or mathematical models, that describe a system before that system is simulated. Additionally, simulations predict system behavior in advance by testing the system behavior under various environments or by designing a system that satisfies various purposes (time, cost, and risk analysis) (Kang and Kim Citation2006). Note that effectively operating a mathematical model is crucial in various situations. A mathematical model should implement a simulation as similar to reality as possible, such as generating random numbers, to overcome the fact that mathematical models have abstract assumptions separated from reality (Lee Citation2019).
2.3. Analysis of influencing factors for production and yard stock simulation
is a causal loop diagram that schematically describes the influencing factors using system dynamics. The details for each influencing factor are as follows.
① Yard stock area: As production time of PC members is significantly longer compared to erection time, the produced members are stacked on-site before erection (Lim et al., Citation2020b), The total area required for in-situ production is composed of the required production and yard stock areas. Alternatively, the required yard stock area is the value obtained after excluding the required production area from the required total area, as showcased in EquationEq. (1)(1)
(1) . Yard stock quantity is determined by the difference between cumulative production and cumulative erection quantities.
where RYs, ART, and ARP are the required yard stock, total, and production areas (m2), respectively. AA is the available area (m2).
② Number of molds: The number of molds increases as the in-situ production quantity increases, and it affects the production area. The material of the mold used in the example site is the same steel mold as used in the factory (Lim and Kim, Citation2020a). As the number of molds increases, the number of PC members produced at one time increases; therefore, yard stock area increases. Moreover, mold type varies according to the size of PC members.
③ Lead time: For in-situ production, an additional plan is required other than the overall construction plan. Lead time is the period of in-situ production in advance before PC members are erected, i.e., the period from the start of PC production to the start of PC erection. All PC members produced during the lead time must be stacked. Thus, the yard area directly affects lead time, but not numerically. Additionally, lead time must be secured because the PC member production period is longer than the erection period.
④ Number of cranes: PC members produced and transported are erected using lifting equipment. The crane must cover the working area because it is used to move the steel mold module as well as to lift and erect PC members. The large-scale building covered in this study has a large floor area and a low number of floors, making it difficult to use a tower crane; therefore, a mobile crane with excellent lifting capacity and maneuverability is used. In addition, unnecessary additional time does not occur if the crane has to establish an appropriate arrangement plan according to the production and yard stock areas. Consequently, the larger the yard stock area, the more efficient the required crane arrangement. Moreover, the yard stock area is affected from a management perspective, but not numerically. Lastly, the use of cranes should be minimized to save energy.
3. Production and yard stock simulation algorithm
The required production area is calculated after calculating the number of in-situ production molds for each zone and the module area for each member type, such as beams. In addition, the number of members and yard stock area based on one stacking yard are calculated, and the required yard stock area is calculated by multiplying the unit area and number of yard stock members for each process. The yard stock and production arrangement plans are simulated on a weekly or daily basis according to the reviewed area by calculating the production and yard stock areas available for each process. If the yard stock and production area requirements are not satisfied, the simulation is completed through a feedback routine. Lim and Kim (Citation2021) did not consider crane simulation. When considering the crane deployment scenario, the schematic of the aforementioned in-situ production and arrangement plan algorithm is shown in . The individual steps of the algorithm are described next.
Figure 2. Simulation algorithm for yard stock and production space.
1) Calculate the available area for production and yard stock
All areas except for the moving path of equipment, the area where the PC member is installed, and the workspace can be used as the available area in the site. Next, the area within the working radius of crane is calculated. As the available area changes depending on the installation space of the PC member, calculating the area according to the construction progress is necessary, as showcased in EquationEq. (2)(2)
(2) . In this study, the available area is calculated weekly according to the construction progress. However, the daily available area is calculated at actual sites to reflect the frequently changing site conditions.
shows that the construction is carried out considering 14 RC cores at the site. The construction is divided into two parts considering the lateral pressure because a heavily loaded long-span building is necessary to pour 10-m-high concrete walls. Additionally, concrete pouring should proceed alongside the PC columns and PC beams to be joined because the core construction is RC. Therefore, the core should be constructed simultaneously according to the installation plan of PC columns and PC beams.
Figure 3. Core location of the case project.
The production area can be calculated by adding up the area for each mold type, which is accomplished by multiplying the product of the number of molds by the unit production area for each mold type, as showcased in EquationEq. (2)(2)
(2) . The production area is not required after the production of all members is finished. In addition, the yard stock area is calculated by adding the product of the yard stock quantity and unit yard stock area for each mold type, as showcased in EquationEq. (3)
(3)
(3) . It should also be cross-checked with the production area.
where APROD is the production area, NMTi is the number of mold types, AUPMI is the unit production area of each mold type, and i is the number of mold types (1, …, n).
where AYs is the yard stock area, QYSi is the yard stock quantity of each mold type, AUYSi is the unit yard stock area of each mold type, and i is the number of mold types (1, …, n) again.
2) Calculate the number of molds
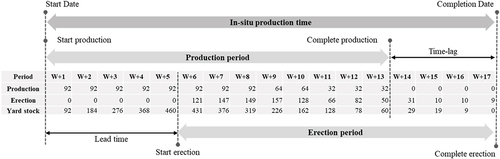
In-situ production time of PC members is the total period from starting production to completing installation. PC members are installed after being produced using molds. Hence, each period comprises a production and an erection period. Lead time is the period in which only production and no installation takes place (Na and Kim Citation2017). Moreover, time lag is the period after production, involving only installation. A production-erection-yard stock schedule is completed considering the in-situ production quantity. shows an example of a schedule for production-erection-yard stock of 460 PC members with a lead time of 5 weeks for a total of 17 weeks. If PC members are cumulatively produced for a certain period, and the number of installed members is excluded, the remainder is the number of stacking members for that period. For example, the PC members produced from W + 1 to W + 3 are 276 members for yard stock. Additionally, in W + 6, the number of yard stock members is 431, obtained by excluding the number of installed members (121) from the number of production members accumulated over 6 weeks (552). In other words, the lead time is the period from W + 1 to W + 5, and the time lag is the period of W + 10 [47]. The in-situ production quantity is determined considering the production and yard stock area. Finally, the number of molds is calculated using EquationEq. (4(4)
(4) ), which reflects the installation quantity and in-situ production period.
Figure 4. Example of production-erection-yard stock schedule.
where Nmold is the number of molds, QMOLDi is the in-situ production quantity of each mold type, TPC is the production cycle, TslTU is the in-situ production time, and i is the number of mold types (1, …, n).
3) Simulate the yard stock and production spaces
Yard stock and production spaces are simulated according to the production-erection-yard stock schedule and shop drawings. The yard stock rule of the n-th layer is required because the erection sequence is different from the production sequence. shows the rules for the cross section of the beam members that are established to manage the sequence of installation and production. The inventory rules establish a detailed plan using the queue and stack methods. The queue method involves stacking in the production order from left to right following the first in, first out principle; similarly, the stack method involves stacking in the installation order from top to bottom following first in, last out principle (Yoon Citation1997; Kim Citation2005). For a yard consisting of an n × m matrix with a stack-type row and queue-type column, the position of the stocking and production orders can be described with a determinant. The total number of members in one stacking yard can be obtained by multiplying the number of stacking layers with the number of columns. The yard stock rule of the stacking yard is showcased in EquationEq. (5)(5)
(5) .
Figure 5. Stacking rules for PC beams.
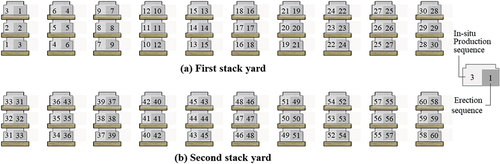
where pij and eij are the production and erection numbers, respectively, for the members of the i-th row and j-th column. i is the number of rows (1, …, n) and j is the number of columns (1, …, m).
4) Satisfy the space?
In this step, whether production and yard stock spaces are possible within the available space is verified. If the required area for production and yard stock is smaller than the available area, the area is satisfied. Additionally, the production-erection-yard stock schedule is verified. However, if the area is not satisfied, a plan to secure the area must be prepared.
5) Calculate the number of cranes and simulate
The crane capacity is calculated; accordingly, an appropriate crane is selected and simulated (Lim et al., Citation2020b). If the building size is not large, PC members can be produced at an assigned location within the working radius of the crane. However, for a large-scale building as in the case site of this study, PC members should be produced in a place where erection is easy. For a large-scale PC structure with a large floor area, a construction plan should be established in accordance with a safe working flow considering the productivity of the cranes. In the case site, the PC members are erected using a total of three mobile cranes. Therefore, establishing a production plan within the working radius of these cranes is necessary. After reviewing the shop drawings and erection schedule, the crane plan is established such that PC members can be produced within the crane working radius as shown in ). Moreover, if the PC member installation sequence is established considering the working radius of the boom length of the crane, an installation process can be established as shown in ). Because concrete pouring is required at the joint where the PC columns and PC beams are connected, the cascade erection method is implemented.
Figure 6. Crane plan and PC member installation sequence.
6) Satisfy the cranes location?
Whether the production-erection-yard stock schedule can be satisfied with the crane plan is verified. If it is not satisfied, the number of cranes is recalculated and re-simulated. Additionally, if the number of cranes is large, the construction period can be shortened. Note that calculating the appropriate number of cranes is crucial to avoid increasing construction costs. If the required yard stock area is smaller than the available area, the constraint is satisfied, and the production-erection-yard stock schedule is completed.
7) Apply at the site
The yard stock and production simulation is completed through iterations using the algorithm. If modifications are necessary due to changes in the in-situ conditions during construction work, they can be implemented in the respective methods of each stage.
4. Development of dynamic simulation model for production and yard stock
4.1. Scenario development
In the algorithm of , the construction manager can set the range of two influencing factors: the numbers of molds and cranes. In the scenarios, the number of mold cycle cases is important. EquationEquation (6)(6)
(6) calculates the number of scenarios in which all combinations are executed to apply the scenario-based simulation by exponentiating the number of mold cycle cases with the number of zones and multiplying by the number of cranes. In this case, the number of mold reuse cycles can be calculated by dividing the number of molds by the number of members.
where Ns,NMCC,Nz,Ncrane, and Nmold are the number of scenarios, mold cycle cases, zones, cranes, and molds, respectively. QSITU is the quantity of in-situ production.
4.2. Development of dynamic simulation model
The dynamic simulation model, developed using Powersim Studio 10 Expert, utilizes the causal loop diagram () for production and yard stock simulation and considers influencing factors, such as lead time, number of molds, and number of cranes. To conduct a simulation, various values are selected by random numbers following the probability distribution for each factor using the Monte Carlo simulation. This probabilistic method is used to overcome the mathematical limitations of the deterministic method (Eretec Citation2005; Maio et al. Citation2000).
In this study, it was assumed as shown in . It was assumed that there are no problems with cracks, breakages, size, and strength quality standards of PC members produced in the field. In this study, the production period was assumed to be satisfactory because it is used when calculating the quantity of in-situ production. It is assumed that PC members are in-situ produced with one mold type. It was assumed 1 day for column installation, 1 day for grouting, 1 day for installing PC beams and PC slabs, 1 day for pouring filler concrete, and 1 day for curing. Hence, one installation cycle was assumed to be 4 days. If the yard stock space on the first floor is insufficient, the second, third, and fourth floors can be used as the areas. Therefore, as the load of the building is designed to be 2ton/m2, it is assumed that PC members are stacked in one layer when stacking on the 2nd, 3rd, and 4th floors.
Table 1. Assumption of simulation model development.
Lim and Kim (Citation2021) did not show an integrated model because the study did not consider the overlap between the production model and the yard stock model. Therefore, shows the integrated dynamic simulation model for production and storage. The mold type derived according to the size and shape of the PC member is applied to the simulation model; the production simulation model created for one mold type is shown in . In ), the in-situ production period is calculated by inputting lead time, time lag, installation start date, and installation completion date into the model. Because this model is a weekly simulation model, the production cycle and number of working days are inputted per week. Subsequently, the number of parts produced per week is calculated, and the number of productions is applied to the calculation of the number of molds with the total quantity and in-situ production period (b). The production quantity per week can be calculated using the number of parts produced per week and the number of molds; moreover, the cumulative production can be calculated using the production quantity per week (c). Finally, the production area for mold type 1 (designated as “MT1_”) can be calculated (d) using the calculated number of molds and unit production area. In addition, the production area for each zone can be calculated as the sum of the production areas of each mold type, and the total production area for the project can be calculated using the sum of production areas of these zones.
Figure 7. Production and yard stock simulation model (a mold type for in-situ production).
also shows the yard stock area estimation simulation model for Zone A (designated by “A_”). In this study, when in-situ production is applied to the actual field, a model for calculating the yard stock area is developed considering the working area of other constructions affecting the construction. The weekly yard stock quantity using the weekly erection and accumulated production quantities is calculated as shown in ); additionally, the total installation area of Zone A is derived using the number of layers and unit installation area (e). Subsequently, the area for the steel framework that is carried out individually is calculated (f). The total work area for other works is calculated by adding up the work area related to the in-situ production of PC members and separate work area. The production and storage areas of Zone A are calculated as the sum of the production areas for each mold type member. Finally, if the sum of the total required storage area is less than the usable area, it is recalculated (g).
5. Application of scenario-based 4D dynamic simulation model
5.1. Production management model
The mold type designed according to the size of PC beams was applied as the simulation model, and the production simulation model created for one of the mold types is shown in . In , the in-situ production schedule is calculated based on lead time, time lag, erection start date, and erection completion date. It is a weekly simulation model and thus requires information pertaining to the production cycle and the number of working days per week. When the number of production cycles per a week is calculated, the number of productions is used to the calculation of the number of molds together with the total quantity and in-situ production time (B). Lim and Kim (Citation2020a) calculated the quantity according to the limited yard stock area. However, a model was developed to weekly calculate the number of PC members according to the erection plan based on the in-situ production quantity among the overall quantity (C). Production quantity per week can be calculated using the number of production counts per week and the number of molds, and the accumulated production members were calculated using production quantity per a week (D). The production area for mold type 1 can be calculated using the calculated number of molds and unit production area (E). The production area of each zone can be obtained from the sum of production areas of each mold type, and the total production area for the project can be obtained from the summation of all the zones.
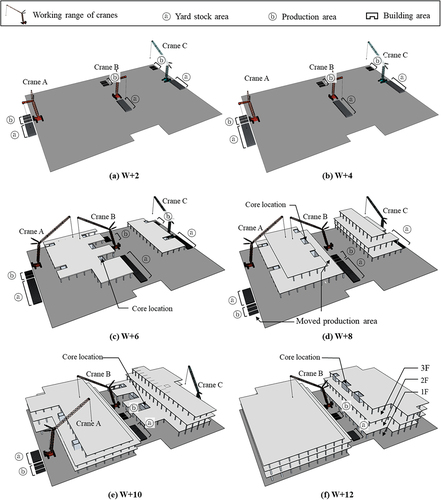
Figure 8. Weekly site plan of Scenario 1 using 4D simulation.
5.2. Scenario-based 4D dynamic simulation
According to Lim et al. (Citation2020b), as well as Lim and Kim (Citation2021), the number of mold reuse cycles is profitable if one mold produces 39 PC members or more. If the mold is not sufficient, lead time is significantly long. In this study, the number of mold cycle cases is considered 39 to 50 EA, a total of 11 cases are considered, and each case is considered in three zones. Therefore, the number of cases in which all combinations are executed to apply the scenario-based simulation is 3933, using EquationEquation (6)(6)
(6) . However, the number of cranes is a fixed variable because three cranes are required for the production and yard stock of PC members. Because two cranes cannot be used considering time and four cranes cannot be used considering cost, the number of scenarios applied in this study is derived as 1331.
In this study, scenarios are set with four mold cycle cases as a constraint. Various numbers of mold cycles are applied, 50, 47, 43, and 39, to confirm the change according to the cost reduction ratio. The available area must be secured by deriving the highest value among the yard stock areas because the yard stock area varies by period. The yard stock area for the quantity of each scenario is calculated by operating the simulation model developed in this study. lists the results of each scenario for comparison. Considering the results, the maximum yard stock area for Scenarios (1), (2), (3), and (4) are 6102, 6623, 6893, and 7312 m2, respectively. In the mold cycle cases, Scenario (1) has the smallest maximum yard stock area and the shortest lead time. In other words, the maximum yard stock area and lead time verifiably increase as the mold reuse rate increases. The cost reduction ratio of Scenario (1) is 21.38%, and the reduced cost is the largest at 739 000 USD. Therefore, in-situ production can reduce costs by 18.12% or more compared to in-plant production.
shows weekly number of PC members of scenario 1 for production, erection, and yard stock. The unit production, erection, and yard stock area are 35.01㎡, 302.50㎡, and 12.58㎡, respectively. shows the calculation of the available area at the site, and the production, erection, and yard stock area applying each unit area. In the weekly number of PC members of Scenario (1), the maximum number of members in the yard stock was derived to 460 from W + 5 as shown in . . lists the weekly area of Scenario (1). Note that the maximum yard stock area of 6102 m2 is derived from W + 5. The yard stock area is the highest during this period because the PC members produced during the lead time accumulate and the number of yard stock members begins decreasing as the PC member installation starts. In , the period from W + 1 to W + 5 (5 weeks) is a period of only producing PC members (lead time). During this period, only in-situ production and yard stock occur, and no PC members are installed. In , the period from W + 13 to W + 17 represents a time lag of 5 weeks. When construction starts, the yard stock area gradually increases, and the largest yard stock area is recorded before the start of installation (W + 6). Additionally, when the installation starts, the yard stock area is reduced. Finally, when the yard stock area is zero, the PC construction is finished.
Table 2. Quantity scenarios and comparison of results for simulation.
Table 3. Weekly number of PC members of scenario 1 (unit: ea).
Table 4. Weekly area of scenario 1 (unit: 1000 m2).
shows the 4D simulation after the PC member installation starts in Scenario 1. During the lead-time from W + 1 to W + 5, PC member installation is not conducted. In W + 6, the production areas of Zones A, B, and C are 245, 280, and 280 m2, respectively. Moreover, the yard stock areas are 1794, 2118, and 2190 m2, respectively. In this period, a total of 460-yard stock members are derived. As the construction of each floor progresses, the in-situ production and yard stock areas in Zones A, B, and C are verified, and the crane is moved according to the erection schedule of PC members. PC members should be installed using cascade erection method as shown in ). Lim and Kim (Citation2021) did not consider this partly because the study checked on a plane view whether the production and yard stock of PC members was possible. However, this study was shown spatially through 4D simulation.
As the core and PC structure must be constructed simultaneously, the PC members are installed excluding the core (Lim and Kim Citation2021). PC members should not be installed in the passage so that necessary materials and equipment can be supplied because the core is an RC structure. Moreover, when the core construction is completed, the first floor PC member is installed in front of the core structure. In other words, core construction is a critical path. Furthermore, the production-erection-yard stock process from W + 6 to W + 12 confirms that the production and yard stock areas occupy a small area compared to the large site of long-span and heavy-loaded buildings.
As the erection area increases, producing PC members in the same place becomes more difficult. Hence, moving the production area is necessary. shows that the production area changes for W + 6 and W + 8. However, because only one mold type is selected and applied in this study, the production and yard stock spaces are sufficient; therefore, production and yard stock spaces are moved only once. However, if securing production and yard stock areas is difficult due to the production of a larger number of PC members, moving several times can be necessary. In addition, if the floor area on the first floor is insufficient, the floors on the second, third, and fourth floors can be used as yard stock area.
6. Discussion
Several studies have verified that in-situ production quality and economic feasibility can be secured (Hong et al. Citation2014; Lim Citation2016; Eomjoong Oh Citation2017; Lee et al. Citation2011b). Lim et al. (Citation2020b) stated that some members produced in-plant are reproduced due to cracks, size breakage problems, and rebar arrangement different from the shop drawings. This study assumes that there are no problems with cracks, breakages, size, and strength quality standards according to the PC production and installation guidelines of the Korea Concrete Research Institute when in-situ production is applied in the actual field. In addition, an interview with a PC factory official confirmed that the actual factory owner does not agree on a contract if more than 20% of the production cost is not earned because the factory management overhead cannot be covered (Lim Citation2018).
In general, the application of in-situ production is determined by calculating time and cost; moreover, the production capability is calculated by calculating the yard area. In this study, the production period is assumed satisfactory because it is used for calculating the quantity of in-situ production. Additionally, the floor on the first floor is maximally utilized for in-situ production and yard stock area. If production is difficult on-site due to issues such as time, cost, or change orders, PC members can be procured from the factory.
The in-situ production is simulated only for PC beams. Note that in-situ production targets thin parts, such as columns and beams. PC slabs, such as rib-plus and double T slabs, occupy a large space during production. Hence, in-plant production is more advantageous than in-situ production in the case of slabs. This study assumes that PC members are produced on-site with one mold type by selecting similar member sizes and rebar details to increase the number of mold reuses. During in-situ production, not only one mold type is produced but also members of various sizes for beams and columns are produced. Therefore, different results can be obtained according to conditions.
The construction environment of a project is affected by various factors. When in-situ production of PC member is applied to a site, the cost is affected by environmental factors. In June 2022, material costs rose worldwide due to inflation, economic revitalization due to the Covid-19 recovery, and increased material supply due to increased construction sites. In particular, in South Korea, the price of rebar (High-tensile Deformed-bar 16) has increased by up to two times. In addition, PC factories set the price of PC members, and they demand higher production costs due to the increased material cost. If in-situ production is applied, PC members of more stable cost can be provided to the site. However, as PC member in-situ production need a lot of manpower on site, it is necessary to decide whether to apply it in consideration of the labor cost.
7. Conclusion
In this study, scenarios are developed by analyzing the major influencing factors of yard stock area: number of molds, lead time, and number of cranes. Additionally, a novel scenario-based 4D dynamic simulation model is developed. The conclusions of this study are as follows.
First, production and yard stock simulations can be quickly and easily performed according to quantity using the dynamic simulation algorithm. The developed model can numerically control the influencing factors of in-situ production. This model can simulate the factors affecting the yard stock area, which are frequently changing during project execution, to derive appropriate values according to the situation.
Second, the production and yard stock areas occupy a small area compared to the large site of long-span and heavy-loaded buildings, as verified through the production-erection-yard stock process. Additionally, 960 beams can be sufficiently produced as verified using 4D simulation, i.e., if applied in other fields, the area can be secured over time through 4D dynamic simulation. And it is confirmed that the production and yard stock areas occupy a small area compared to the large site of long-span and heavy-loaded buildings through 4D simulation.
Third, the maximum yard stock area and lead time increase as the mold reuse rate increases as verified through the scenario-based simulation. The maximum and minimum cost reduction ratios obtained are 21.38% (739,000 USD) and 18.12%, respectively.
Using the developed model, sustainable in-situ production construction plans can be established and reviewed at the initial stage of a project. Moreover, the numbers of mold cycles and cranes are used while developing the scenario, but the scenario can be developed using other influencing factors depending on the particular conditions at other sites. In the future, if there is a change in the relationship between the influencing factors due to the frequently changing conditions at the construction site, the factors can be redefined. If securing production and yard stock area is difficult due to the production of a large amount of PC members, additional research on yard stock management, such as stacking yard management, stacking yard sequence and arrangement, and model development through risk analysis using building information modelling, is necessary.
Disclosure statement
No potential conflict of interest was reported by the author(s).
Additional information
Funding
Notes on contributors
Jeeyoung Lim
Dr. Jeeyoung Lim is a researcher at the Department of Architectural Engineering, Kyung Hee University, in South Korea. She was a lecturer and a researcher at California State University Long Beach in the United State. She was also a researcher at the Department of Architectural Engineering, Pusan National University, in South Korea. She studied Construction Engineering and Management at the Department of Architectural Engineering, Kyung Hee University, in South Korea. She has joined three Korean construction firms, Iksungtech Co., Ltd, Kunwon Architects & Engineers Corp., and U-Top Engineering Architects, for five years. She has concentrated on research such as the development of sustainable construction technology and management, production technology of free-form concrete panels, cost management of precast concrete, simulation, optimization, and risk management.
Chang-Baek Son
Dr.Chang-Baek Sohn majored in Construction Management at Chung-Ang University. After working for Korea National Housing Corporation for about 5 years, he has been working at Semyung University since 1998. He has been conducting research focusing on the field of construction production, and is currently conducting research with interest in the field of construction skilled manpower.
Sunkuk Kim
Dr.Sunkuk Kim studied Construction Engineering and Management at the department of architectural engineering, Seoul National University. He has been working at Kyung Hee University as a professor since 1995 after working at the construction company for 12years. He has concentrated on the research such as health performance evaluation of buildings, development of sustainable construction technology and management, simulation, optimization and risk management, construction information technology. Especially, for about a decade, he has participated in the development of SMART frame, a sustainable structural system, and production technology of free-form concrete panels.
References
- Abdul-Rahman, H., C. Wang, and K. S. Eng. 2011. “Repertory Grid Technique in the Development of Tacit-Based Decision Support System (TDSS) for Sustainable Site Layout Planning.” Automation in Construction 20 (7): 818–829. doi:10.1016/j.autcon.2011.02.004.
- Brandenburger, A. M., and B. J. Nalebuff. 1995. The Right Game: Use Game Theory to Shape Strategy, 57–71. Vol. 76. Chicago: Harvard Business Review.
- Choi, J., H. Kim, and I. Kim. 2015. “Open BIM-based Quantity Take-off System for Schematic Estimation of Building Frame in Early Design Stage.” Journal of Computational Design and Engineering 2 (1): 16–25. doi:10.1016/j.jcde.2014.11.002.
- Ecoinvent. “Ecoinvent Database.” Accessed 1 August 2019. http://www.ecoinvent.org/
- Eretec. 2005. “Crystal Ball Training Manual. Eretec.”
- Forrester, J. W. 1987. “Lessons from System Dynamics Modeling.” System Dynamics Review 3 (2): 136–149. doi:10.1002/sdr.4260030205.
- Gransberg, D. D., and C. Riemer. 2009. “Impact of Inaccurate Engineer’s Estimated Quantities on Unit Price Contracts.” Journal of Construction Engineering and Management 135 (11): 1138–1145. doi:10.1061/(ASCE)CO.1943-7862.0000084.
- Hong, W. K., S. K. Kim, and S. I. Kim. 2010. “Load Carrying Capacity of Structural Composite Hybrid System (Green Frame).” The International Journal of the Korea Institute of Ecological Architecture and Environment 10 (1): 25–31.
- Hong, W. K., G. Lee, S. Lee, and S. Kim. 2014. “Algorithms for In-situ Production Layout of Composite Precast Concrete Members.” Automation in Construction 41: 50–59. doi:10.1016/j.autcon.2014.02.005.
- Hyari, K. H., N. Shatarat, and A. Khalafallah. 2017. “Handling Risks of Quantity Variations in Unit-price Contracts.” Journal of Construction Engineering and Management 143 (10): 04017079. doi:10.1061/(ASCE)CO.1943-7862.0001393.
- Intergovernmental Panel on Climate Change (IPCC). 2013. “Working Group I Contribution to the IPCC Fifth Assessment Report Climate Change 2013.” Cambridge University Press: Cambridge, UK.
- Kang, S. M., and O. J. Kim. 2006. “Domestic and Foreign Present Situation Analysis of a PC Method.” Daelim Technology Research Institute, Architecture (Spring) 28–37.
- Kim, K. Y. 2005. Inventory Management for Logistics Bases. South Korea, Seoul: Hyomin.
- Kim, I. K. 2008. “Management Strategy Solved by Game Theory.” Korea Enterprises Federation, Management Part 353: 32–35.
- Kim, S. H., G. H. Kim, and K. I. Kang. 2004. “A Study on the Effective Inventory Management by Optimizing Lot Size in Building Construction.” Journal of the Korea Institute of Building Construction 4 (2): 73–80. doi:10.5345/JKIC.2004.4.3.049.
- Kim, D., T. Moon, and D. Kim. 1999. System Dynamics, Daeyoung Book, 13–59. South Korea, Seoul.
- Kim, K. M., H. B. Seo, H. J. Hwang, and K. J. Kim. 2007. “Application of Discrete Event Simulation on Tunnel Muck Hauling Operations.” Korea Journal of Construction Engineering and Management 8 (1): 141–149.
- Lee, M. S. 1994. “A Study on the Composition and Flexible Planning of the Component Housing.” Journal of the Architectural Institute of Korea 10 (5): 3–11.
- Lee, S. Y. 2009. “Making a President”. Game Theory and the Prisoner’s Dilemma.” Book Publishing High Bird 7–17.
- Lee, G. J. 2012. “A Study of In-situ Production Management Model of Composite Precast Concrete Members.” PhD diss., Kyung Hee University.
- Lee, H. R., 2019, A Study on the Case Simulation-based Bidding Game Model on Tunk-Key Project. PhD diss., Chung Ang University
- Lee, G. J., J. K. Joo, S. H. Lee, and S. K. Kim. 2011b. “A Basic Study on the Arrangement of In-situ Production Module of the Composite PC Members.” In Proceeding of the 2011 Autumn Annual Conference of the Korea Institute of Building Construction, 11(2), 29–30. Seoul, Korea.
- Lee, G. J., S. H. Lee, J. K. Joo, and S. K. Kim. 2011a. “A Basic Study of In-Situ Production Process of PC Members.” In Proceeding of the 2011 Autumn Annual Conference of the Architectural Institute of Korea, 31(2), 263–264. Seoul, Korea.
- Lee, J. M., J. H. Yu, and C. D. Kim. 2007. “An Economic Order Quantity (EOQ) Determination Method considering Stock Yard Size.” In Proceeding of the 2007 Autumn Annual Conference of the Korea Institute of Construction Engineering and Management, 549–552. Seoul, Korea.
- Lee, J. M., J. H. Yu, C. D. Kim, K. J. Lee, and B. S. Lim. 2008. “Order Point Determination Method considering Materials Demand Variation of Construction Site.” Journal of the Architectural Institute of Korea 24 (10): 117–125.
- Li, H., and P. E. Love. 2000. “Genetic Search for Solving Construction Site-Level Unequal-Area Facility Layout Problems.” Automation in Construction 9 (2): 217–226. doi:10.1016/S0926-5805(99)00006-0.
- Lim, C. 2016. “Construction Planning Model for In-situ Production and Installation of Composite Precast Concrete Frame.” PhD diss., Kyung Hee University.
- Lim, J. 2018. “A Risk Management Model for In-situ Production of Precast Concrete Members Focused on Time and Cost Using System Dynamics.” PhD diss., Kyung Hee University.
- Lim, C., J. K. Joo, G. J. Lee, and S. K. Kim. 2011a. “Basic Analysis for Form System of In-situ Production of Precast Concrete Members.” In Proceeding of the 2011 Autumn Annual Conference of Construction Engineering and Management, 12(1), 137–138. Seoul, Korea.
- Lim, C. Y., J. K. Joo, G. J. Lee, and S. K. Kim. 2011b. “In-Situ Production Analysis of Composite Precast Concrete Members of Green Frame.” Journal of the Korea Institute of Building Construction 11 (5): 501–514. doi:10.5345/JKIBC.2011.11.5.501.
- Lim, J., and J. J. Kim. 2020a. “Dynamic Optimization Model for Estimating In-Situ Production Quantity of PC Members to Minimize Environmental Loads.” Sustainability 12 (19): 8202. doi:10.3390/su12198202.
- Lim, J., and S. Kim. 2020a. “Evaluation of CO2 Emission Reduction Effect Using in-situ Production of Precast Concrete Components.” Journal of Asian Architecture and Building Engineering 19 (2): 176–186. doi:10.1080/13467581.2020.1726763.
- Lim, J., and D. Y. Kim. 2021. “Integrated Management Model of Production and Yard Stock for in-situ Precast Concrete Production.” Journal of Asian Architecture and Building Engineering 1–17. doi:10.1080/13467581.2021.2007111.
- Lim, J., S. Kim, and J. J. Kim. 2020b. “Dynamic Simulation Model for Estimating In-situ Production Quantity of PC Members.” International Journal of Civil Engineering 18 (8): 935–950. doi:10.1007/s40999-020-00509-4.
- Lim, J., K. Park, S. Son, and S. Kim. 2020b. “Cost Reduction Effects of In-situ PC Production for Heavily Loaded Long-span Buildings.” Journal of Asian Architecture and Building Engineering 19 (3): 242–253. doi:10.1080/13467581.2020.1740095.
- Maio, C., C. Schexnayder, K. Knitson, and S. Weber. 2000. “Probability Distribution Function for Construction Simulation.” Journal of Construction Engineering and Management 126 (4): 285–292. doi:10.1061/(ASCE)0733-9364(2000)126:4(285).
- Moon, K. J. 2001. “A Study on the Sustainability of an Urban System: By the Application of a System Dynamics Model.” PhD diss., Pusan National University.
- Na, Y., B. Han, and S. Son. 2021. “Analysis of CO2 Emission Reduction Effect of On-Site Production Precast Concrete Member according to Factory Production Environment.” Advances in Civil Engineering 2021: 1–8. doi:10.1155/2021/4569651.
- Na, Y. J., and S. K. Kim. 2017. “A Process for the Efficient In-situ Production of Precast Concrete Members.” Journal of the Regional Association of Architectural Institute of Korea 19: 153–161.
- Neuman and Morgenstern. 1994. ‘Theory of Games and Economic Behavior.’ The United State, New Jersey: Princeton University Press.
- Ning, X., K. C. Lam, and M. C. K. Lam. 2010. “Dynamic Construction Site Layout Planning Using Max-Min Ant System.” Automation in Construction 19 (1): 55–65. doi:10.1016/j.autcon.2009.09.002.
- Oh, O. J. 2017. “A Model for Production and Erection Integration Management of Large Scale PC Structures Using System Dynamics.” PhD diss., Kyung Hee University.
- Osman, H. M., M. E. Georgy, and M. E. Ibrahim. 2003. “A Hybrid CAD-Based Construction Site Layout Planning System Using Genetic Algorithms.” Automation in Construction 12 (6): 749–764. doi:10.1016/S0926-5805(03)00058-X.
- Park, J. H., S. J. Kim, M. S. Paik, S. H. Lee, B. K. Park, and S. J. Jung. 2007. “An Experimental Study on Strength Characteristics of Mass Concrete Cast with High-strength Concrete for Precast Application.” In Proceeding of the 2007 Autumn Annual Conference of the Korea Concrete Institute, 585–588. Seoul, Korea.
- Park, H., S. Park, K. Hong, and S. Kim. 2011. “Development of Residential PC Prefabricated Building Structure System.” Construction Engineering and Management 12 (1): 11–16.
- Shannon, R. E. 1975. Systems Simulation the Art and Science. Englewood Cliffs, N.J: Prentice -Hall.
- Shin, S. 2003. “Guide to Game Theory”. South Korea, Seoul: Pakyoung Book.
- Song, K. J., U. K. Lee, S. H. An, and K. I. Kang 2005. “PC Production Schedule Optimization Model Using a Genetic Algorithms and Random Keys” In Proceeding of the 2005 Autumn Annual Conference of the Architectural Institute of Korea, 25(1), 487–490. Seoul, Korea.
- Son, C., J. Son, C. Kim, J. Kim, B. Anh, S. Hwang, K. Kwak, S. Kim, and T. Je. 1997. Development of Production-Translation-installation Integrated System for the Large Panel P.C. Construction. South Korea, Seoul: Korea Land and Housing Corporation.
- Thomas, H., M. Horman, R. Minchin Jr., and D. Chen. 2003. “Improving Labor Flow Reliability for Better Productivity as Lean Construction Principle.” Journal of Construction Engineering and Management 129 (3): 251–261. doi:10.1061/(ASCE)0733-9364(2003)129:3(251).
- Wikipedia. 2021. “Game Theory.” Accessed December 20 2021. https://en.wikipedia.org/wiki/Game_theory
- Won, I., Y. Na, J. T. Kim, and S. Kim. 2013. “Energy-Efficient Algorithms of the Steam Curing for the in-situ Production of Precast Concrete Members.” Energy and Buildings 64: 275–284. doi:10.1016/j.enbuild.2013.05.019.
- Yeh, I. C. 1998. “Quantity Estimating of Building with Logarithm-neuron Networks.” Journal of Construction Engineering and Management 124 (5): 374–380. doi:10.1061/(ASCE)0733-9364(1998)124:5(374).
- Yoon, S. 1997. Inventory Management Methods and Applications, 25–29. South Korea, Seoul: Sigongsa.
- Yoon, D., W. Hong, and T. Yoon. 2010. “Half Slab Construction for Eco-friendly Composite Frame System.” In Proceeding of the 2010 Autumn Annual Conference of the Korea Institute of Building Construction, 10(2), 15–18. Seoul, Korea.
- You, Y. C., K. D. Choi, K. H. Kim, and L. H. Lee. 2001. “Mechanical Bar Anchorage of the PC in Beam-column Joint.” Journal of the Architectural Institute of Korea 17 (5): 35–42.
- Yun, J. S., J. H. Yu, and C. D. Kim. 2011. “Economic Order Quantity(EOQ) Determination Process for Construction Material considering Demand Variation and Stockyard Availability.” Korea Journal of Construction Engineering and Management 4 (2): 73–80. doi:10.6106/KJCEM.2011.12.1.33.