
ABSTRACT
When large numbers of people are using railroad stations, such as during commuting hours, pedestrians must navigate others moving in various directions and standing stationary while waiting, particularly in front of the ticket gates. These heavy pedestrian traffic flows may cause congestion or crowd accidents. As a result, the national government and railroad companies in Japan are evaluating various countermeasures against railroad station congestion. In this study, we accordingly conducted a field survey to observe the flowing and stationary people in front of the ticket gates at a railroad station. Based on the data gathered by this survey, we constructed an agent-based model to simulate the movement of flowing people through the train station concourse according to the time of day, number of stationary people present, and ticket gate directional restrictions. The simulation results confirmed that the congestion in front of the ticket gates, indicated by the time required to pass through the concourse, was affected by the number and direction of flowing people, number and location of stationary people, and ticket gate directional restrictions. The implementation of an intentional pedestrian flow pattern effectively shortened the walking time of the flowing people in the concourse, thus easing congestion.
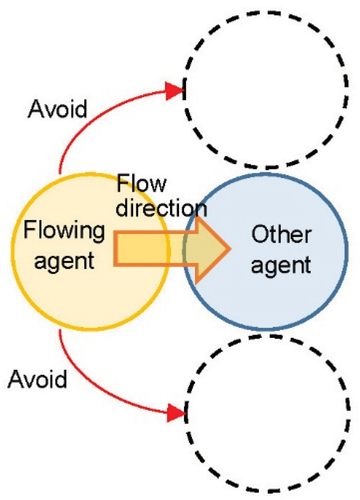
GRAPHICAL ABSTRACT
1. Introduction
In Japan, populations and businesses are heavily concentrated in urban areas; thus, railroad stations become crowded in the morning, evening, and during large-scale events. As more people gather and congestion develops, the possibility of problems among users and crowd accidents increases. According to a survey of urban railways (Ministry of Land, Infrastructure, Transport and Tourism Citation2020), the average congestion rates for the major sections of all three major metropolitan areas in Japan are greater than 100%: 163% in the Tokyo area, 126% in the Osaka area, and 132% in the Nagoya area. A 100% congestion rate indicates the ability of a passenger to sit in a seat, hold on to a strap, or hold on to a handrail near the door, while a 200% congestion rate indicates the ability of a passenger to read a weekly magazine, although there will be sense of pressure as the passengers come into contact with each other. In addition, the “Urban Planning Status Survey” (Ministry of Land, Infrastructure, Transport and Tourism Citation2019) states that the number of railroad passengers has continued to increase throughout Japan since 2007. The “Basic Plan on Transportation Policy” (Ministry of Land, Infrastructure, Transport and Tourism Citation2013) therefore outlines measures to increase the transportation capacity of railroads, off-peak commuting measures, and efforts to “visualize” congestion rates by time of day. The government is also taking measures to alleviate congestion in stations, including extending and expanding platforms and widening concourses to disperse the flow of passengers (Tokyo Metro Co., Ltd Citation2019). Thus, the government and railroad companies in Japan are implementing various measures to address regular and event-based station congestion.
An understanding of pedestrian flows is essential to address the issue of congestion; a review of pedestrian flow research has accordingly been recently published by Feng et al. (Citation2021). Among previous studies, research exploring various behavioral aspects of pedestrians in crowds with densities between 0.4 and 0.8 persons per square meter has found that individuals tend to walk faster than groups (Do, Haghani and Sarvi Citation2016). Passenger behavior during an emergency is a particularly critical area of pedestrian flow studies in transportation. Studies have found that train passengers are more likely to exhibit co-operative behavior than competitive behavior during an emergency (Shiwakoti et al. Citation2017), and that while the proximity of an exit to a passenger’s destination is typically the dominant factor determining the choice of egress, during an emergency, passengers place a much higher priority on avoiding crowded exits (Haghani and Sarvi Citation2016). Furthermore, Zhu et al. (Citation2020) suggested that improving architectural visual access could improve facility users’ evacuation performance during emergencies. Indeed, the completeness of a passenger’s spatial knowledge has been observed to significantly impact all measures of their evacuation performance, and the pattern of crowd flow has been found to significantly impact evacuation speed, route choice, and directional choices (Lin, Cao, and Nan Citation2020). As the highest pedestrian densities in railroad station concourses have been measured during peak hours (Sukor et al. Citation2019), careful attention has been paid to address railroad station layout design issues to ensure safety under such conditions. An assessment of station designs was accordingly conducted by Hoogendoorn, Hauser, and Rodrigues (Citation2004) using a pedestrian flow simulation model.
Agent-based modeling and simulation have increasingly been adopted to simulate pedestrian flows because they operate at the individual level (Elmar et al. Citation2016). Current agent-based modeling practices were summarized by Heath, Hill, and Ciarallo (Citation2009) according to year of publication. Previous agent-based modeling studies have employed various approaches such as a cellular automata microsimulation for modeling bi-directional pedestrian walkways (Blue and Adler Citation2001). Other studies have found that obstacles can stabilize pedestrian flow patterns and make them more fluid (Helbing et al. Citation2005). Small-grid analyses have reproduced several typical pedestrian flow phenomena – including jams, blocks, and faster-is-slower – as accurately as the continuum (social force) model but with superior simulation efficiency (Weng et al. Citation2007). Recently, various practical agent-based models have been applied to describe different social and economic determinants of public health in fields such as infectious disease modeling, obesity, and tobacco control (Kim Citation2021). Indeed, the agent-based model has been widely used in computer science, biology, and social science to simulate dynamic social and evacuation behaviors. Furthermore, the study of agent-based modeling is expected to help reproduce and predict user behavior in buildings and urban spaces, which can be useful for spatial planning.
In the agent-based modeling of building usage, applicable egress models have been employed to elucidate basic egress behaviors in schools (Zhang, Song, and Xuan Citation2008; Rostami and Alaghmandan Citation2021) and determine that a small room door size increases evacuation efficiency in small buildings, whereas the evacuation time in large buildings is controlled by the size of the primary exit (Ha and Lykotrafitis Citation2012). Research has also been conducted to develop agent-based models for various specific real-world applications, including simulations of concert venue crowd evacuation (Wagner and Agrawal Citation2014), airport facility usage behavior (Fonseca I Casas, Casanovas, and Ferran Citation2014; Liu et al. Citation2019), human decision-making in the dynamic environments of healthcare operations (Kaushal et al. Citation2015; Lee, Lee, and McCuskey Shepley Citation2020).
The use of agent-based model simulations in the real space of railroad stations has been shown to be feasible when the agents are provided with capabilities beyond simple locomotion (Rindsfüser and Klügl Citation2007). Indeed, Zhang, Han, and Dewei (Citation2008) observed that the behavior arising from a simulation of railroad station passengers reflected the fundamental traits of alighting and boarding movement, and Zheng et al. (Citation2015) reported the feasibility of using agent-based simulation models to evaluate exit selection. Furthermore, Hänseler, Bierlaire, and Scarinci (Citation2016) proposed an effective agent-based model for assessing the usage and level-of-service of rail access facilities. The results of agent-based simulations have indicated that the use of vertical handrails in train cars can have a significant impact on the passenger service time in metro stations (Seriani and Fernandez Citation2015). Furthermore, standing pedestrians have been found to exert a strong effect on crowd dynamics and were identified as a necessary element of realistic pedestrian simulations, especially when modeling critical infrastructures such as railway stations (Davidich et al. Citation2013). Yang, Jin, and Zhao (Citation2014) accordingly suggested that the ticket window utilization rate should change according to the pedestrian arrival rates so that the instance of standing pedestrians is minimized.
Agent-based modeling has also been used to effectively simulate pedestrian behaviors in subway stations (Chen et al. Citation2017). Emily, Hamdar, and Daamen (Citation2018) observed that an integrated modeling framework reproduced similar pedestrian trajectory patterns to those observed in their experiments. Such crowd simulations can produce measurable improvements in station design (Tang and Yingdong Citation2017); Asmer et al. (Citation2019) employed one to investigate the possibility of sustained passenger processing at a railway station with regional and long-distance connections using multiple security checkpoints. Liu and Chen (Citation2019) applied a simulation to determine the key impact factors on the overall duration of time between the alighting of the first passenger when a train arrives to the departure of the last passenger through an exit of the station. Simulations have also been applied to assess the service level performance and crowdedness ratio in a metro transfer station (Hassannayebi et al. Citation2020).
Many studies have investigated emergencies in railroad and subway stations using simulations to provide a quantitative analytical basis for developing evacuation strategies and response plans (Hong, Gao, and Zhu Citation2018). The major advantage of computer simulations of evacuation processes is the ability to assess a wide variety of conditions and parameters such as the worst-case scenario, critical occupants’ average speed, and influence of exit choice on evacuation time (Kallianiotis et al. Citation2018). Lei et al. (Citation2012) found a linear relationship between occupant density and evacuation time. Liang et al. (Citation2017) proposed an agent-based evacuation model for a railway station square under a sarin terrorist attack that could serve to support decision making. Similarly, the agent-based approach was shown to be capable of identifying a more efficient evacuation route for a crowded metro station (Limao et al. Citation2016). Finally, the detrimental effect of small group behavior on evacuation time was quantitatively analyzed by Pan, Wei, and Wang (Citation2021) considering the proportion of small groups, gathering status, and evacuation walkway width via agent-based modeling.
Research on pedestrian flow and railroad station space development in Japan has revealed several findings. A video survey of commuters was conducted to elucidate their density, speed, and flow crossing angles, leading to the development of a simulation model (Naka Citation1977). To prevent accidents due to congestion, Ishibashi, Suzuki, and Shibutani (Citation2008) suggested that obstacles should not be placed along the shortest distance between an origin and destination and observed that the flow will be smoother if obstacles are placed parallel rather than perpendicular to the direction of pedestrian flow. Indeed, both the facility-wide and individual pedestrian perspectives should be considered in the development of pedestrian spaces in railroad stations(Yamashita, Sekiguchi, and Uchiyama Citation2006). This requires an understanding of pedestrian desires and behaviors. In the open space in front of a railroad station, those who spent time resting were found to place importance on benches, whereas those who spent time meeting others placed importance on the clarity of landmarks (Fushimi and Asano Citation2005). When multiple benches were arranged in the open space in front of a station and near commercial facilities, nearly 90% of visitors used both the space and commercial facilities (Yamaguchi, Murota, and Akahane Citation2017). In addition, Yokota, Iida, and Itami (Citation2011) found that the facilities inside the railroad station ticket gates were more frequently used during boarding than during alighting.
Thus far, agent-based modeling has been conducted for concert halls, schools, airports, etc. However, while simulations of movement between railroad stations, movement on railroad platforms during alighting, and station floor movement have been conducted and useful knowledge for the development of railroad stations has been obtained, there has been no research or pedestrian simulation studies focused on the area in front of the station ticket gates, where the pedestrian flows entering the ticket gates to access the platforms, in front of the ticket gates in the concourse, and among facilities around the station are mixed.
This study therefore conducted a survey of the flowing and stationary people in front of the ticket gates at a railroad station to construct an agent-based model that can simulate pedestrian behavior according to the assigned automatic ticket gate directional restrictions, and thereby inform appropriate planning. The results of this research can help to alleviate the congestion caused by the gatherings of large numbers of passengers that can occur in any railroad station space, and to develop future pedestrian flow and architectural plans for the area in front of the ticket gates and surrounding facilities.
The remainder of this paper is organized as follows. The materials and methods presented in Section 2 describe the survey conducted to obtain the flowing and stationary behaviors of people in front of the ticket gates at a railroad station, which were used as the basis for the construction and verification of the agent-based model. Section 3 examines effects of the time period as well as the influence of the number of stationary people and ticket gate directional restriction pattern on the walking time of flowing people during commuting hours. Section 4 presents a discussion of the results and future opportunities for research, and Section 5 summarizes the conclusions of this study.
2. Materials and methods
2.1. Survey procedure
To obtain the variables used in the agent-based model simulation, we surveyed the flowing and stationary behaviors of people in front of the ticket gates at a train station during commuting and non-commuting hours. A summary of this survey is presented in . Initially, four large-scale stations in Osaka Prefecture (JR Osaka Station, Subway Namba Station, JR Tennoji Station, and JR Kyobashi Station) were evaluated as candidates for the survey. Among these stations, we chose the concourse in front of the ticket gates at the central gate of JR Tennoji Station – the third busiest station among JR West stations – as the survey target because it has a structure typical of railroad stations in Japan, in which the ticket gates are connected to a straight concourse delimited by pillars, and we were able to obtain the cooperation of the stationmaster. A photograph of the JR Tennoji Station concourse is shown in .
Figure 1. Japan railway Tennoji station concourse.
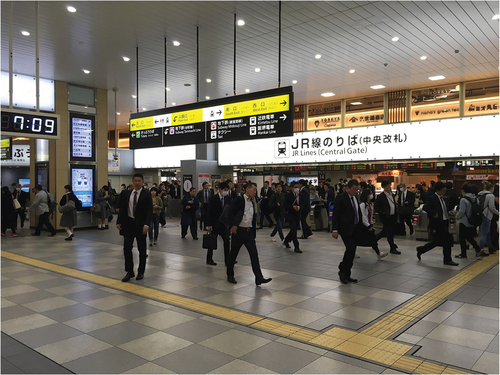
Table 1. Survey summary.
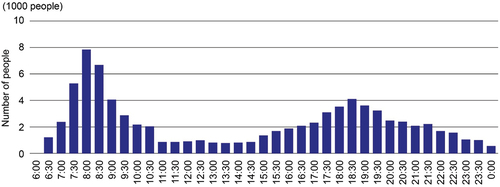
After consultation with the railroad company, the survey was conducted at JR Tennoji Station on Friday, 14 June 2019, when the typical daily passenger traffic was expected. The daily number of people using Tennoji Station is shown every half hour in , which was created by the authors based on information provided by the Ministry of Land, Infrastructure, Transport and Tourism (Citation2022). The figure shows that the largest number of people use the station in the morning, whereas the fewest number of people use the station in the early morning, daytime hours, and late night. Therefore, the survey was conducted during a peak commuting hour (7:30 to 8:30 am) and a low-traffic non-commuting hour (11:30 to 12:30 pm).
Figure 2. Number of people using Tennoji station (created by authors based on data from the Ministry of Land, Infrastructure, Transport and Tourism (Citation2022)).
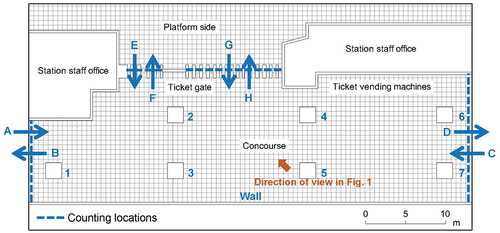
The survey employed twelve, one-minute visual counting periods conducted in five-minute intervals, during which the number of people flowing per unit time and the location and number of stationary people were counted. Flowing people were defined as those actively moving through the station, whereas stationary people were defined as those observed to stand in place for the duration of an entire one-minute survey period. A map of the JR Tennoji Station is shown in , in which the arrows indicate the direction in which the flowing people were typically observed to move. The survey was conducted by placing surveyors to count pedestrian movements at flow locations A to H shown in the figure, where A, C, E, and G count movement into the concourse, and B, D, F, and H count movement out of the concourse. Pedestrians moving in different directions were counted by different surveyors. For example, one investigator counted the flow at A while another investigator counted the flow at B.
Figure 3. Map of Japan railway Tennoji station concourse and locations of survey.
2.2. Flowing and stationary behaviors of people in front of the ticket gates
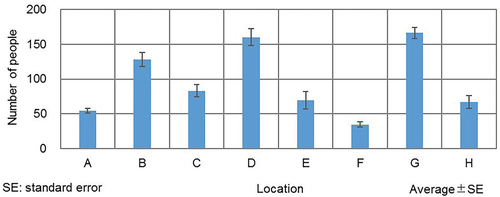
During the commuting period, a total of 9,168 people were observed to flow through the station and a total of 199 stationary people were counted. The average number of people flowing per minute during the commuting period is shown in , in which it can be observed that B, D, and G experienced higher traffic than the other locations. The reason for the low flow rate at F is that there are fewer ticket gates at this location than at G and H, and there are transfer gates for other lines in the directions of C and D, so most flowing people went to H.
Figure 4. Average number of people flowing per minute during the commuting period.
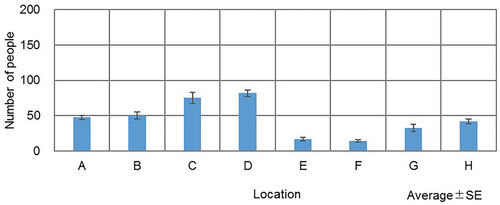
During the non-commuting period, a total of 4,330 people were observed to flow through the station and a total of 320 stationary people were counted. The average number of people flowing per minute during the non-commuting period is shown in . There were more people in A, B, C, and D than in E, F, G, and H near the ticket gates. The number of people flowing through the station is thought to have been higher than the number of passengers using the station during this period owing to the passage of people using the facilities around the station. However, the differences between the number of people in each location during the non-commuting period were not as large as during the commuting period.
Figure 5. Average number of people flowing per minute during the non-commuting period.
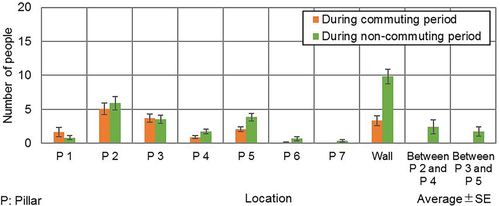
A comparison of the number of occupants per minute for each time period is shown in . Many stationary people were observed within an area of approximately 1,350 mm around Pillars 2, 3, and 5 (shown in , in which each pillar is 1,950 mm square) and along the wall, as these locations are easily recognized by people coming out of ticket gates and are suitable for waiting. Another reason for the large number of stationary people along the wall is that it is unencumbered by traffic. Notably, there were generally more stationary people during the non-commuting period than during the commuting period. In summary, during the commuting period, the number of flowing people was high and the number of stationary people was low, whereas the opposite was true during the non-commuting period.
Figure 6. Comparison of the number of stationary people per minute according to time period.
2.3. Reproducing the survey using agent-based modeling
The survey observations were reproduced using agent-based modeling (Clarke Citation2013), which can represent individual movement behavior through space. The artisoc 4.2.1 agent-based modeling software was applied in this study as several previous pedestrian simulations have reported its use (e.g., Eshiro et al. Citation2017; René et al. Citation2019). This software, developed by Kozo Keikaku Engineering Inc (Citation2022) to facilitate easier modeling for multi-agent simulations, has been available since 1998. Similar pedestrian simulations have been conducted at subway stations (Azadpeyma and Kashi Citation2019; Soltani and Kashi Citation2021) using VISSIM, Aimsun, and Path Finder software to evaluate service levels.
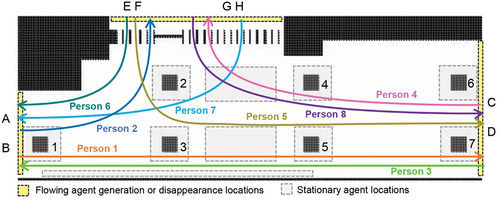
The Moore neighborhood calculation method was used to represent individual movement behavior in this study. This approach to agent-based modeling was restricted to application on the individual level; the consideration of group behaviors, i.e., multiple agents moving together, was not addressed in this study owing to the basic nature of the established model. Moreover, we did not observe any group behavior that could affect the movements of others during the field survey. First, we confirmed the accuracy of the constructed simulation by reproducing the conditions observed at the time of the surveys during the commuting and non-commuting periods. The generation locations for the flowing and stationary agents are shown in . The arrows for Persons 1 to 8 represent the potential direction of movement for each flowing agent. The stationary agents were generated and remained at random stationary locations where stationary people were observed during the survey: 1,350 mm around Pillars 1 to 7, between Pillars 2 and 4 and Pillars 3 and 5 (a 4,800 mm × 10,200 mm area), and along the wall across from the ticket gates. The concourse space was defined by a 750 × 250 grid, each cell of which was 150 mm square. The flowing agents were assumed to walk at a speed of 1,500 mm/s, which is the walking speed of an average person. Thus, a flowing agent moved through ten grid cells in 1 s.
Figure 7. Generation/disappearance locations and paths of flowing agents, and generation locations of stationary agents.
The procedure of the agent-based modeling method employed in this study is detailed in . The stationary agents were randomly generated and remained at their generation locations in the areas near the pillars or wall (shown in gray in , where stationary people were observed during the field survey) throughout the entire simulation, though in reality a stationary person would be expected to change their location every few minutes. The flowing agents appeared in regular intervals at random positions within the pre-defined generation locations (shown in yellow in ) according to the pedestrian flows observed during the field survey. After a flowing agent was generated, its direction of movement was determined in terms of the eight Moore neighborhood directions as shown in , in which X and Y are the coordinates of the flowing agent. In this process, the flowing agent first recognized its surroundings and moved to the next cell in its direction of movement according to the values of its potential map, developed by assigning values to cells based on the generation location and destination. Once a flowing agent arrived at its destination, it disappeared. The method of avoidance behavior employed by the flowing agents is shown in . If there were “other flowing agents,” “stationary agents,” or “walls/pillars” at any step in the process of movement toward its destination, the flowing agent randomly moved toward a free direction in its Moore neighborhood to avoid collision, then again determined its direction of movement from among the eight possible directions, repeating this process as necessary to reach its destination. When the leading flowing agent acted to avoid another agent or an obstacle such as a ticket gate, the following flowing agent could act to avoid or overtake the leading flowing agent according to the states of the cells in the various directions in its Moore neighborhood. In addition, when evaluating the potential moves in its Moore neighborhood, the following agent considered only the most efficient route toward its destination and did not account for the predicted movement of the leading agent. In this study, this approach was not expected to result in any conflicts between agents that would affect the outcome of the simulation, such as interference between agents (except for evasive action), because flowing agents did not follow others but explicitly moved towards their assigned destinations. Finally, the walking time from the generation point to the destination and the total number of agents passing through the destination were output as numerical values.
Figure 8. Chart of the agent-based modeling process.
Figure 9. Determining the direction of movement for a flowing agent (Moore neighborhood).
Figure 10. Avoidance behavior of a flowing agent.
Next, we calculated the number of flowing agents at each location and stationary agents in the concourse space using the average number of people observed by the field survey during the commuting and non-commuting periods. Simplified views of the concourse in front of the ticket gates at the target station are shown in . In the model, the flowing agents generated at A headed to D or F/H (), those generated at C headed to B or F/H (), and those generated at E/G headed to B or D (). The average number of people flowing per minute at each location in each time period during the field survey is shown in . Using the number of flowing people at each count location, we determined the number of agents appearing per minute at each generation location as shown in for the commuting period and in for the non-commuting period. Furthermore, the number of stationary agents appearing per minute was defined as the average number of stationary agents observed within each survey time period as shown in . The observed directional restrictions at the ticket gates for the commuting and non-commuting periods are shown in ), respectively.
Figure 11. Diagram of three possible directions of flowing agent movement.
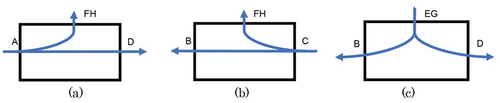
Figure 12. Observed directional restrictions at the ticket gates during the survey (a) commuting period and (b) non-commuting period.
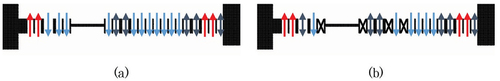
Table 2. Average number of flowing people per minute for each time period during the field survey.
Table 3. Numbers of flowing agents appearing per minute during the commuting period.
Table 4. Numbers of flowing agents appearing per minute during the non-commuting period.
Table 5. Average numbers of stationary people for each time period during the field survey.
In order to show the results for a steady state, the reproduction simulation was run from 300 s (after 5 min) to 3900 s, that is, for 3600 s (60 min). The results of three simulation patterns were evaluated: the average of six, 10-min steady state periods; the average of twenty, 3-min steady state periods; and the average over one, 60-min steady state period. These simulations were run to achieve an error within ±5% of the time of the field survey. Because each pattern exhibited the same range of error in the number of agents passing per minute, the average over one 60-min period was used in this study for efficiency. The final error rates of the number of agents passing through the reproduction simulation during the commuting and non-commuting survey periods are shown in to be approximately 5% when compared to the number of people observed to be passing through during the survey.
Table 6. Error rate of the number of people or agents passing through the target station.
3. Results
3.1. Influence of time period
The simulated walking times from the generation position to the destination are shown in . The gray bars depict the minimum flowing agent walking times when unaffected by other flowing agents or stationary agents. The situations simulated during the commuting and non-commuting periods are shown in ), respectively. Comparing the minimum walking times with the walking times during the commuting period in , the walking times of Persons 2, 4, 5, 6, 7, and 8 during the commuting period were more than twice their minimum walking times owing to the limited number of ticket gates that could be passed through. The walking time was therefore influenced by the behavior of avoiding other flowing agents near the ticket gates as well as the time waiting to pass through the ticket gates. On the other hand, the walking times during the non-commuting period were close to the minimum walking times, with no flowing agents exceeding the walking times observed during the commuting period. This indicates that the number of flowing agents in the space directly affects the walking time.
Figure 13. Walking time from the generation position to the destination.
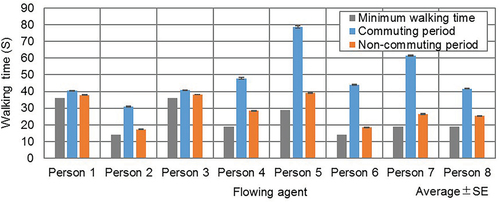
Figure 14. Simulated situation at a moment in time during the (a) commuting and (b) non-commuting periods.
3.2. Influence of stationary people
When a large number of people remain stationary in the space in front of the ticket gates, the movement of flowing people is severely restricted, making it necessary for the station manager to identify a possible waiting area. To analyze how a change in the number of stationary people in front of the ticket gates affects the walking time of the flowing people in the station, we varied the number of stationary agents in a series of simulations.
In this analysis, we focused on commuting hours, when the number of flowing people was the highest. The number of flowing agents was therefore set to the number of flowing people calculated using the survey results (), and the directional limits of the ticket gates were set to those observed during the survey (). Then, we simulated cases with 0, 5, 10, 15, 20, 25, 30, 35, or 40 stationary agents distributed at randomized positions in each of the locations around Pillars 1 to 7, between Pillars 2 and 4, between Pillars 3 and 5, and along the wall.
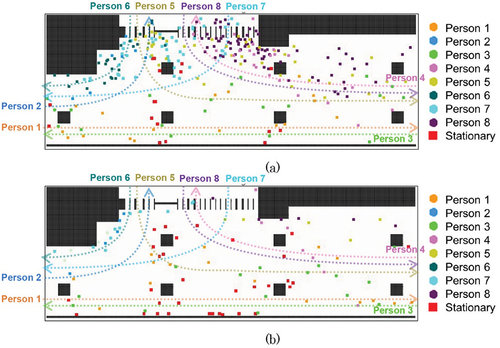
The flowing agent walking times according to the number of stationary agents in the concourse during commuting hours are shown in . The simulated situations with 0, 15, and 30 stationary agents are shown in ), respectively. shows that the walking times of Persons 1, 3, 4, 5, 7, and 8 tended to increase as the number of stationary agents increased, whereas those of Persons 2 and 6 tended to decrease.
Figure 15. Flowing agent walking times according to the number of stationary agents during commuting hours.
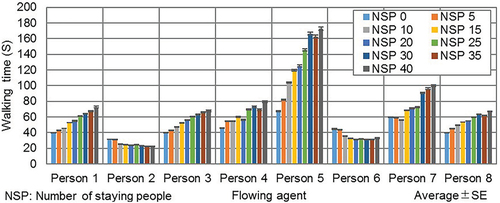
Figure 16. Simulated situation at a moment in time with (a) 0, (b) 15, and (c) 30 stationary agents.
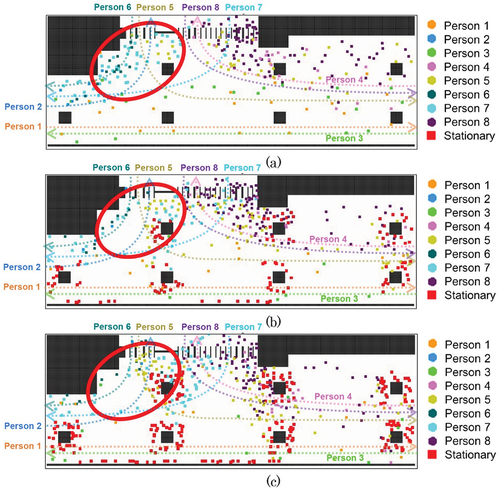
The results of the Jonckheere–Terpstra test (Jonckheere Citation1954), which analyzes the presence or absence of increasing or decreasing trends, showed a significant difference of p < 0.05 for the walking times of all flowing agents when considering the presence of stationary agents. The area where the walking times of Persons 2 and 6 exhibited a tendency to decrease as the number of stationary agents increased is circled in red in . As the number of stationary agents increased, the path of Person 7 relocated from the left side of Pillar 2 to pass around the right between Pillars 2 and 3 owing to the hindrance presented by the stationary agents around Pillar 2 and the path of Person 5. This shift in path created more empty space without flowing agents on the left end of the ticket gates that made it easier for Persons 2 and 6 to pass through.
3.3. Influence of ticket gate directional restriction pattern
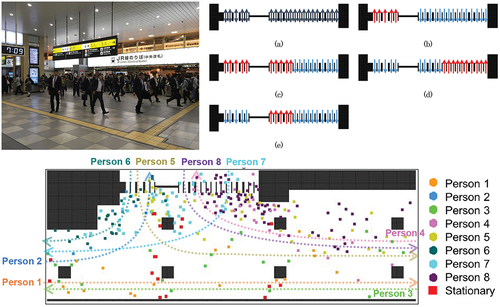
Finally, we analyzed how the flowing agent walking times changed according to the pattern of entry and exit directional restrictions at the ticket gates during commuting hours. The number of flowing agents was set to the number of flowing people calculated from the survey results obtained during the commuting period (), and the number of stationary agents was set to the corresponding number of stationary people counted (). The five ticket gate directional restriction patterns evaluated in this investigation are shown in .
Figure 17. Evaluated ticket gate directional restriction patterns: (a) unrestricted, (b) Pattern 1, (c) Pattern 2, (d), Pattern 3, and (e) Pattern 4.
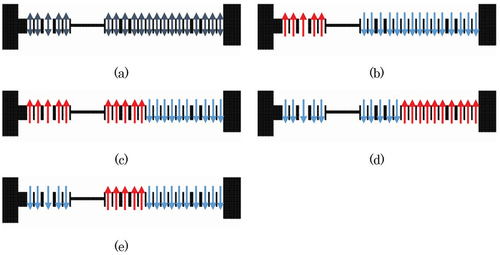
The unrestricted pattern shown in allowed flow in either direction at all gates. Pattern 1, shown in , provided the left ticket gates for entry onto the platform and the right ticket gates for exiting into the concourse. Pattern 2, shown in , provided five more ticket gates for entering the platform, making the number of entrances and exits equal. Pattern 3 in )
was defined as the opposite configuration of Pattern 2; that is, the locations of the entry and exit gates were reversed. Pattern 4 in permitted entry to the platform side at the middle of the ticket gate bank and permitted exiting into the concourse at the outsides of the bank, with five more exiting gates than entering gates.
The walking times according to ticket gate directional restriction pattern are shown in . The overall trend indicates that the walking times were generally shorter for the restricted patterns than for the unrestricted pattern or for the pattern in use during the survey (shown in ). Thus, restricting and organizing the entry and exit directions at the ticket gates improved the traffic flow and reduced walking time.
Figure 18. Flowing agent walking times according to ticket gate directional restriction pattern.
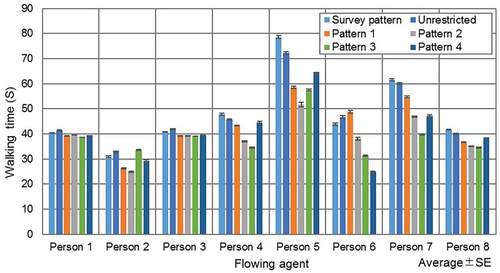
The paths of Persons 1 and 3 were not defined to pass through the ticket gates, so the ticket gate directional restriction pattern had almost no effect on their walking times. However, the walking times of Persons 2, 4, 5, 6, 7, and 8 were clearly affected by the ticket gate directional restriction pattern. For Pattern 2, Person 5, who had the longest walking time in the field survey, experienced the largest decrease in walking time, and the walking time of each agent was typically short. For Pattern 3, Persons 4, 7, and 8 experienced the shortest walking times; however, the walking time of Person 2 increased, which is not ideal. Patterns 1 and 4 tended to consistently provide shorter walking times than those observed in the survey, but the reductions were smaller than for the other patterns. These results indicate that ticket gate traffic Pattern 2 is the best solution for shortening the walking time of flowing agents.
4. Discussion
The agent-based model simulation employed in this study was also used to identify the locations in front of the ticket gates at a station that most affect the walking time of flowing people. In this study, the space available for the passage for flowing people was narrowed by the relative proximity of the ticket gates to the pillars, where crossings by flowing people frequently occurred. These places should be given careful attention as locations of regular congestion when planning a station layout. Furthermore, station managers could control congestion by guiding users so that they do not remain in front of the ticket gates and providing a plaza space where they can rest or meet in advance. In addition, we suggest that pedestrians will be able to move more smoothly through the station concourse when a traffic flow is intentionally created using directional restrictions at the ticket gates along with signage plans. The reduction of stationary behavior by providing no-stopping marks on the floor, audio guidance during congestion, and management by attendants could also help to improve traffic flow, but the spatial awareness of people once they understand these suggestions must be improved to ensure they do not simply contribute to congestion elsewhere. Thus, the results of this analysis will be useful for pedestrian traffic planning in future facilities and the development of measures to alleviate congestion in places that are regularly or sporadically crowded.
Though the simulations performed in this study assumed a steady flow of people, the number of people flowing through a railroad station will in fact change according to the arrival times of the trains. In future work, we expect to reproduce a situation closer to the current station usage behavior and analyze the nature of the resulting congestion in more detail by increasing or decreasing the number of people in motion during the agent-based pedestrian simulation employed in this study. Furthermore, we believe that expanding the scope of the simulation from solely the concourse to include the complete interior layout of the station, considering areas such as the platforms, may provide new insights. Finally, an analysis consisting of solely individual stationary and flowing behaviors will not necessarily produce a complete picture of congestion; measures to also consider group behavior should be discussed in future work alongside other considerations, such as station layout.
5. Conclusions
In this study, we conducted a field survey to observe the behavior of flowing and stationary users in the concourse in front of the ticket gates at a railroad station during commuting and non-commuting hours, and then reproduced our observations using agent-based modeling. Next, we analyzed the effect of the number of stationary people and ticket gate directional restriction pattern on the walking times of flowing people during commuting hours. The primary conclusions are as follows.
The analysis results demonstrated that the walking times of the flowing people in the concourse of the target station were affected by the number of flowing people (i.e., during commuting or non-commuting hours), number of stationary people, and ticket gate directional restriction pattern. Though this behavior is widely understood through sensory-based qualitative reasoning, the results of this study reflect this understanding in “quantified” terms.
The walking times of flowing people during non-commuting hours never exceeded those during commuting hours; i.e., a smaller number of flowing people allowed all flowing people to take the shortest route to their destination, creating a smoother flow. Railroad companies and government authorities in Japan are currently encouraging companies to implement staggered work hours to reduce congestion on trains during commuting hours. The results of this study indicate that staggered work hours would also be effective in reducing delays in front of the ticket gates at stations.
The simulation results also indicated that the walking times of most flowing people tended to increase with the number of stationary people in the station, and the fewer stationary people in the concourse, the smoother the flow.
By comparing the effects of various ticket gate directional restriction patterns, we found that the walking times can be made shorter than those observed during the survey by placing the ticket gates for entry onto the platform and exit into the concourse on opposite sides, creating a deliberate flow pattern. Indeed, based on the results of this study, we believe that restricting the direction of flow at the ticket gates represents the simplest way to reduce congestion in front of the ticket gates in existing stations during commuting hours.
Acknowledgments
The survey for this study was conducted at Tennoji Station, which is under the jurisdiction of JR West. The authors thank the staff members at the JR Tennoji Station for their support and cooperation.
Disclosure statement
No potential conflict of interest was reported by the author(s).
Additional information
Notes on contributors
Takashi Yamada
Takashi Yamada is a lecturer in the Department of Human Factors Engineering and Environmental Design, Kindai University, Japan. He received a Ph.D. from Keio University, Japan. His research covers human behavior modeling, simulation, and space design analysis in buildings and urban spaces.
Michise Utaka
Michise Utaka received her B.E. from Kindai University. Her research interests include spatial data analysis and human behavior.
References
- Asmer, L., A. Popa, T. Koch, A. Deutschmann, and M. Hellmann. 2019. “Secure Rail Station – Research on the Effect of Security Checks on Passenger Flow.” Journal of Rail Transport Planning & Management 10: 9–22. doi:10.1016/j.jrtpm.2019.04.002.
- Azadpeyma, A., and E. Kashi. 2019. “Level of Service Analysis for Metro Station with Transit Cooperative Research Program (TCRP) Manual: A Case Study—Shohada Station in Iran.” Urban Rail Transit 5 (1): 39–47. doi:10.1007/s40864-018-0098-0.
- Blue, V. J., and J. L. Adler. 2001. “Cellular Automata Microsimulation for Modeling Bi-Directional Pedestrian Walkways.” Transportation Research Part B: Methodological 35 (3): 293–312. doi:10.1016/s0191-2615(99)00052-1.
- Chen, X., L. Haiying, J. Miao, S. Jiang, and X. Jiang. 2017. “A Multiagent-Based Model for Pedestrian Simulation in Subway Stations.” Simulation Modelling Practice and Theory 71: 134–148. doi:10.1016/j.simpat.2016.12.001.
- Clarke, K. C. 2013. “Cellular Automata and Agent-Based Models.” In Handbook of Regional Science, edited by M. M. Fischer and P. Nijkamp, 1217–1233. Berlin: Springer-Verlag. doi:10.1007/978-3-642-23430-9_63.
- Davidich, M., F. Geiss, H. G. Mayer, A. Pfaffinger, and C. Royer. 2013. “Waiting Zones for Realistic Modelling of Pedestrian Dynamics: A Case Study Using Two Major German Railway Stations as Examples.” Transportation Research Part C: Emerging Technologies 37: 210–222. doi:10.1016/j.trc.2013.02.016.
- Do, T., M. Haghani, and M. Sarvi. 2016. “Group and Single Pedestrian Behavior in Crowd Dynamics.” Transportation Research Record 2540 (1): 13–19. doi:10.3141/2540-02.
- Elmar, K., M. Günther, C. Stummer, and L. M. Wakolbinger. 2012. “Agent-Based Simulation of Innovation Diffusion: A Review.” Central European Journal of Operations Research 20 (2): 183–230. doi:10.1007/s10100-011-0210-y.
- Emily, P., S. H. Hamdar, and W. Daamen. 2018. “Pedestrian Dynamics at Transit Stations: An Integrated Pedestrian Flow Modeling Approach.” Transportmetrica A: Transport Science 14 (5–6): 468–483. doi:10.1080/23249935.2017.1378280.
- Eshiro, H., N. Okada, K. W. Hipel, and L. Fang. 2017. “Cooperative Survival Principles for Underground Flooding: Vitae System Based Multi-Agent Simulation.” Expert Systems with Applications 83: 379–395. doi:10.1016/j.eswa.2017.04.034.
- Feng, Y., D. Duives, W. Daamen, and S. Hoogendoorn. 2021. “Data Collection Methods for Studying Pedestrian Behaviour: A Systematic Review.” Building and Environment 187: 107329. doi:10.1016/j.buildenv.2020.107329.
- Fonseca I Casas, P., J. Casanovas, and X. Ferran. 2014. “Passenger Flow Simulation in a Hub Airport: An Application to the Barcelona International Airport.” Simulation Modelling Practice and Theory 44: 78–94. doi:10.1016/j.simpat.2014.03.008.
- Fushimi, K., and M. Asano. 2005. “Analysis on the Pedestrian Retention.” Journal of the City Planning Institute of Japan 40 (3): 313–318. doi:10.11361/journalcpij.40.3.313.
- Haghani, M., and M. Sarvi. 2016. “Human Exit Choice in Crowded Built Environments: Investigating Underlying Behavioural Differences between Normal Egress and Emergency Evacuations.” Fire Safety Journal 85: 1–9. doi:10.1016/j.firesaf.2016.07.003.
- Ha, V., and G. Lykotrafitis. 2012. “Agent-Based Modeling of a Multi-Room Multi-Floor Building Emergency Evacuation.” Physica A: Statistical Mechanics and Its Applications 391 (8): 2740–2751. doi:10.1016/j.physa.2011.12.034.
- Hänseler, F. S., M. Bierlaire, and R. Scarinci. 2016. “Assessing the Usage and Level-of-Service of Pedestrian Facilities in Train Stations: A Swiss Case Study.” Transportation Research Part A: Policy and Practice 89: 106–123. doi:10.1016/j.tra.2016.05.010.
- Hassannayebi, E., M. Memarpour, S. Mardani, M. Shakibayifar, I. Bakhshayeshi, and S. Espahbod. 2020. “A Hybrid Simulation Model of Passenger Emergency Evacuation under Disruption Scenarios: A Case Study of A Large Transfer Railway Station.” Journal of Simulation 14 (3): 204–228. doi:10.1080/17477778.2019.1664267.
- Heath, B., R. Hill, and F. Ciarallo. 2009. “A Survey of Agent-Based Modeling Practices (January 1998 to July 2008).” Journal of Artificial Societies and Social Simulation 12 (4): 9. https://www.jasss.org/12/4/9.html
- Helbing, D., L. Buzna, A. Johansson, and T. Werner. 2005. “Self-Organized Pedestrian Crowd Dynamics: Experiments, Simulations, and Design Solutions.” Transportation Science 39 (1): 1–24. doi:10.1287/trsc.1040.0108.
- Hong, L., J. Gao, and W. Zhu. 2018. “Self-Evacuation Modelling and Simulation of Passengers in Metro Stations.” Safety Science 110: 127–133. doi:10.1016/j.ssci.2018.05.013.
- Hoogendoorn, S. P., M. Hauser, and N. Rodrigues. 2004. “Applying Microscopic Pedestrian Flow Simulation to Railway Station Design Evaluation in Lisbon, Portugal.” Transportation Research Record 1 (1): 83–94. doi:10.3141/1878-11.
- Ishibashi, T., A. Suzuki, and H. Shibutani. 2008. “A Study on Multiagent Simulation of Flow of People.” Transactions of the Japan Society of Mechanical Engineers Series C 74 (744): 1985–1992. doi:10.1299/kikaic.74.1985.
- Jonckheere, A. R. 1954. “A Distribution-Free k-Sample Test against Ordered Alternatives.” Biometrika 41 (1/2): 133–145. doi:10.2307/2333011.
- Kallianiotis, A., D. Papakonstantinou, V. Arvelaki, and A. Benardos. 2018. “Evaluation of Evacuation Methods in Underground Metro Stations.” International Journal of Disaster Risk Reduction 31: 526–534. doi:10.1016/j.ijdrr.2018.06.009.
- Kaushal, A., Y. Zhao, Q. Peng, T. Strome, E. Weldon, M. Zhang, and A. Chochinov. 2015. “Evaluation of Fast Track Strategies Using Agent-Based Simulation Modeling to Reduce Waiting Time in a Hospital Emergency Department.” Socio-Economic Planning Sciences 50: 18–31. doi:10.1016/j.seps.2015.02.002.
- Kim, D. 2021. “New Horizons in Modeling and Simulation for Social Epidemiology and Public Health.” Wiley.
- Kozo Keikaku Engineering Inc. 2022. “Mas Community: Simulating the World’s Complex Systems.” Accessed 21 October 2022. https://mas.kke.co.jp/en/
- Lee, J., H. Lee, and M. McCuskey Shepley. 2020. “Exploring the Spatial Arrangement of Patient Rooms for Minimum Nurse Travel in Hospital Nursing Units in Korea.” Frontiers of Architectural Research 9 (4): 711–725. doi:10.1016/j.foar.2020.06.003.
- Lei, W., L. Angui, R. Gao, X. Hao, and B. Deng. 2012. “Simulation of Pedestrian Crowds’ Evacuation in a Huge Transit Terminal Subway Station.” Physica A: Statistical Mechanics and Its Applications 391 (22): 5355–5365. doi:10.1016/j.physa.2012.06.033.
- Liang, M., B. Chen, S. Qiu, L. Zhen, and X. Qiu. 2017. “Agent-Based Modeling of Emergency Evacuation in a Railway Station Square under Sarin Terrorist Attack.” International Journal of Modeling, Simulation, and Scientific Computing 8 (2): 1750022. doi:10.1142/s1793962317500222.
- Limao, Z., M. Liu, W. Xianguo, and S. M. AbouRizk. 2016. “Simulation-Based Route Planning for Pedestrian Evacuation in Metro Stations: A Case Study.” Automation in Construction 71: 430–442. doi:10.1016/j.autcon.2016.08.031.
- Lin, J., L. Cao, and L. Nan. 2020. “How the Completeness of Spatial Knowledge Influences the Evacuation Behavior of Passengers in Metro Stations: A VR-Based Experimental Study.” Automation in Construction 113: 103136. doi:10.1016/j.autcon.2020.103136.
- Liu, J., and X. Chen. 2019. “Simulation of Passenger Motion in Metro Stations during Rush Hours Based on Video Analysis.” Automation in Construction 107: 102938. doi:10.1016/j.autcon.2019.102938.
- Liu, X., L. Lingshan, X. Liu, and T. Zhang. 2019. “Analysis of Passenger Flow and Its Influences on HVAC Systems: An Agent Based Simulation in a Chinese Hub Airport Terminal.” Building and Environment 154: 55–67. doi:10.1016/j.buildenv.2019.03.011.
- Ministry of Land, Infrastructure, Transport and Tourism. 2013. “Basic Plan on Transportation Policy.” Accessed 21 October 2022. https://www.mlit.go.jp/common/001069407.pdf
- Ministry of Land, Infrastructure, Transport and Tourism. 2019. “Urban Planning Status Survey.” Accessed 21 October 2022. https://www.mlit.go.jp/toshi/tosiko/genkyou.html
- Ministry of Land, Infrastructure, Transport and Tourism. 2020. “The Average Congestion Rate in the Three Major Metropolitan Areas Remains Flat-Announcement of Survey Results of Congestion Rate of Urban Railways.” Accessed 21 October 2022. https://www.gov-base.info/2020/09/25/96732
- Ministry of Land, Infrastructure, Transport and Tourism. 2022. “Public Transport Policy: The 12th Transportation Census of Urban Cities, Survey of Fiscal Year 2017 (Analysis).” Accessed 21 October 2022. https://www.mlit.go.jp/sogoseisaku/transport/sosei_transport_tk_000091.html
- Naka, Y. 1977. “Mechanism of Cross Passenger Flow: Study on Complicated Passenger Flow in Railway Station (Part 1).” Transactions of the Architectural Institute of Japan 258: 93–102. doi:10.3130/aijsaxx.258.0_93.
- Pan, Z., Q. Wei, and H. Wang. 2021. “Agent-Based Simulation of Hindering Effect of Small Group Behavior on Elevated Interval Evacuation Time along Urban Rail Transit.” Travel Behaviour and Society 22: 262–273. doi:10.1016/j.tbs.2020.10.007.
- René, N., A. Oliveira, T. Tanizaki, T. Shimmura, N. Fujii, and T. Takenaka. 2019. “Multi-Agent Simulation-Based Analysis for Restaurant Service.” Procedia CIRP 79: 673–678. doi:10.1016/j.procir.2019.02.044.
- Rindsfüser, G., and F. Klügl. 2007. “Agent-Based Pedestrian Simulation.” disP - the Planning Review 43 (170): 9–18. doi:10.1080/02513625.2007.10556985.
- Rostami, R., and M. Alaghmandan. 2021. “Performance-Based Design in Emergency Evacuation: From Maneuver to Simulation in School Design.” Journal of Building Engineering 33: 101598. doi:10.1016/j.jobe.2020.101598.
- Seriani, S., and R. Fernandez. 2015. “Pedestrian Traffic Management of Boarding and Alighting in Metro Stations.” Transportation Research Part C: Emerging Technologies 53: 76–92. doi:10.1016/j.trc.2015.02.003.
- Shiwakoti, N., R. Tay, P. Stasinopoulos, and P. Jarrod Woolley. 2017. “Likely Behaviours of Passengers under Emergency Evacuation in Train Station.” Safety Science 91: 40–48. doi:10.1016/j.ssci.2016.07.017.
- Soltani, E., and E. Kashi. 2021. “Pedestrian Simulation and PLOS Analysis in the Subway Station.” Innovative Infrastructure Solutions 7 (1): 65. doi:10.1007/s41062-021-00662-2.
- Sukor, A., N. Sabahiah, N. Abdul Rahman, M. Md Rohani, K. Ambak, and S. Asmah Hassan. 2019. “Pedestrian Movement at the Unpaid Concourse Area in KLCC Train Station.” International Journal of Integrated Engineering 11 (8): 279–291. doi:10.30880/ijie.2019.11.08.028.
- Tang, M., and H. Yingdong. 2017. “Pedestrian Simulation in Transit Stations Using Agent-Based Analysis.” Urban Rail Transit 3 (1): 54–60. doi:10.1007/s40864-017-0053-5.
- Tokyo Metro Co., Ltd. 2019. “Providing Peace of Mind.” Accessed 21 October 2022. https://www.tokyometro.jp/lang_en/corporate/profile/plan/keyword_01.html
- Wagner, N., and V. Agrawal. 2014. “An Agent-Based Simulation System for Concert Venue Crowd Evacuation Modeling in the Presence of a Fire Disaster.” Expert Systems with Applications 41 (6): 2807–2815. doi:10.1016/j.eswa.2013.10.013.
- Weng, W. G., L. L. Pan, S. F. Shen, and H. Y. Yuan. 2007. “Small-Grid Analysis of Discrete Model for Evacuation from a Hall.” Physica A: Statistical Mechanics and Its Applications 374 (2): 821–826. doi:10.1016/j.physa.2006.08.003.
- Yamaguchi, K., M. Murota, and Y. Akahane. 2017. “A Study on the Relationship of Sitting and Resting Behavior Action between Large-Scale Commercial Facilities and the Adjacent Station Square.” Journal of Architecture and Planning (Transactions of AIJ) 82 (737): 1747–1755. doi:10.3130/aija.82.1747.
- Yamashita, Y., T. Sekiguchi, and H. Uchiyama. 2006. “A Study on the Crossing Phenomenon at the Walking Space in the Railway Station.” Infrastructure Planning Review 23: 489–495. doi:10.2208/journalip.23.489.
- Yang, Y., L. Jin, and Q. Zhao. 2014. “Study on Passenger Flow Simulation in Urban Subway Station Based on Anylogic.” Journal of Software 9 (1): 140–146. doi:10.4304/jsw.9.1.140-146.
- Yokota, T., T. Iida, and K. Itami. 2011. “Relationship between Human Behavior and Facilities Located in Concourse of the Railway Stations in Kansai Area.” AIJ Journal of Technology and Design 17 (35): 277–282. doi:10.3130/aijt.17.277.
- Zhang, Q., B. Han, and L. Dewei. 2008. “Modeling and Simulation of Passenger Alighting and Boarding Movement in Beijing Metro Stations.” Transportation Research Part C: Emerging Technologies 16 (5): 635–649. doi:10.1016/j.trc.2007.12.001.
- Zhang, J., W. Song, and X. Xuan. 2008. “Experiment and Multi-Grid Modeling of Evacuation from a Classroom.” Physica A: Statistical Mechanics and Its Applications 387 (23): 5901–5909. doi:10.1016/j.physa.2008.06.030.
- Zheng, X., L. Hai-ting, L.-Y. Meng, X. Xin-yue, and X. Chen. 2015. “Improved Social Force Model Based on Exit Selection for Microscopic Pedestrian Simulation in Subway Station.” Journal of Central South University 22 (11): 4490–4497. doi:10.1007/s11771-015-2997-5.
- Zhu, R., J. Lin, B. Becerik-Gerber, and L. Nan. 2020. “Influence of Architectural Visual Access on Emergency Wayfinding: A Cross-Cultural Study in China, United Kingdom and United States.” Fire Safety Journal 113: 102963. doi:10.1016/j.firesaf.2020.102963.