
 ?Mathematical formulae have been encoded as MathML and are displayed in this HTML version using MathJax in order to improve their display. Uncheck the box to turn MathJax off. This feature requires Javascript. Click on a formula to zoom.
ABSTRACT
Buildings incorporating kinetic architecture are designed to allow parts of the structure to move without reducing the structural integrity of the building. This is believed to substantially improve both energy efficiency and lighting performance. The aim of this study was to investigate the advantages of employing a kinetic façade system and achieving a comfort illuminance level. A G + 7 office building was chosen as the case study for this research. DIVA-for-Rhino simulation software was used to determine how the proposed kinetic system was integrated and compare it to the baseline case. The results show that kinetic louvers can help to achieve light levels in the range 100–300 lux, and a brightness level of 250 to 350 cd/m2. The total energy used decreased by 21.3% and the Unified Glare Rating (UGR) fell from 29.5 to below 10. In addition, Kinetic louvers achieved 100 – 300 lux and a brightness level of 250 to 350 cd/m2. Furthermore, it was found that an annual reduction of 12% occurred on the east side. More detailed analysis is provided in the paper which will help architects and designers to integrate the kinetic system in the façade of their buildings and achieve visual comfort.
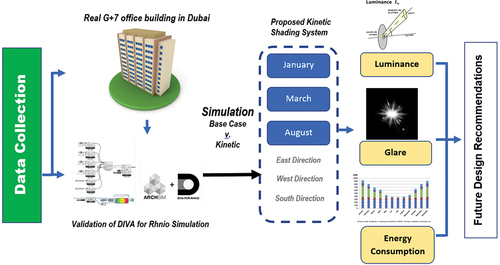
GRAPHICAL ABSTRACT
1. Introduction
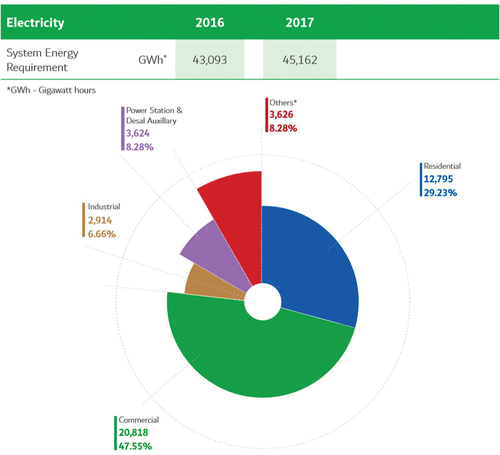
Buildings account for nearly 40% of all greenhouse gas emissions (GHGs), according to Architecture 2030. A building’s capability for motion can enable it to respond to various environmental conditions and perform a variety of functions that would be difficult for a static structure. In the 20th Century, interest in kinetic architecture grew alongside a strand of thought emerging from the Futurism movement (Fortmeyer and Linn Citation2014). A kinetic façade that interacts with the outdoor environmental surrounding it was thought to achieve better energy efficiency and lighting comfort (Aksamija Citation2013). Recent statistics in UAE, have shown that the average energy consumption per capita is 11,766 kWh and that the demand for energy continues to grow. For instance, shows that electricity consumption by the commercial building sector in Dubai is very high, representing 47.55% of the total energy demand (DEWA (Dubai Electricity and Water authority) Citation2017). Exterior dynamic shading devices installed on “kinetic façades” can generate shaded areas on windows that vary according to the shape of the shading elements and their direction of movement. Finding a solution to lower energy consumption in the building sector is therefore imperative. Of equal importance for office buildings is that wise lighting design will make all work tasks easier. Appropriate lighting, without glare or shadows, can reduce eye fatigue and headaches; it can also prevent workplace accidents by increasing the visibility of moving machinery and of other safety hazards (Li and Lam Citation2001). Therefore, it is important to investigate the advantages of implementing a kinetic façade system and achieving a comfortable illuminance level. Consequently, the aim of this paper is to investigate the advantages of such implementation and of achieving a comfort illuminance level, and of the potential energy reduction.
Figure 1. Electricity consumption by sector in Dubai 2017 (DEWA (Dubai Electricity and Water authority) Citation2017).
2. Literature review
2.1. Current global status of kinetic façades
Many international researchers have investigated the use of kinetic façade systems, either involving real experiments or simulations, in order to improve the architectural and energy performances of buildings (Mahmoud and Elghazi Citation2016). The diversity of innovative techniques employed could help us use less energy by the middle of the 21st Century (Mawada and Ahmed Citation2015). An experimental study was conducted in Italy using a rectangular planar metal plate supported on four corners. The material used for the panel was aluminum while nitinol was used for the wire. This provided the necessary force to open the panel and to provide a sustainable façade that reacted to thermal variations without an energy supply (Formentini and Lenci Citation2018). Another study in Korea classified the kinetic façade into six types according to the shape (i.e., horizontal, vertical, and plane) and the movement direction (i.e., length, rotation, and aperture) of the shading elements. The shaded fractions were accurately calculated using the positional relationships of the sun, the shading device, and the window involved (Choi, Lee, and Jo Citation2017). Further studies have proposed a reduction factor for the shading system for various types of shading devices (e.g., no shading = 1.0, internal venetian blind = 0.5, and external awning blind = 0.4) (Kim and Jarrett Citation2011)
In Algeria, researchers examined and evaluated the effect and performance of smart façades in the context of indoor thermal comfort and energy efficiency. They found that the new façade system minimized exposure to direct radiation by 17.9% baseline and significantly reduced energy consumption of baseline case to 43% (Ben Bacha and Bourbia Oct, Citation2016)
Previous research in Jordan has highlighted the substantial impact that shading devices have on the thermal and daylight performance of offices in hot climate regions. They found that an egg-crate design improves the level of daylight, diagonal fins reduce illuminance in the morning to a low level, and vertical fins to shield offices from much of the afternoon sun (Freewan Citation2014)
Another research study conducted in Egypt employed a kinetic façade system in residential buildings and found that this system improved and decreased the internal temperature of the building by approximately 2–3°C. This saved about 18–20% of the energy used for air-conditioning in a standard building without a shading system (Mostafa et al. Citation2016).
Finally, a team of researchers collected built examples to assess the current state of the art in terms of adaptive façade systems and their environmental performance. They concluded that, for adaptive façade systems, a large amount of energy is required to activate the sensors and actuators. Ideally, this should be lower than the amount of energy saved. These aspects will have to be addressed to ensure the sustainability of such systems (Barozzi1 et al. Citation2016).
2.2. An overview of dynamic shading
The application of dynamic systems is not only exclusive to windows. They have been utilized to enhance photovoltaic power generation (Blaifi et al. Citation2019). Windows are a crucial part of a building envelope, where heat exchange takes place. Many researchers (Zhai et al. Citation2019) have tried to optimize to improve the performance of windows in the building façade. Automated shading systems decrease energy use and improve occupant visual comfort (Colaco et al. Citation2008). Motorized blinds make up the majority of the systems examined, whereas the analysis of new emerging ideas on deployable and foldable façade systems is limited (Konstantoglou and Tsangrassoulis Citation2016). A dynamic shading study in Korea on a mock-up room indicated that, in summer, a blind slat at an angle of 30° (static angle) or dynamic shading is suitable for an energy efficient and anti-glare control strategy (Yun, Yoon, and Kim Citation2014). Another interesting simulation study using the Rhino/Grasshopper environment software, helped to achieve 20–80% net energy saving by the use of dynamic shading compared to an equivalent static system (Jayathissa et al. Citation2017). An experimental study of daylight glare probability in offices with dynamic window shades concluded that simple sunlight protection strategies cannot prevent glare, despite maximizing daylight utilization (Konstantzos, Tzempelikos, and Chan Citation2015). To conclude this part, dynamic shading has a great deal of potential in hot sunny regions like the UAE. It is of the utmost importance to remember that daylight generates energy savings by decreasing the dependence on electrical lighting, but the increase in solar energy can strain HVAC systems and diminish occupant comfort.
2.3. State of the art
Many researchers have covered the topic under consideration in the last decade. For instance, there has been a study (Kensek and Hansanuwat Citation2011) of a kinetic façade system based on research, simulations, and a built prototype that improves upon current practice and provides an efficient façade for traditional curtain-walled office buildings. Another study using a simulation tool demonstrated the analysis of kinetic motion for daylight optimization at the early design stage, and suggested possible configurations for daylight performance (Sharaidin, Burry, and Salim Citation2012). Another study (Casini Citation2018) stated that dynamic glazing, by modulating the entry of near infrared radiation and visible light, can lead to significant energy savings, as well as ensuring better visual thermal and visual comfort for building users. In a study (Jones, Hou, and Li Citation2015) conducted in Zurich, Chongqing and Abu Dhabi, the authors tried to achieve zero carbon design in offices by integrating smart facades, ventilation, and surface heating and cooling. Many authors believe that the application of a kinetic façade system is both adaptive and sustainable (Barozzi et al. Citation2016). Although the UAE has an exemplar of a kinetic façade (Attia Citation2016), there is a shortage of such research in the UAE region. Therefore, attempts have been made to fill a knowledge gap in the building literature. The findings will help architects and researchers to take action to exploit the kinetic façade system to achieve visual comfort. The generalizability of the research findings is possible and the findings may be applicable, not only in the UAE, but in any country with a similar environmental and climatic context. A study (Nielsen, Svendsen, and Jensen Citation2011) investigated Quantifying the potential of automated dynamic solar shading in office buildings through integrated simulations of energy and daylight, despite the solar energy contribution, the dynamic shading showed a reduction of total annual energy demand of approximately 13%. Similar studies (Skarning, Hviid, and Svendsen Citation2017) in Rome and Copenhagen quantified the effect of dynamic solar shading on energy, daylighting and thermal comfort in a nearly zero-energy loft room, it was concluded that dynamic shading could mainly improve comfort by 10–15%. Many studies have been published on building envelopes; however, there has been a relative lack of published research on the use of kinetic façades in the UAE. Nevertheless, one notable project in Abu Dhabi entitled “In Al Bahar Tower” explored how origami-inspired structures obey kinematics in a manner similar to that of traditional paper-based origami, yet are also fundamentally different in that they are typically not made of a continuous piece of material. Moreover, their relatively low rigidity has limited their widespread use as structural elements (Suk Citation2019).
3. Methodology
The process of designing a kinetic façade requires a high level of technology and a significant amount of time, including considerations regarding the design of the external movable shading device, its operating type, the real-time control of the shading elements, a review of the construction of the shading device, the structural stability of the shading device, and the energy performance. Simplicity and the application of an intelligent behavioural system is key to a successful and effective kinetic facade. Making the right decisions and choosing the right techniques are therefore essential in developing kinetic façades that serve the design objective (Kamil and Flora Citation2012) . By comparing the base case building as it is to a kinetic façade system, the study aims to determine which is more energy efficient and has greater visual comfort. The independent variable is the cause. Its value is independent of other variables in this project. Whereas, the dependent variable is the effect. Its value depends on changes in the independent variable. illustrates the dependent and independent variable in this research.
Table 1. Research Variables.
3.1. Research approach
A real office building construction was chosen as a baseline for this research 25°15′47″N 55°17′50″E. A site visit was conducted to collect the required data, including data in relation to various sorts of façade, building elements, architectural drawings, habitation arrangements, and the energy utilization profile, values obtained for the building construction materials, glass properties, HVAC equipment, and magnitudes and schedules for occupancy, internal loads and temperature set points. This study will focus on the mechanical kinetic modification method. In the first stage, the base case was modelled and simulated. The simulation comprised a single workplace area within a standard glass-façade business building. In the second stage, a kinetic louver system was proposed (see ). For the base case and the kinetic louvers, a simulation was carried out on three selected 9-hour working days during the year: the 15th January, the 15th March, and the 15th August. These span all four seasons as autumn and spring are considered the same in terms of sun path and latitude. Simulations were conducted at three-hour intervals for each of the above-mentioned days, demonstrating the day by day functionality of each case. In every simulation, three directions were studied: south, east, and west. The suggested simulation technique is a parametric algorithm created by coordinating various forms of advanced simulation software including Rhinoceros, Grasshopper, and DIVA-for-Rhino. The specific goal was to study the performance of the kinetic envelope in offering visual comfort and in terms of decreasing the level of energy utilization. The simulation involved building the model using Rhino/Grasshopper software and then simulating illuminance ratios and registering the output information retrieved from DIVA-for-Rhino. Simulating the kinetic louvers involved using the same model in Rhino/Grasshopper, running DIVA for different kinetic façade arrangements to determine which was ideal, and then recording the outcomes in terms of illuminance and energy annual consumption. Three results were produced: (1) illuminance in lux; (2) luminance in cd/m2 and (3) the energy consumption (overall building performance including the HVAC and lighting) when outcomes were schemed for all cases. Workplane illuminance was also discussed in the paper.
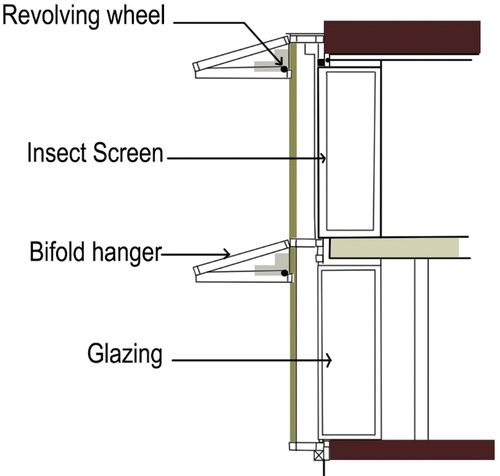
Figure 2. Details of a dynamic window (Source: Author).
3.2. Validation of the DIVA-for-Rhino software
Verification and validation are the process of checking that a piece of software meets the specifications, and that it fulfils its intended purpose. Many authors have adopted the real measurements technique with specific instruments such as is the case with this study (Bilbao et al. Citation2014) where the authors compared the measurements of solar irradiance and atmospheric compounds using the software package “MATLAB Corrcoef”. To validate the DIVA-for-Rhino software, real measurements were taken on site on the 15th August for the lux level and temperature, and compared with the predicted readings of DIVA-for-Rhino. The authors were required to obtain permission in order to conduct the measurements. The device used was an Extech instrument entitled ‘CO240 for Outdoors. This device measured the exact temperature and relative humidity at the case study location. For the lux value, the authors used Extech 45,170 on the fifth floor, just adjacent to the window glazing at 12:00 noon on 2 May 2018 (See ) for the locations of the indoor and outdoor test that was relevant to the case study. All readings were collected at 12:00 noon for the whole year, from March 2018 until March 2019. The monthly average was calculated for temperature, relative humidity and lux values. All readings were later compared to the readings generated by the DIVA-for-Rhino software. illustrates the comparison between the actual measurements and those of the DIVA-for-Rhino software in terms of temperature (For the year of 2018). The highest discrepancy was found in the month of December, while other months showed minimal differences. By having another look at the month of September, obviously, the temperature on site shows 46 °C whereas it was 45 °C in the simulation tool. It could be argued here that the simulation takes the average of 5–6 years which is why it is 1°C less. Having a look at in May, the relative humidity (RH), which is the amount of water vapour present in the air expressed as a percentage of the amount needed for saturation at the same temperature, the onsite measurement showed 48.7% whereas the simulation suggests it was 48%. The link between the previous temperature onsite might explain the discrepancy, with the one oC increasing the RH by enhancing the evaporation. shows the discrepancy analysis of the illuminance reading. The actual illuminance on site reading in March was 790 lux, where it is 38 lux less in the software. By observing the office, the authors noticed an internal vertical blind on the glazing but one which was not used at all, and was gathered on the sides. It is believed that it partially reduced the lux. presents the discrepancy analysis of the cooling load per year. It is important to note that one neutral zone on the north side was then specified, and information retrieved from Diva-For-Rhino to calculate the cooling load, and to compare this to real utility bills. The actual utility bills were obtained directly from the owner who shared the Dubai Electricity and Water Agency DEWA bill of one year from January 2018 till December 2018 for the whole of the 2nd floor. Notably, the highest discrepancy was found in the month of June, with the over-dependence on the HVAC system being the main reason. By having informal interviews with the employees, it turned out that they bought 5 extra air-conditioning indoor units which they placed next to their desks. The overall discrepancy between the actual measurements and the software suggest that the software is reliable, that there were fewer errors than expected, and that it will provide accurate results. On the other hand, this paper attempted to take the measurement for the whole month and the average was calculated then compared against the software. The overall discrepancy between the actual measurements and the software suggest that the software is reliable, that there were fewer errors than expected, and that it will provide accurate results. All contain tables of the actual measurements and the predicted data of the software as well as the differences, the dotted line between the columns represents average trendline which evens out fluctuations in data to show a pattern or trend more clearly. All contain tables of the actual measurements and the predicted data of the software as well as the differences, the dotted line between the columns represents average trendline which evens out fluctuations in data to show a pattern or trend more clearly. illustrates the actual cooling load and not average, however, the discrepancy indicates that the software is accurate and will predict the results accurately. The weather input of the software was used for this simulation.
Figure 3. The location of the indoor and outdoor measurements with regard to the case study building.
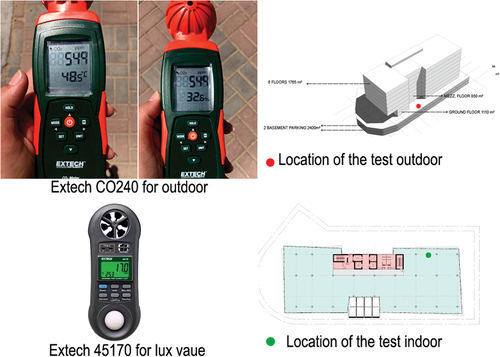
Figure 4. Discrepancy analysis of temperature (oC) between actual measurements and DIVA-for-Rhino.
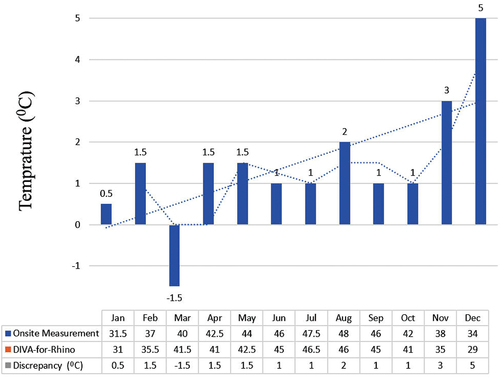
Figure 5. Discrepancy analysis of relative humidity (%) between actual measurements and DIVA-for-Rhino.
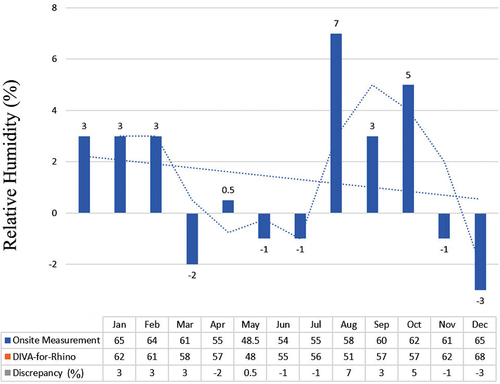
Figure 6. Discrepancy analysis of illuminance (lux) between actual measurements and DIVA-for-Rhino.
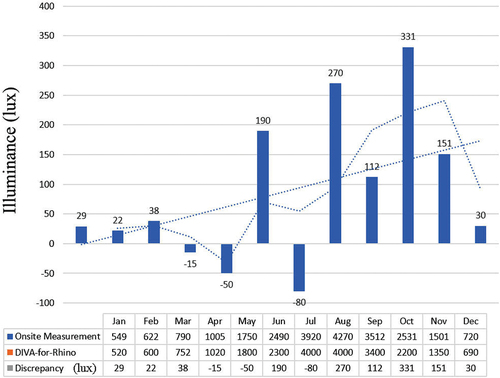
Figure 7. Discrepancy analysis of cooling load (kWh) between actual measurements and DIVA-for-Rhino.
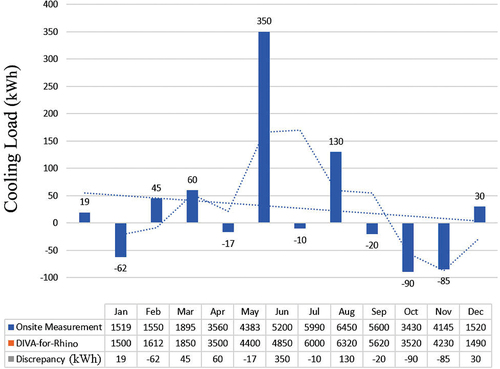
Figure 8. Kinetic Façade modelling for 90, 75, 60, 45, 30, and 15-degree folding.
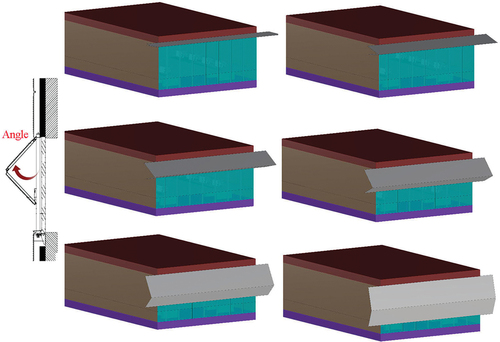
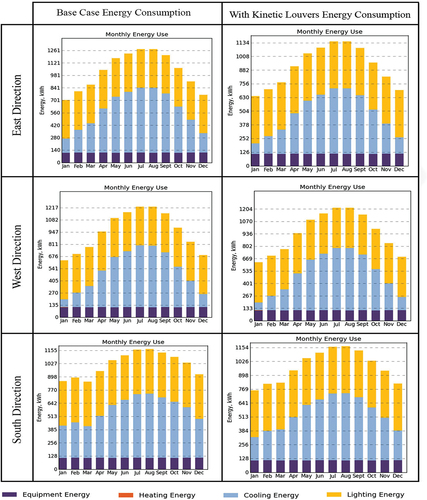
Figure 9. Annual Energy Consumption before and after application of the kinetic louver system.
3.3. Mathematical set-up
3.3.1. Unified glare rating
It is important to note that glare occurs solely when the eye is exposed to the luminous element of a luminaire. When this occurs, the amplitude of the glare can range from barely noticeable to extremely discomforting and can be quantified by the Unified Glare Rating or UGR which has the following equation:
L b = Background luminance in cd/m2, calculated from Eind/π with Eind as the vertical indirect illumination at the observer’s eye.
L = the sum of light luminance, in cd/m2 of the light-emitting surface of each light in the direction of the observer’s eye.
ω = the sum of the solid angle from the viewer’s line of sight.
p = the Guth/ position index depending on their spatial deviation from the main line of sight.
The UGR values are in the range of 10 (“no glare”) to 30 (“unacceptable discomfort glare”). The larger the UGR value, the greater the probability of glare. These limits are assigned to specific activities and space functions, and must not be exceeded (evo.support Citation2017).
The UGR was manually calculated for the zone, and the average for the base case UGR was ≥29.5, which indicated high visual discomfort. For this study glare was calculated for a single orientation at a single position. The following section will present the lux performance after a kinetic façade system was integrated that responded to the path of the sun.
3.3.2. Light level or illuminance
Illuminance is the total luminous flux incident on a surface per unit area. The area – the work plane – is where the most important tasks in the room or space are performed.
Illuminance can be expressed as
where
E = illuminance (lm/m2, lux)
Φ = luminous flux – the quantity of light emitted by a light source (lumen, lm)
A = area (m2)
According EN 12464 light and lighting (CIBSE Citation2017) – lighting of workplaces -indoor work places, the minimum illuminance is 50 lux for walls and 30 lux for ceilings. Earlier it was common to have light levels in the range 100–300 lux for normal activities. Today the light level is more commonly found in the range 500–1000 lux – depending on the activity. For precision and detailed work, the light level may even approach 1500–2000 lux.
Case study
The office building is located on Sheikh Zayed road in Dubai. The principal façade of the building faces in a westerly direction towards Seaview (West Direction). Within the building there is a ground floor with a mezzanine and 6 typical floors with a plot area of approximately 3674 square meters. The building is typical of the design for an 8-story office building of similar height. The research focuses on a single module located on one floor. The floor covers an area of 1765 square meters in which a closed office of 7.7 m x 11.9 m dimensions is located. The office room is covered with a glazing curtain wall with no shading system being implemented. The height of the floor is 3.5 m from slab to slab.
3.4. Modelling
The design factors and characteristics of the base model were assigned and defined as follows: infiltration of air per hour was 0.5. The occupancy level for the office was 10 m2/occupant, the minimum level of light was 300 lux, and the indoor temperature was fixed at 23 °C. The prototype office room modelled for a volume of 7.7 m x 11.9 m x 3.5 m was located within the three sides of the building as mentioned above. Hence, the simulation was systematically generated for the three facades. The nine working hours from Sunday to Thursday were 8:00am to 6:00pm. The louver configuration began at an angle of 90° and was then reduced to angles of 75°, 60°, 45°, 30°, 15° and 0° (the latter is full shading, meaning full obscurity). summarizes the details for all scenarios.
4. Results and findings
4.1. Base Case lux Performance
In terms of the east side at 9:00 am in the morning for all seasons, the performance of the zone shows a high value of 420 lux due to the sunrise (). It is important to note that solar radiation in the UAE is significant, and a total of 3568 average annual solar hours corresponds to an average annual solar radiation of approximately 2285 kWh/m2. At 1:00 pm the illuminance typically began to spread, and at 5:00 pm the light illuminated the zone more dimly during all seasons. Conversely, on the west side () the lux value gradually increased, reaching as high as 400 lux. The highest values were recorded in January at 5:00 pm due to the lower position of the sun in the sky which extended the light inside the zone. For the south side (), there was a relatively improved uniformity ratio inside the zone, where the highest contrasts being on 15th January at 9:00 am and 15th August at 5:00 pm.
Table 2. Base Case “lux” Performance – East Direction.
Table 3. Base Case “lux” Performance – West Direction.
Table 4. Base Case “lux” Performance – South Direction.
A comparison of shows that the East and West side at 9:00 am has much greater exposure to the sun as it is 24% higher than in the west (where is almost 0% in January). In the same month, large differences were also evident at 5:00 pm. For instance, the lux level dropped by 2% at 5:00 pm, whereas in the west the percentage jumps to 76%.
4.2. Kinetic façade with different louver inclinations
The results indicate that the excess light decreased dramatically, which reduced thermal gain and thus the dependence on air-conditioning in the office. Regarding lux performance, shows that the configuration used to reduce the illuminance level over 2000 lux was 45 degrees (see again). With this configuration, the illuminance level over 2000 lux was reduced from 26% to 11%. Although this can be reduced further to 5% with a 90-degree louvre configuration, this may not be ideal due to the reduction of sunlight and the subsequent increase in the need for artificial light, which increases the demand for power. In the west direction (), the kinetic façade initially worked strongly and clearly during the afternoon. The proportion of spaces covered by an illuminance level over 2000 lux fell from 64% to 16%. This could be reduced to zero percent with an angular configuration of 15 degrees; however, natural light is recommended to minimise power consumption. In the south direction (), the kinetic façade had only a slight impact, as less than 10% of spaces were covered by an illuminance level of more than 2000 lux. For the south side during January, the louvre angle was maintained at 60 to 45 degrees throughout the day. Because the best practice for (Suk Citation2019) workplace offices should be an average level within 200 lux, the kinetic façade therefore moderated the lux level while reducing the glare. Furthermore, an average UGR < 10 (Mushtaha et al. Citation2022) represents an improved reading compared to the base case (See ).
Table 5. Kinetic Louver “lux” Performance – East Direction.
Table 6. Kinetic Louver “lux” Performance – West Direction.
Table 7. Kinetic Louver “lux” Performance – South Direction.
Table 8. Comparison of Luminance between Base Case and Kinetic Louvers.
Table 9. Workplane illuminance level of office zone in the Base Case (static shading at 90°) on South Façade on 15th August without artificial lighting.
Table 10. Workplane illuminance level of office zone in the Base Case (static shading at 90°) on South Façade on 15th August with artificial lighting.
Table 11. Workplane illuminance level of the office zone with kinetic folding on South Façade on 15th August without artificial lighting.
4.3. Comparison of luminous intensity between base case and kinetic louvers
Luminance is a photometric measure of the luminous intensity per unit area of light travelling in a given direction. It describes the amount of light that passes through, is emitted, or is reflected from, a particular area, and falls within a given solid angle. Selected for this purpose are the lux performance on 15th August at 9:00 am from the east direction, 15th March at 5:00 pm from a west direction, and 15th January at 1:00 pm from a south direction. presents the results in terms of luminous intensity performance with the cd/m2 units. Based on the , the luminance value reduced especially at 9:00 am and 1:00 pm, this minimised the variation which indicates low contrast and helped to achieved uniformity ratio of light distribution which also indicates better visual comfort. Studies (Suk Citation2019) stated that for the background lighting on the walls the maximum luminance should be limited to 1000 cd/m2 a luminance on the ceiling of 250–500 lux is perceived as comfortable, this means the kinetic case is much better than the base case.
Table 12. Workplane illuminance level of the office zone with kinetic folding) on South Façade on 15th August with artificial lighting.
4.4. Comparison of workplane illuminance
Workplane is defined as a horizontal plane located at the nominal working height in an interior space. Daylight factors and illuminance measurements and calculations are made for points on this plane in order to provide visual comfort for the workers. The height of the workplane (desk) is 0.85 m in the base case, which matches European standards. The first scenario was test the workplane in the base case with static horizontal shading at an angle of 90° without artificial lighting (See ). The second scenario was to test the workplane in the base case with static horizontal shading at an angle of 90° with artificial lighting (See ). The third scenario was to test the work plane with kinetic shading at different angles without artificial lighting (See ). The fourth scenario was with kinetic shading at different angles with artificial lighting (See ). Other angels represent the angles of the kinetic movement. They were manually introduced in the simulation each case will represent the performance of angel specified. The highest mean workplane illuminance was recorded at an angle of 90° at 12:00 pm in the second scenario and fourth with a reading of 876 lux and 853 lux at 1:00 pm 15 August 2018. These readings indicate that artificial lighting is not needed as it might cause glare. Another point worth noticing was that the kinetic shading helped to moderate the high fluctuations.
The base case () shows that at 9:00 am in an east direction, the intensity reached 1900 cd/m2, which was reduced by 45% using kinetic louvers (same table). The uniformity ratio was weak due to the high contrast. The discrepancy was more significant in the west direction where 1900 cd/m2 luminance occupying 50% of the whole zone fell dramatically with the kinetic louvers providing luminance between 100–300 cd/m2. The glazing of the south direction in the base case offered a brightness of 700–900 cd/m2 with the kinetic louvers. Typical brightness ratings ranged from 250 to 350 cd/m2 for monitors that performed general-purpose tasks. This was especially obvious in the south direction at 5:00 pm with the kinetic louvers.
5. Discussion
indicates that the main factor affecting the overall energy used is the cooling energy in UAE. One zone was taken from East, West and South directions. The Energy consumption was calculated before and after applying the kinetic shading. The total energy consumption of base case of East zone was 12,361 kWh. The total energy consumption of base case of West zone was 11,430 kWh and finally the energy consumption of base case of South zone was 11,315 kWh. After apply the kinetic shading, the total energy consumption of kinetic case of East zone was 10,867 kWh which means that kinetic shading helped to reduce the energy by 12%. The total energy consumption of kinetic case of West zone was 11,039 kWh which means that kinetic shading helped to reduce the energy by 3.5%. Lastly, the total energy consumption of kinetic case of South zone was 10,664 kWh which means that kinetic shading helped to reduce the energy by 5.8%. These results indicated that the East and probably the South elevations have a priority of implementing the kinetic shading. Whereas, the West has the least priority due to low benefits. The overall total reduction in annual cooling energy from the base case of the three zones could reach to 21.3 %. The kinetic shading did not contribute that much to lower the equipment energy at all in South direction, but it lowered the equipment energy by 10% in East direction and by 1.5% than the base case. In the next section, a reflection of the work done will be demonstrated. Back to section 2.3, a study (Nielsen, Svendsen, and Jensen Citation2011) that managed to lower the energy consumption by 13%, this study managed to do better reduction by 8.3%. However, the study of the Abu Dhabi case (Kamil and Flora Citation2012) where they lowered the energy demand in West direction by 25.2%, this study couldn’t reach this reduction. This might due to the height of the two case buildings, the Abu Dhabi case is high rise building where this study is only G + 7. This indicates that the kinetic shading potential increase with the increase of the building height.
6. Conclusion
Many new genres of kinematic architecture are now emerging. This paper has investigated the potential for energy reduction and improvement in luminance performance for an office building in Dubai in the UAE. The outcomes of the simulations demonstrated the functionality and efficiency of the kinetic façade when compared to other scenarios. This research was based on the natural light demand scaled by the illuminance level inside the room, and the heat gain generated by natural light exceeding 2000 lux, which will have a considerable impact on the annual cooling energy transfer. By observing the energy consumption due to cooling transfer, it was found that an annual reduction of 12% occurred on the east side. In addition, Kinetic louvers achieved 100 – 300 lux and a brightness level of 250 to 350 cd/m2. Hence, it can be concluded that the horizontal kinetic façade plays an important role when implemented on the East side of the building. However, this assumption will only be validated after studying other factors or parameters that may affect the efficiency of the device. For the west side, the kinetic façade is very functional, as it dramatically reduces the spaces covered by over 2000 lux, from around 70% to 10%. However, the office space will need an excessive amount of artificial light to maintain a level of comfort adequate for office activities except for noon time as it gets up to 876 lux which is considered too lit and might cause a glare. It is therefore concluded that kinetic louvers can help to achieve light levels in the range of 100 to 300 lux, and a brightness level ranging from 250 to 350 cd/m2. Moreover, the total energy can be decreased by 21.3% and the Unified Glare Rating (UGR) can be made to fall from 29.5 to below 10. The limitation of this study is focusing on one type of building with specific region. It is recommended as future research to include different type of building with different climatic contexts and regions. Vertical shading is also future research recommendation.
Disclosure statement
No potential conflict of interest was reported by the author(s).
Additional information
Notes on contributors
Hanan M. Taleb
Hanan M. Taleb is a professor in Sustainable Design of Built Enviroment at the British University in Dubai, UAE. Her reserch interest includes passive design, sustainable urban deign and building evelope design.
Rudy Moarbes
Rudy Moarbes has Masters of sustainable Design of built enviroment, faculty of Engineering at the British University in Dubai, his reserch interest is Facade systems.
References
- Aksamija, A. 2013. Sustainable Facades. Design Methods for high-performance Building Envelopes. Bognor Regis: John Wiley & Sons .
- Attia, S. 2016. “Evaluation of Adaptive Facades: The Case Study of Al Bahr Towers in the Uae.” QScience Proceedings 2016 (3): 8.
- Barozzi, M., J. Lienhaard, A. Zanelli, and C. Monticelli. 2016. “The Sustainability of Adaptive Envelopes: Developments of Kinetic Architecture.” Procedia Engineering 155: 275–284. doi:10.1016/j.proeng.2016.08.029.
- Barozzil, M., J. Lienhard, A. Zanelli, and C. Monticelli. 2016. “The Sustainability of Adaptive Envelopes: Developments of Kinetic Architecture.” Conference paper at International Symposium on “Novel Structural Skins: Improving sustainability and efficiency through new structural textile materials and designs”, Procedia Engineering 155 Newcastle upon Tyne, UK, 275–284.
- Ben Bacha, C., and F. Bourbia (Oct, 2016). “Effect of Kinetic Facades on Energy Efficiency in Office buildings-hot Dry Climates.” Conference paper 11th Conference on Advanced Building Skins 10-11, Bern, Switzerland, pp.458 468.
- Bilbao, J., R. Roberto, C. Yousif, D. Mateos, and A. de Miguel. 2014. “Total Ozone Column, Water Vapour and Aerosol Effects on Erythemal and Global Solar Irradiance in Marsaxlokk, Malta.” Atmospheric Environment 99: 508–518. doi:10.1016/j.atmosenv.2014.10.005.
- Blaifi, S.-A., S. Moulahoum, B. Taghezouit, and A. Saim. 2019. “An Enhanced Dynamic Modeling of Pv Module Using Levenberg-Marquardt Algorithm.” Renewable Energy 135: 745–760. doi:10.1016/j.renene.2018.12.054.
- Casini, M. 2018. “Active Dynamic Windows for Buildings: A Review.” Renewable Energy 119: 923–934.
- Choi, S. J., D. S. Lee, and J. H. Jo. 2017. “Method of Deriving Shaded Fraction according to Shading Movements of Kinetic Façade.” Sustainability Open Access 9 (8): 1449.
- CIBSE. 2017. “EN 12464 Light and Lighting.” Accessed 20 March 2019. https://www.cibse.org/getmedia/3b3cba92-f3cc-4477…/EN12464-2011.pdf
- Colaco, S. G., C. P. Kurian, V. I. George, and A. M. Colaco. 2008. “Prospective Techniques of Effective Daylight Harvesting in Commercial Buildings by Employing Window Glazing, Dynamic Shading Devices and Dimming Control—a Literature Review.” Building Simulation: An International Journal 1 (4): 279–289. doi:10.1007/s12273-008-8126-8.
- DEWA (Dubai Electricity and Water authority). 2017. “Electricity Consumption by Sector.” Accessed 1 November 2018. https://www.dewa.gov.ae
- evo.support. 2017. “UGR Calculation.” Accessed 29 March 2019. https://evo.support-en.dial.de/support/solutions/articles/9000116115-ugr
- Formentini, M., and S. Lenci. 2018. “An Innovative Building Envelope (Kinetic Façade) with Shape Memory Alloys Used as Actuators and Sensors.” Automation in Construction 85: 220–231. doi:10.1016/j.autcon.2017.10.006.
- Fortmeyer, R., and C. Linn. 2014. Kinetic Architecture: Designs for Active Envelopes. Victoria: Images Publishing Dist Ac publisher.
- Freewan, A. A. Y. 2014. “Impact of External Shading Devices on Thermal and Daylighting Performance of Offices in Hot Climate Regions.” Solar Energy 102: 14–30. doi:10.1016/j.solener.2014.01.009.
- Jayathissa, P., M. Luzzatto, J. Schmidli, J. Hofer, Z. Nagy, and A. Schlueter. 2017. “Optimising Building Net Energy Demand with Dynamic BIPV Shading.” Applied Energy 202: 726–735. doi:10.1016/j.apenergy.2017.05.083.
- Jones, P., S. S. Hou, and X. Li. 2015. “Towards Zero Carbon Design in Offices: Integrating Smart Facades, Ventilation, and Surface Heating and Cooling.” Renewable Energy 73: 69–76. doi:10.1016/j.renene.2014.06.027.
- Kamil, S., and S. Flora September 2012. “Design Considerations for Adopting Kinetic Facades in Building Practice.” Proceedings of the 30th eCAADe Conference 2 pp. 629–637, Prague, Czech Republic.
- Kensek, K., and R. Hansanuwat. 2011. “Environment Control Systems for Sustainable Design: A Methodology for Testing, Simulating and Comparing Kinetic Facade Systems.” Journal of Creative Sustainable Architecture & Built Environment, CSABE 1: 27–46.
- Kim, K., and C. Jarrett. 2011. “Energy Performance of an Adaptive Façade System.” In Presentation at ARCC 2011, an Architectural Research Centers Consortium, 20–23. Detroit, MI, USA: Thomas-Bernard Kenniff.
- Konstantoglou, M., and A. Tsangrassoulis. 2016. “Dynamic Operation of Daylighting and Shading Systems: A Literature Review.” Renewable and Sustainable Energy Reviews 60: 268–283. doi:10.1016/j.rser.2015.12.246.
- Konstantzos, I., A. Tzempelikos, and Y.-C. Chan. 2015. “Experimental and Simulation Analysis of Daylight Glare Probability in Offices with Dynamic Window Shades.” Building and Environment 87: 244–254. doi:10.1016/j.buildenv.2015.02.007.
- Li, D. H. W., and J. C. Lam. 2001. “Evaluation of Lighting Performance in Office Buildings with Daylighting Controls.” Energy and Buildings 33 (8): 793–803. doi:10.1016/S0378-7788(01)00067-6.
- Mahmoud, A. H. A., and Y. Elghazi. 2016. “Parametric-based Designs for Kinetic Facades to Optimize Daylight Performance: Comparing Rotation and Translation Kinetic Motion for Hexagonal Facade Patterns.” Solar Energy 126: 111–127. doi:10.1016/j.solener.2015.12.039.
- Mawada, A., and A. Ahmed. 2015. “Review of Sustainability in Buildings.” Sustainable Cities and Society 14: 171–177. doi:10.1016/j.scs.2014.09.002.
- Mostafa, M. S., A. K. A. Ahmed, B. Mahmoud, and K. M. Essam. 2016. “The Thermal Performance of Residential Building Integrated with Adaptive Kinetic Shading System.” International Energy Journal 16: 97–106.
- Mushtaha, E., A. A. Hussien, M. Arar, S. A. Salleh, A. Mohammad, W. Masoud, Z. Ahmed, and H. Amubyedhm. 2022. “Artificial Lighting Systems and the Perception of Safety in Underpass Tunnels.” Tunnelling and Underground Space Technology 122 (104376): 104376. doi:10.1016/j.tust.2022.104376.
- Nielsen, M. V., S. Svendsen, and L. B. Jensen. 2011. “Quantifying the Potential of Automated Dynamic Solar Shading in Office Buildings through Integrated Simulations of Energy and Daylight.” Solar Energy 85 (5): 757. doi:10.1016/j.solener.2011.01.010.
- Sharaidin, K., J. Burry, and F. Salim. 2012. “Integration of Digital Simulation Tools with Parametric Designs to Evaluate Kinetic Façades for Daylight Performance.” Simulation, Prediction, and Evaluation 2: 691–700.
- Skarning, G. C. J., C. A. Hviid, and S. Svendsen. 2017. “The Effect of Dynamic Solar Shading on Energy, Daylighting and Thermal Comfort in a Nearly Zero-Energy Loft Room in Rome and Copenhagen.” Energy & Buildings 135: 302–311. doi:10.1016/j.enbuild.2016.11.053.
- Suk, J. Y. 2019. “Luminance and Vertical Eye Illuminance Thresholds for Occupants’ Visual Comfort in Daylit Office Environments.” Building and Environment 148: 107–115. doi:10.1016/j.buildenv.2018.10.058.
- Yun, G., K. C. Yoon, and K. S. Kim. 2014. “The Influence of Shading Control Strategies on the Visual Comfort and Energy Demand of Office Buildings.” Energy & Buildings 84: 70–85. doi:10.1016/j.enbuild.2014.07.040.
- Zhai, Y., Y. Wang, Y. Huang, and X. Meng. 2019. “A Multi-Objective Optimization Methodology for Window Design considering Energy Consumption, Thermal Environment and Visual Performance.” Renewable Energy 134: 1190–1199. doi:10.1016/j.renene.2018.09.024.