
 ?Mathematical formulae have been encoded as MathML and are displayed in this HTML version using MathJax in order to improve their display. Uncheck the box to turn MathJax off. This feature requires Javascript. Click on a formula to zoom.
ABSTRACT
Conventional cast-in-place frames using a pair of steel plates are replaced by a post-tensioned H-shaped precast frame with mechanical joints in which plates are used to transfer loads between them. The mechanical joints strengthened by interior bolts are used, providing a flexural capacity of columns to a level similar to that of conventional monolithic connections. In the present study, strain evolutions of the proposed frames are explored using a finite element analysis with a concrete plasticity model (CP) applying a 0% damage index representing undamaged concrete for the first floor and a concrete damaged plasticity model (CDP) model implementing 80% damage index for the second floor when using ABAQUS. FEA-based strain evolutions are, then, verified by experimental results obtained from full-scale tests, showing agreements except for places where gauges malfunctioned. This study identifies structural behaviors and contributions of each structural element of the mechanical joint to flexural capacity. Microscopic strain evolutions of the post-tensioned H-shaped precast frames with mechanical joints agreed with the test data. Both experimental and numerical investigations demonstrate the structural performance of the proposed prestressed frames with mechanical joints is predictable and stable under service loads.
GRAPHICAL ABSTRACT
1. Introduction
Precast (PC) concrete is widely used for various structures in civil, residential, and industrial fields since it provides rapid, high-quality, and convenient constructions. Prestressed (PT) concrete is an excellent solution for long-span structures, significantly reducing cracks and deflections. Applying PT, thus, provides smaller section sizes compared with ordinary reinforced concrete (RC). PC constructions can benefit from PT because members are lighter, enhancing speeds and efficiencies of transportation and erections. However, connecting PT members is much more complicated than RC components. This difficulty in joining members leads to numerous studies. For example, (Wang et al. Citation2018; Wang, Marino, and Pan Citation2019) conducted experiments of a novel beam-to-column joint using steel jackets and steel angles for PC frames with PT beams, resulting in good strength and ductility. In 2021, (Li et al. Citation2021) compared behaviors of cast-in-place frames and PC frames with a grouted beam-to-column junction. Tests indicated that the two specimens had similar vertical resistances, but the ductility of PC frames was lower. Similarly, satisfactory resistances were reported for PC frames using grouted beam-to-column connections by in (Li et al. Citation2022), mild-press joints by in (Nakano et al. Citation2004), ductile connections by in (Pampanin et al. Citation2006), post-pouring joints by in (Yan et al. Citation2018), and bolted connections by in (Song et al. Citation2015). In 2016, Maurizio and Lorenzo conducted a full-scale experiment on PC columns in (Orlando and Piscitelli Citation2018), exploring the behaviors of flanged union joints. Results indicated good strengths and stiffness of the investigated joints. Mechanical joints for columns similar to those used in the present study were extensively investigated for RC and composite structures in the study of (Nzabonimpa, Hong, and Kim Citation2017a; Nzabonimpa and Hong Citation2018), and (Nzabonimpa, Hong, and Kim Citation2017b). A novel mechanical connection for PC members was proposed in (Nzabonimpa, Hong, and Kim Citation2017a) by J. D. Nzabonimpa, Won‐Kee Hong, and Jisoon Kim, developing a faster and more economical solution for beam-to-column and column-to-column joints using laminated metal plates. In 2018, (Nzabonimpa and Hong Citation2018) investigated the performances of detachable joints using metal plates connecting PC composite columns, achieving optimal designs. In 2017, (Nzabonimpa, Hong, and Kim Citation2017b) conducted a nonlinear FEA analysis of novel mechanical beam-column joints, resulting in a good match between analytical and experimental results, which indicated the accuracy of FEA models.
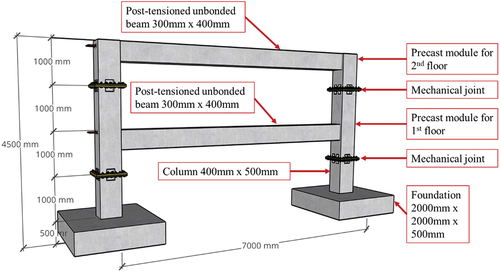
A significant number of papers developed beam-to-column joints for PC frames, achieving performances similar to those of monolithic frames. The present study provides a novel PC frame where unbonded PT beams and columns are cast monolithically, while columns are mechanically connected, offering easy erections. Investigations of a structure similar to one presented in this study are difficult to find in the previous literature. H-shaped frames can be rapidly erected on footings or other frames using mechanical joints between columns as shown in . In this study, strain evolutions of tendons, rebars, structural steels, and concrete are investigated experimentally and numerically, exploring behaviors of frames from the onset of cracks to failures. Results show that frame performances are predictable and stable under service loads, indicating that the proposed structure can replace conventional cast-in-place frames. The present study can be used to generate big datasets for ANN-based building designs and constructions, as shown in the books Intelligence-based Design of Reinforced Concrete Structures (Hong Citation2021) and Artificial Neural Network-based Optimized Design of Reinforced Concrete structures (CitationArtificial Neural Network-based Optimized Design of Reinforced Concrete structures).
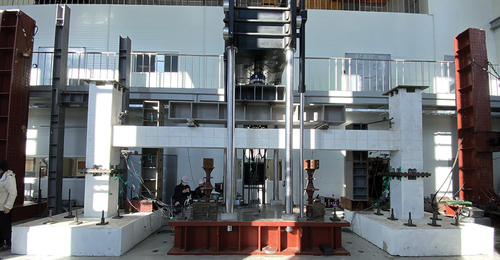
Figure 1. Full-scale PC frames with mechanical beam-to-column joint.
2. Experiment setup
shows a test setup with two point-loads; ) show test schemes for the first and second floor, respectively. It is noted that a load span (distances between concentrated loads) of 3 m for the test is recommended by (Test, Drilled, and Concrete Citation2010).
Figure 2. A test setup with two point-loads.
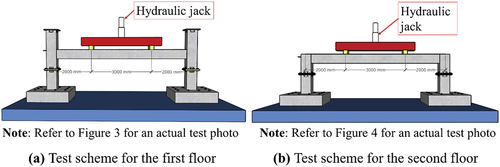
) show test setups for the first and the second floors, respectively. Members, including beams, columns, footings, and connections, are designed based on American codes namely ACI 318–19 (ACI 318, Citation2019), AISC 360–16 (Construction, A. I. of S Citation2016), AWS D1.2 (American and Standard Citation2008), AISC Design Guide 1 (Fisher Citation2006), Code of Practice for Precast Concrete Construction (Building Department Citation2016), and ASTM A193 (Torque-Tension Relationship for ASTM A193 B7 Bolts and Studs Citation2010). Tendons, rebars, and member sizes are calculated according to typical loads imposed to piperack frames, where factored loads on the first and the second floor are and
, respectively.
Figure 3. Test setup and specimen detail of the first floor.
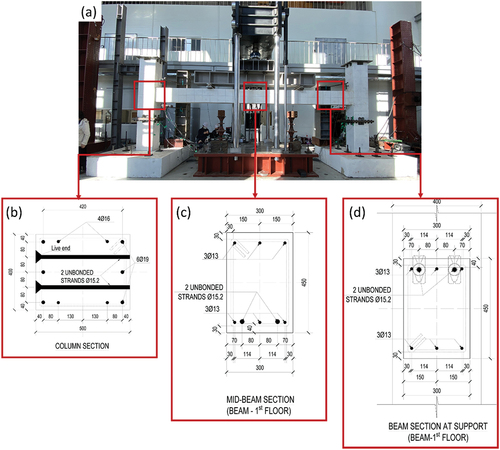
Figure 4. Test setup and specimen detail of the second floor.
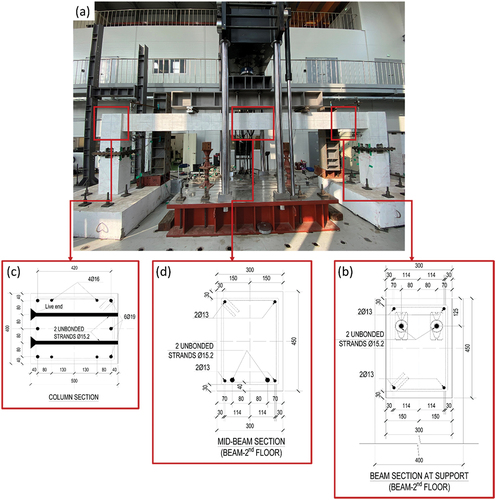
A similar design is used for columns of both frames, where section size is with
, as shown in ), respectively. Two specimens also share the same beam dimensions of
, but the first floor uses
for both top and bottom of the beam ()), while rebars of
are placed for top and bottom of the beam on the second floor ()). Two 15.2 mm unbonded tendons are placed with parabolic profiles on both frames. However, a tendon drape of
is given for the first floor, while a tendon drape for the second floor is
. A calculation based on ACI 318–19 (ACI 318, Citation2019) indicates a safety factor of 1.18 and 1.57 on the first and second floors, respectively.
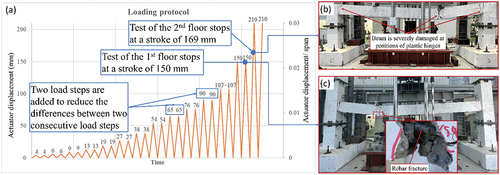
A loading protocol is established up to based on FEMA 461 (461, F Citation2007) as shown in ). During a test, each displacement is repeated twice until the specimens fail. Repeating loads at the same displacement stabilizes specimens before escalating load level. A first displacement of 4 mm is taken as 0.057% of a span according to FEMA 461 (461, F Citation2007), and in the successor series of cycles, the displacement is 1.4 times the previous series. Besides, the loading protocol is revised by adding two load steps at 65 mm and 90 mm into the loading protocol to reduce the gap between two consecutive load steps as shown in ). The experiments of the first and the second floors are finished at a stroke of 150 mm and 169 mm due to specimen fractures, as shown in ), respectively.
Figure 5. Loading protocol and specimens at failures.
3. Finite element analyses (FEA) modeling
A summary of FEA models for two frames is illustrated in , where frames are analyzed using quarter models with two symmetric planes as shown in ). ) presents mechanical joints and rebars of ABAQUS models of the test specimens. ) also denote nine locations where strains are investigated in Section 4. Essential parameters of an ABAQUS model are listed in according to the book Hybrid Composite Precast Systems: Numerical Investigation to Construction (Hong Citation2019), accuracies of these parameters are proven in studies by (Nzabonimpa and Hong Citation2018), (Nzabonimpa, Hong, and Kim Citation2017b), and (Hu, Hong, and Park Citation2017).
Figure 6. ABAQUS models (a) Quarter models in ABAQUS of the test specimens (b) Mechanical joints and rebars in ABAQUS models of the test specimens.
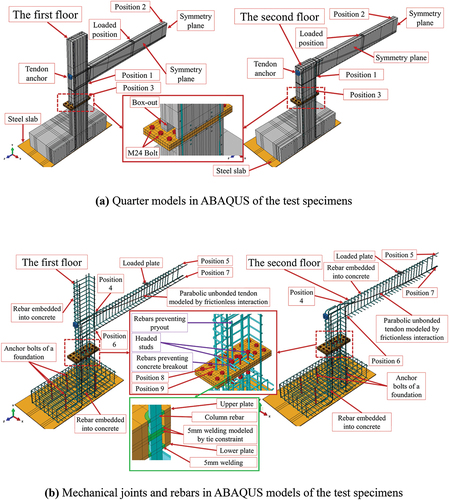
Table 1. CDP parameters.
3.1. Interaction properties and meshing principles
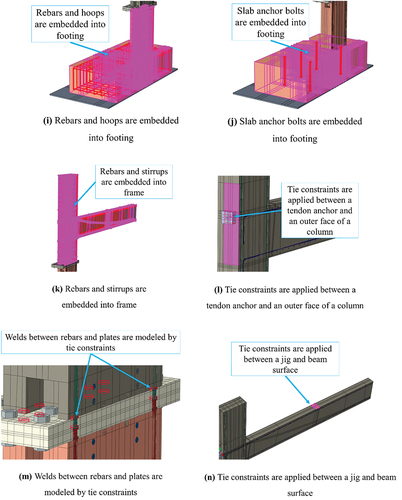
Interactions of elements in FEA models are demonstrated in . Behaviors of plate-plate contacts (), bolt-plate contacts (), concrete-plate contacts (), rebar-rebar contacts () are defined by a hard interaction property, preventing penetrations of one element to another while allowing them to separate when tensions occur. An interaction between unbonded tendons and concrete, as shown in , is defined by a hard contact in a normal direction combined with frictionless property in a tangential direction. Correlations between rebars and concrete, shown in , are modeled by embedded constraints. shows a tie constraint between a tendon anchor and an outer face of a column, preventing a tendon from shortening. Tie constraints are also applied to attach column rebars to steel plates, as shown in , and fix a loading jig to beam surfaces, as shown in .
Figure 7. Summary of interactions.
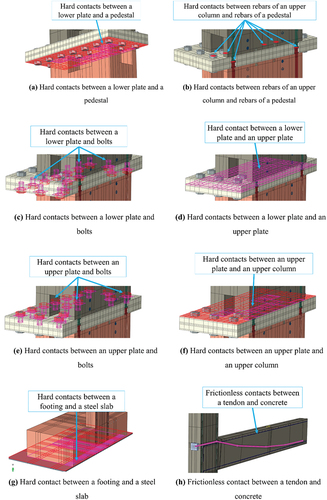
Figure 7. (continud).
A structured meshing technique is applied in the models, generating hexagonal-shaped elements. Element type C3D8 is used, defining deformed shapes of brick-shaped elements by displacements of eight nodes.
3.2. Defining materials
3.2.1. Parameters in defining CDP
3.2.1.1. Damage index
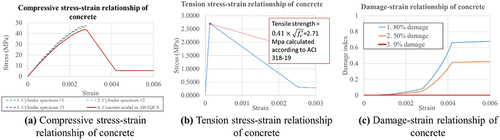
The present paper uses nonlinear material models for all elements, including concrete, rebar, stirrups, tendon, and structural steel. Concrete damaged plasticity (CDP) models shown in with different levels of damage indexes calculated by EquationEquation (1)(1)
(1) are used for the two frames. As shown in ), a damage index of 0% is adopted for the first floor, while a damage index of 80% is applied to the second floor, accounting for the strength reductions in the second floor due to initial damages in footings caused by the test of the first floor. The same footings are used for both tests of the first floor and second floor. Initial cracks affected strengths of the second floor even though footings were rotated to close cracks by placing them on a compression side. On the first floor, the ABAQUS with 0% damage index matches the test results while the ABAQUS with 80% damage index matches test results of the second floor, as shown in .
Figure 8. CDP models in ABAQUS calibrations.
Where,
Table
3.2.1.2. Angle of dilation (Hong Citation2019)
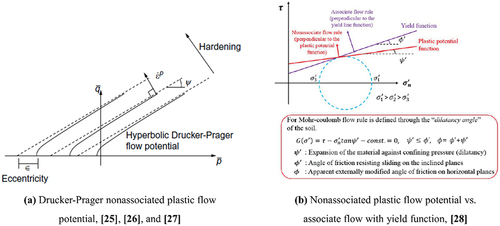
The angle of dilation, which is assumed constant during plastic yielding, controls an amount of plastic volumetric strain developed during plastic shearing. (Malm Citation2006) proposed dilation angles for a brittle behavior of concrete which can cause significant volume change, called dilatancy. The inelastic strains are caused by the plastic distortion for a brittle material. In , non-associated plastic flow potential shows a dilation angle indicating a volume change caused by a confining pressure within the material, which is used to predict a plasticization of the sections. Malm (Citation2006) found that a brittle behavior was observed for low dilation angles, while higher dilation angles close to 56° provided a ductile behavior (Malm Citation2006) based on their investigation of an influence of dilation angles on concrete damaged plasticity models in the range between 10° and 56.3°. (Malm Citation2006) found that the best fit for the numerical investigations of reinforced concrete structures was obtained using dilation angles between 30° and 40°. In the present numerical study, a dilation angle of 30° provides an acceptable match with test data as shown in .
Figure 9. Non-associated plastic flow potential, (Hong Citation2019).
3.2.1.3. Eccentricity (Hong Citation2019)
The eccentricity lets hyperbolic plastic potential functions approach an asymptote at the uniaxial tensile stress as shown in EquationEquation (2)(2)
(2) and where dilation angles increase more rapidly at the lower confining pressure when an eccentricity is large (Hong Citation2019).
Where,
Table
However, a constant curvature and a constant dilation angle are implemented over the wide range of the confining hydrostatic pressures when an eccentricity is small. When eccentricity is equal to zero, a constant dilation angle with a constant curvature is obtained over the entire range of the confining hydrostatic pressures, leading to flow potential that is independent of uniaxial tensile stress. In the present numerical study, an eccentricity of 0.1 is used as recommended by ABAQUS default value (Abaqus, Dassault Systemes, ABAQUS Analysis User’s Manual 6.14–2 Citation2014).
3.2.1.4. Ratio of second stress invariant on the tensile Meridian (Kc)
The shape of the yield surface in the three-dimensional space shown in ) is defined by the ratio (Kc) of the second stress invariant in the tensile meridian to that of the compressive meridian, which must satisfy the condition . The default value of Kc in the Abaqus analysis is 2/3 (Abaqus, Dassault Systemes, ABAQUS Analysis User’s Manual 6.14–2 Citation2014).
Figure 10. Yield surface of concrete, (Hong Citation2019).
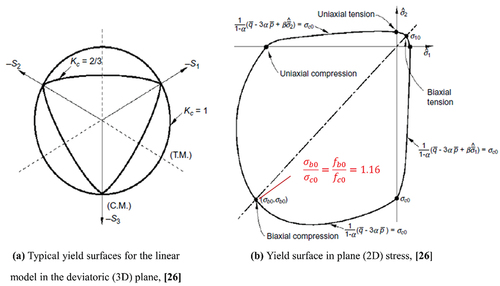
3.2.1.5. A ratio of 
The yield function in-plane stress subjected to biaxial stresses is shown in ). The ratio of indicates ratio of biaxial compressive concrete strength to uniaxial compressive strength, i.e., a ratio of the strength in the biaxial state to the strength in the uniaxial state as shown in
of ). The ratio
is kept as a default to avoid the overestimation of the structural response of the frames with mechanical joints shown in this study. The ratio of
is set to a default value of 1.16 in the numerical analyses of this study. The ratio of
decreases for higher strength because high strength concrete is less influenced by the confining effects, and hence, an increase of
ratio is related to a decrease of the flexural capacity of reinforced concrete members.
3.2.1.6. Viscosity (Hong Citation2019)
A viscoplastic strain rate tensor expressed in EquationEquation (3)(3)
(3) was originally proposed by (Duvaut and Lions Citation1972) to stabilize the concrete damaged plasticity model:
where denotes a viscosity parameter. The plastic degradation (
) and the rate of the plastic fracture decrease when a viscosity (
) increases as shown in EquationEquation (4)
(4)
(4) . The convergence of the numerical process is, thus, enhanced by increasing viscosity parameter (
) which decreases the rate of the plastic fracture as shown in EquationEquation (4)
(4)
(4) . This will help a convergence of the nonlinear analyses to be achieved when concrete elements experience numerical instabilities. The default value of viscosity (
) in the numerical analysis of this study is 0.003 (Abaqus, Dassault Systemes, ABAQUS Analysis User’s Manual 6.14–2 Citation2014), however, viscosity (
) can be increased until a convergence of the nonlinear analyses is met. The author found that viscosity (
) may influence solutions the nonlinear analyses.
3.2.2. Experimental-based constitutive relationships
show the stress-strain relationships from the sample tests (), being implemented in calibrating non-linear FEA analysis based on both a concrete plasticity model (CP model with 0% damage index) for the first floor and a CDP model with 80% damage index for the second floor using ABAQUS in the present study, demonstrating the behavior of the test frames against the loads described in Section 4 are accurately predicted by FEA. Material properties in ABAQUS calibration taken based on the sample tests are summarized in .
Figure 11. Sample tests for determining material properties.
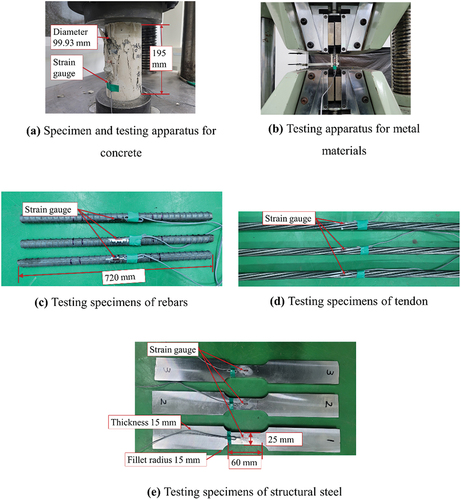
Figure 12. Material models for rebars, structural steels, and tendons in ABAQUS calibrations.
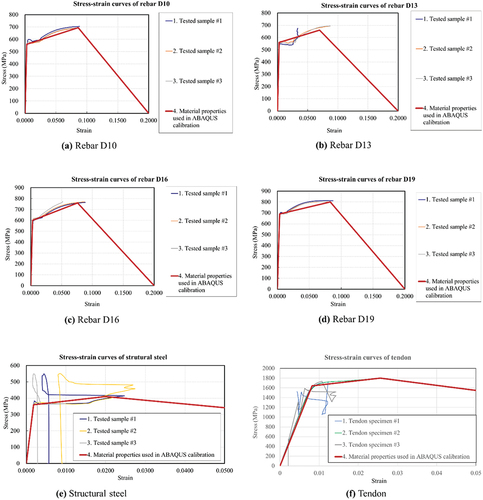
Table 2. Material properties in ABAQUS calibrations.
4. Strain evolutions
shows nine positions where strain evolutions are examined. Compressive concrete strains within from the beam end (Position 1) and at the mid-span (Position 2) are averaged, as shown in ). ) show evolutions of compressive concrete strains on the first floor, reporting maximum concrete strains of 0.0025 at beam ends and 0.0023 at mid-span. ) show evolutions of compressive concrete strains on the second floor, which stop being measured at concrete strains of 0.007 at beam ends and 0.002 at mid-span. The strain of 0.007, shown in ), is due to a malfunction of the strain gauge. Generally, strain should be developed gradually like one shown in ). Measured strains of the first floor decrease from 0.0025 at Position 1 corresponding to a mid-span deflection of L/160 due to concrete crushes at beam ends ()) and 0.0023 at Position 2 corresponding to a mid-span deflection of L/84 concrete crushes at mid-span ()). Strains of the second floor decrease from 0.007 at Position 1 corresponding to a mid-span deflection of L/125 due to concrete crushes at beam ends ()) and 0.002 at Position 2 corresponding to a mid-span deflection of L/60 due to concrete crushes at mid-span of ()). However, numerical strains calculated by ABAQUS continue to increase. Strain evolutions indicate large deformations at beam ends due to excessive rotations under heavy loads.
Figure 13. Positions of a test frame where strains are investigated.
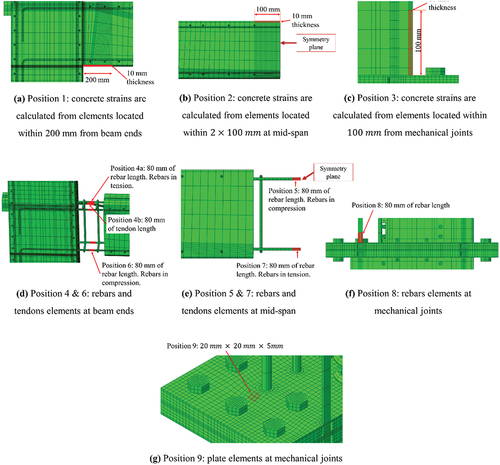
Figure 14. Averaged compressive concrete strains within 200 mm from the beam end (Position 1) as shown in ).
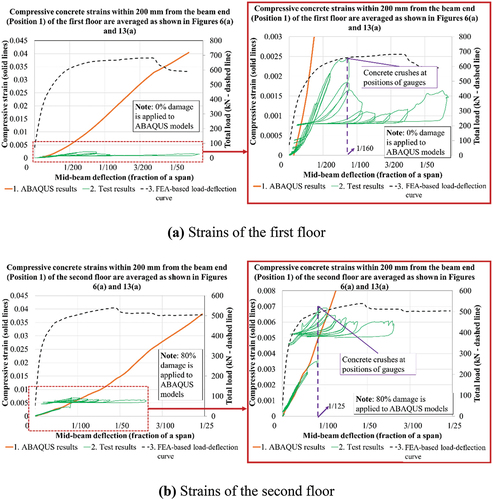
Figure 15. Averaged compressive concrete strains within 2 × 100 mm at the mid-span (Position 2) as shown in ).
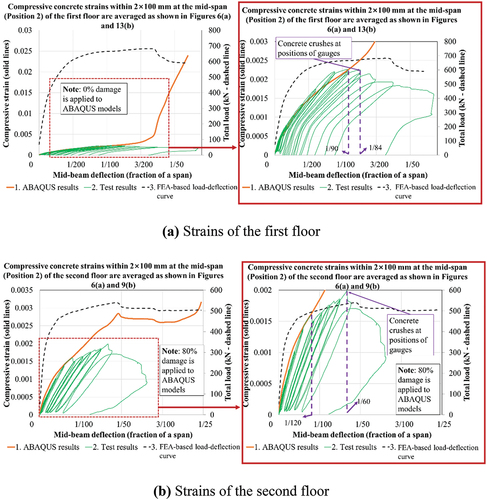
Rates of concrete strains at Position 2 (200 mm at mid-span of the first floor) over the displacements match well those obtained numerically up to a mid-span deflection of L/90 for the first floor ()) and L/120 for the second floor ()). This indicates that ABAQUS models based on FEA with a CP model of 0% damage index for the first floor and a CDP model of 80% damage index for the second floor predict frame performances of both floors as shown in load-displacement relationships shown in . Strains at mid-span are lower than those obtained at beam ends, showing that plastic hinges appear at beam ends first, and then they are developed at mid-span.
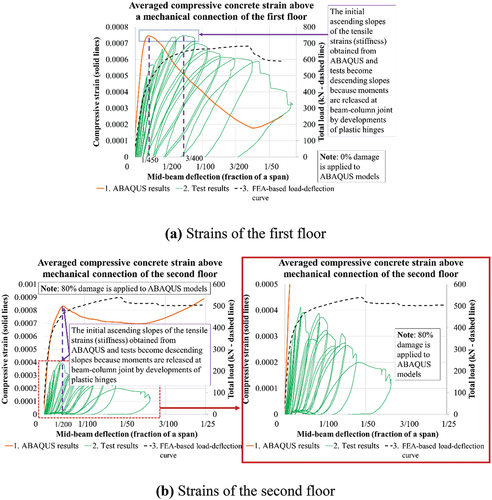
As shown in ) for the first floor, concrete compressive strains at Position 3 (above the mechanical joint) shown in ) are measured as small as 0.00075 corresponding to a mid-span deflection of 3 L/400 which matches well those calculated numerically. However, an initial stiffness from ABAQUS is higher than that that measured experimentally. Stiffness calculated numerically decreases rapidly from a mid-span deflection of L/450 whereas measured stiffness decreases gradually from a mid-span deflection of 3 L/400. This is because moments are released at a beam-column joint after plastic hinges form. ) illustrates evolutions of concrete compressive strains around mechanical joints on the second floor, where strains obtained from ABAQUS and the test start decreasing from a mid-span deflection of L/200 with strains of 0.0083 and 0.00041 at Position 3 of ), respectively because moments are released at beam-column joint due to formations of plastic hinges. Small concrete strains above a mechanical connection show that the mechanical joints are placed at a reasonable position, avoiding critical bending moments.
Figure 16. Averaged compressive concrete strain above a mechanical connection (Position 3).
show tensile strain evolutions of upper rebars at Position 4a of beam ends and lower rebars at Position 7 of mid-span, respectively, whereas show compressive strain evolutions of upper rebars at Position 5 of mid-span and lower rebars at Position 6 of beam ends, respectively. Rebar strains are normalized by the strain at yield in these plots. Tensile strains of upper rebars at a beam end (Position 4a of ) reach a ductility of around 5.5 for both floors, as tensile strains of lower rebars at mid-span (Position 7 of ) at the first and the second floor reach smaller ductility of 1.8 and 2.35, respectively.
Figure 17. Tensile strains of upper rebars at a beam end (Position 4a).
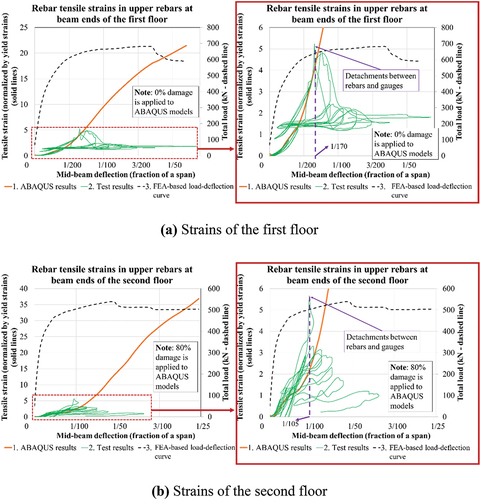
Figure 18. Compressive strains of upper rebars at a mid-span (Position 5).
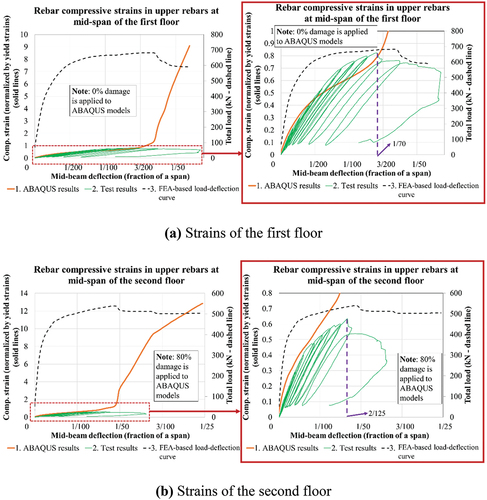
Figure 19. Compressive strains of lower rebars at a beam end (Position 6).
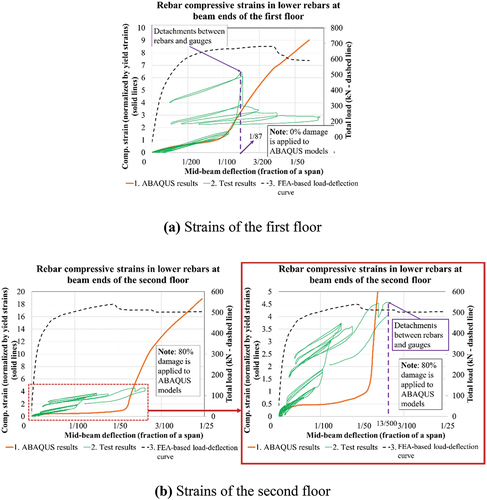
Figure 20. Tensile strains of lower rebars at mid-span (Position 7).
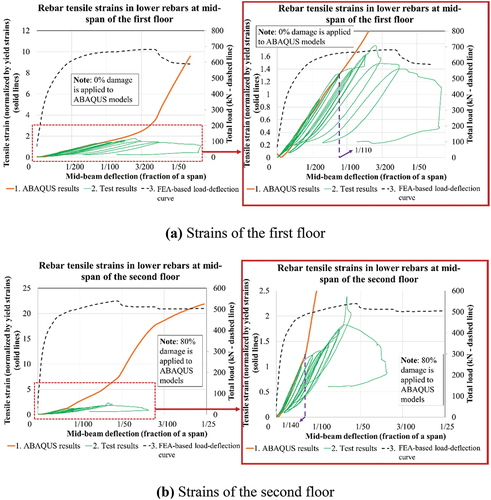
Compressive strains of lower rebars at a beam end (Position 6 of ) at the first and the second floor reach a ductility of 6.5 and 4.6, respectively. Compressive strains are not measured well at beam ends (Position 6 of ) because gauges and rebars were detached at a large normalized strain of 6.5 corresponding to a mid-span deflection of L/87 on the first floor, after which strains decrease as shown in ), whereas strains stop being measured at a large normalized strain of 4.5 corresponding to a mid-span deflection of 13 L/500 on the second floor as shown in ). The numerical predictions of compressive strains match experimentally measured compressive strains relatively well except for at Position 6 at beam ends shown in .
It is better to interpret ) by an evolution of numerical strain because measured strains are developed abnormally. Numerical compression strains are small up to a mid-span deflection of (), large numerical strains only occur at large mid-span deflections greater than
(
), high compression strains at these large deflections are caused by excessive rotations in a plastic hinge at beam ends. This is a commonly seen behavior in frames under vertical loads. Measure strains and numerical strains on both the first and second floors report high compression strains in bottom rebars at beam ends corresponding to large deflections, as shown in ). Gauges on the second floor may not correctly capture strain evolutions in ) because strain magnitudes are high; a similar observation is also found at a large deflection of
on the first floor shown in ). Rebar strains show that all rebars in beams reach yielding strains, indicating that the proposed structure can utilizes all rebar strengths.
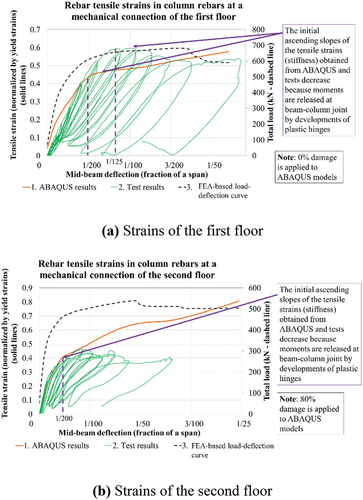
Strains of rebars obtained at Position 8 of ) are shown in . On the first floor, the initial ascending slope of the tensile strains (stiffness) in column rebars at mechanical connections (Position 8) obtained from ABAQUS is similar to that obtained from the test up to a mid-span deflection of L/200 as shown in ). Measured strains start descending at a mid-span deflection L/125 whereas a descending strain branch predicted by ABAQUS does not exist. The slope of the tensile strains (stiffness) obtained by ABAQUS decreases at a mid-span deflection of L/200. On the second floor, the initial ascending slopes of the tensile strains (stiffness) calculated numerically and measured experimentally are similar up to a mid-span deflection of L/200 as shown in ) whereas the slope of the tensile strains (stiffness) calculated by ABAQUS also decreases from a mid-span deflection of L/200. Strains measured experimentally descend slightly.
Figure 21. Tensile strains of column rebars at mechanical connection (Position 8).
illustrates strains of the metal plates connecting columns measured at Position 9 shown in ), demonstrating deformations of structural steel at a position where rebars are welded to plates. On the first floor, the initial ascending slope of the tensile strains (stiffness) in a metal plate obtained by ABAQUS matches that obtained from the test up to a mid-span deflection of L/240. The initial ascending slopes of the tensile strains (stiffness) obtained from ABAQUS and the test start decreasing at a mid-span deflection of L/240 and 9 L/1000, respectively, because moments are released at beam-column joints by the developments of plastic hinges. Small strains in mechanical plates indicate that deformation of plates under testing load are negligible.
Figure 22. Tensile strains of a plate at mechanical connection (Position 9).
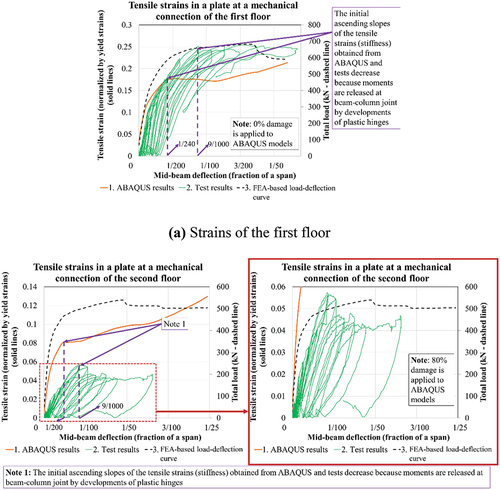
On the second floor, the initial ascending slopes of the tensile strains (stiffness) resulted from ABAQUS and the test decrease at a mid-span deflection of L/200 and 9 L/1000, respectively, because moments are released at beam-column joints by developments of plastic hinges. The tensile strains calculated by ABAQUS continue to increase, while that measured experimentally displays no such ascending trend from a mid-span deflection of 9 L/1000. The early ascending slopes of the tensile strains (stiffness) calculated numerically and measured experimentally are close up as shown in ).
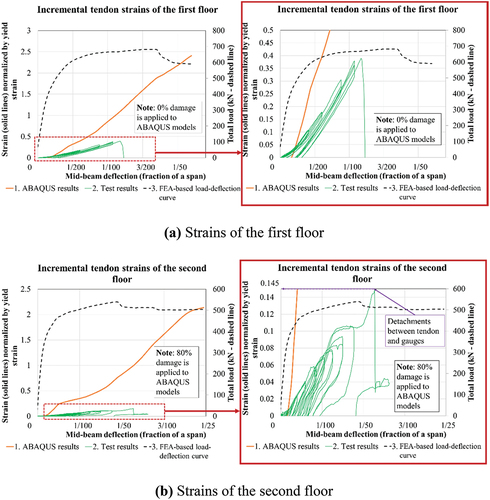
shows tensile strains of tendons vs. a deflection at mid-span (Position 4b of )). However, gauges on the first and the second floors malfunction at a strain of 0.39 times the yield strain and 0.145 times the yield strain, respectively. Measure tensile strains of tendons start from 0 at the beginning of the test, and hence, strains caused by pre-stressing are excluded from gauge data. Incremental strains are presented in because pre-strains are not measured. It is demonstrated that the initial ascending slope of the tensile strains (stiffness) resulted from ABAQUS is higher than that measured by the test decrease for both floors due to malfunction of gauges attached to tendons damaged during prestressing and loading.
Figure 23. Strains of tendons vs. a deflection at mid-span (Position 4b).
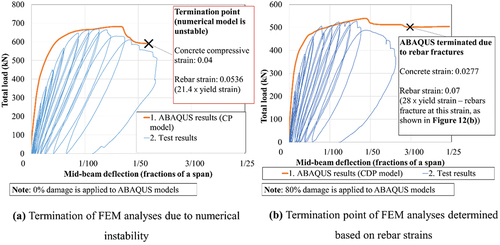
As shown in ), FEM analyses terminate due to numerical instability when maximum compressive concrete strain reaches 0.04 and maximum rebar strain equal to 21.4 times yield strain. Load-deflection relationships calculated by FEA and measured during the test match well, as shown in ).
Figure 24. Termination of FEM analyses.
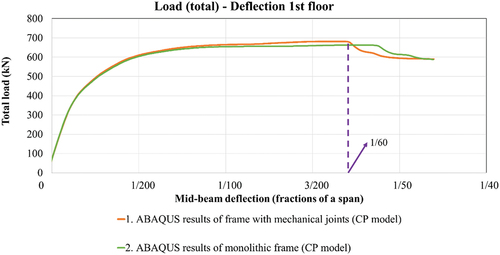
compares an FEA-based load-deflection curve of a monolithic frame with that of a frame having mechanical joints. Results indicate that performances of the two models are relatively similar up to a mid-span deflection of L/60, which is much greater than a limitation of L/360 required by ACI 318–19.
Figure 25. Comparison between performances of a monolithic frame and those of frames with mechanical joints.
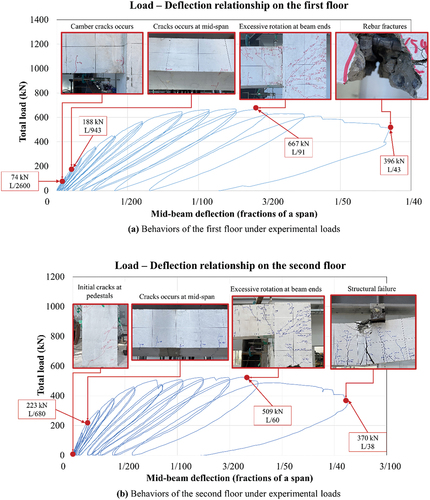
shows behaviors of specimens under experimental loads. ) indicates four key events during tests of the first floor, where camber cracks at beam ends occurred at a load of 74 kN, leading to a mid-span displacement of L/2600. Mid-span cracks were observed at a load of 188 kN, leading to a mid-span displacement of L/943. Excessive rotations were recorded at the maximum load of 667 kN, indicating plastic hinges when a mid-span displacement reached L/91. Finally, rebar fractures were detected at a vertical load of 396 kN, reporting a mid-span displacement of L/43. Tests of the first and second floors used the same pair of footing. Pedestals, therefore, were initially damaged at the beginning of a test on the second floor, as shown in ). These initial cracks slightly affected strengths of the second floor even though footings were rotated to close cracks by placing them on a compression side. Mid-span cracks were found on the second floor at a vertical load of 223 kN, when a mid-span deflection reached L/680. The frame witnessed relatively large rotations at beam ends when vertical loads reached the maximum magnitude of 509 kN at a mid-span deflection of L/60. The frame was severely damaged at the final stroke of a 370 kN vertical load at a mid-span deflection of L/38.
Figure 26. Behaviors of PC frames under experimental loads.
5. Conclusion
In this study, post-tensioned precast frames with mechanical joints are investigated numerically and verified experimentally. American codes are used to design the proposed frames. The finite element model is calibrated by test data, predicting rates of strain increases of the post-tensioned precast frames with mechanical joints. ABAQUS are used to obtain strain evolutions of the structural components which are validated by the structural tests. Modeling techniques simulating the frame tested in this study are also presented. Nonlinear FEA based on CDP models of 80% damage index for the 2nd floor and 0% damage index for the 1st floor demonstrate good matches for the strains. Weak matchings are mainly caused by the gauge malfunctions due to the detachments of gauges from rebars at high strain magnitudes (4.5 to 5.5 times the yield strain of rebars) at large deflections. Concrete gauge malfunctions are also caused due to concrete cracks. There are differences between ABAQUS and test results which might be caused due to imperfections in specimen manufacturers, deviations of test settings, and errors in gauge readings. The following conclusions are drawn from this study:
1) Code-based calculations predict a safety factor of 1.18 for the first floor and 1.57 for the second floor, whereas experiments of the first and second floors result in ultimate strengths of corresponding to a safety factor of 2.17 and corresponding to a safety factor of 2.35, indicating that the proposed PC frame displays strengths exceed those expected by design calculations, demonstrating conservative designs and performances of the proposed PC frame which is post-tensioned precast frames with mechanical joints. FEA-based load-deflection curve of a monolithic frame is compared with that of a frame with mechanical joints, resulting in a similar performance in two models up to a mid-span deflection of L/60, which is much greater than a limitation of L/360 required by ACI 318–19.
2) Both behaviors of microscopic-levels and strengths of the proposed frame element are explored based on an experimental investigation using 96 strain gauges at each floor to capture strains in tendons, rebars, concrete, and connecting plates.
3) Interactions for FEM models are demonstrated with hard contacts, frictionless interactions, tie constraints, and embedded constraints which were used to model prestressed frames. A numerical investigation yields results similar to those measured during experiments, demonstrating accuracies of FEA models. Strain evolution and load-displacement relationships are predicted well except for those measured at the gauges which malfunctioned. The presented modeling parameters can be used for designing post-tensioned precast frames with mechanical joints.
4) Both numerical and experimental strains display small deformations of mechanical connections, where the maximum recorded strain of the plates on the first and the second floor do not yield, showing that they are only 0.25 times the yield strain and 0.13 times the yield strain, respectively. Column performances with mechanical joints similar to those of columns with monolithic joints are, therefore, achieved.
5) Numerical investigations predict the behavior of the proposed pre-tensioned PC frames which are predictable and stable under service loads, and hence, it can be used as an alternative to conventional monolithic cast-in-place frames, offering a convenient erection while eliminating wet beam-column joints that require time to cure.
Disclosure statement
No potential conflict of interest was reported by the author(s).
Correction Statement
This article has been republished with minor changes. These changes do not impact the academic content of the article.
Additional information
Funding
Notes on contributors
Won-Kee Hong
Dr. Won-Kee Hong is a Professor of Architectural Engineering at Kyung Hee University. Dr. Hong received his Master’s and Ph.D. degrees from UCLA, and he worked for Englelkirk and Hart, Inc. (USA), Nihhon Sekkei (Japan) and Samsung Engineering and Construction Company (Korea) before joining Kyung Hee University (Korea). He also has professional engineering licenses from both Korea and the USA. Dr. Hong has more than 30 years of professional experience in structural engineering. His research interests include a new approach to construction technologies based on value engineering with hybrid composite structures. He has provided many useful solutions to issues in current structural design and construction technologies as a result of his research that combines structural engineering with construction technologies. He is the author of numerous papers and patents both in Korea and the USA. Currently, Dr. Hong is developing new connections that can be used with various types of frames including hybrid steel–concrete precast composite frames, precast frames and steel frames. These connections would help enable the modular construction of heavy plant structures and buildings. He recently published a book titled ”Hybrid Composite Precast Systems: Numerical Investigation to Construction” (Elsevier).
Tien Dat Pham
Tien Dat Pham is a post-doc researcher in the Department of Architectural Engineering at Kyung Hee University, Republic of Korea. His research interest includes precast structures.
Dinh Han Nguyen
Dinh Han Nguyen is a post-doc researcher in the Department of Architectural Engineering at Kyung Hee University, Republic of Korea. His research interest includes precast structures.
Thuc Anh Le
Thuc Anh Le is currently enrolled as a master candidate in the Department of Architectural Engineering at Kyung Hee University, Republic of Korea. Her research interest includes precast structures.
Manh Cuong Nguyen
Manh Cuong Nguyen is currently enrolled as a master candidate in the Department of Architectural Engineering at Kyung Hee University, Republic of Korea. His research interest includes precast structures.
Van Tien Nguyen
Van Tien Nguyen is currently enrolled as a master candidate in the Department of Architectural Engineering at Kyung Hee University, Republic of Korea. His research interest includes precast structures.
References
- 461, F. 2007. FEMA 461/June 2007. June. California: APPLIED TECHNOLOGY COUNCIL.
- Abaqus, Dassault Systemes, ABAQUS Analysis User’s Manual 6.14-2. 2014. Providence, RI, USA: Dassault Systemes Simulia Corp.
- ACI 318. 2019. “An ACI Standard.”
- American Society for Testing and Materials. 2010. Torque-Tension Relationship for ASTM A193 B7 Bolts and Studs, 193. West Conshohocken, Pennsylvania, U.S: American Society for Testing and Materials.
- American, A., and N. Standard. 2008. Structural Welding Code- Aluminum Structural Welding Code. LeJeune Road, Miami: American Welding Society.
- Building Department. 2016. Code of Practice for Precast Concrete Construction, 1–85. Hong Kong: Buildings Department Headquarters.
- Construction, A. I. of S. 2016. “Specification for Structural Steel Buildings.” 1–612.
- Duvaut, G., and J. L. Lions. 1972. Les Inequations En Mechanique Et En Physique (The Inequations in Mechanics and Physics), 197. Paris: Dunod.
- Fisher, J. M. 2006. AISC Design Series, 73. Chicago, USA: American Institute of Steel Construction.
- Hong, W.-K. 2019. Hybrid Composite Precast Systems: Numerical Investigation to Construction. Woodhead Publishing. Sawston, Cambridge: Elsevier.
- Hong, W. K. 2021. “Artificial intelligence-based Design of Reinforced Concrete Structures. Daega.”
- Hong, Won-Kee. 2022. Artificial Neural Network-based Optimized Design of Reinforced Concrete Structures. Milton Park, in Oxfordshire: Tayor & Francis (CRC press).
- Hu, J. Y., W. K. Hong, and S. C. Park. 2017. “Experimental Investigation of Precast Concrete Based Dry Mechanical column–column Joints for Precast Concrete Frames.” The Structural Design of Tall and Special Buildings 26 (5): e1337. doi:10.1002/tal.1337.
- Li, D. B., Y. K. Chai, W. L. Li, and R. Xiang. 2022. “Experimental Study and Finite Element Analysis of Seismic Behaviour of Novel Precast Prestressed Concrete Frames.” Structures 38 (February): 402–415. doi:10.1016/j.istruc.2022.02.019.
- Li, Z. X., H. Liu, Y. Shi, Y. Ding, and B. Zhao. 2021. “Experimental Investigation on Progressive Collapse Performance of Prestressed Precast Concrete Frames with Dry Joints.” Engineering Structures 246 (March): 113071. doi:10.1016/j.engstruct.2021.113071.
- Malm, R. 2006. “Shear Cracks in Concrete Structures Subjected to in-plane Stresses.” Trita-Bkn. Bulletin 46 (88): 136.
- Nakano, K., K. Tanabe, Y. Matuzaki, A. Wada, H. Sakata, H. Kuboyama, T. Sugiyama, and M. Ikezawa. 2004. “Experimental Study on Mechanical Behavior of Damage Controlled Precast-Prestressed Concrete Structure with P/C Mild-Press-Joint.” Journal of Structural and Construction Engineering (Transactions of AIJ) 69 (576): 125–132. doi:10.3130/aijs.69.125_1.
- Nzabonimpa, J. D., and W. K. Hong. 2018. “Structural Performance of Detachable Precast Composite Column Joints with Mechanical Metal Plates.” Engineering Structures 160 (January): 366–382. doi:10.1016/j.engstruct.2018.01.038.
- Nzabonimpa, J. D., W. K. Hong, and J. Kim. 2017a. “Mechanical Connections of the Precast Concrete Columns with Detachable Metal Plates.” Structural Design of Tall and Special Buildings 26 (17): 1–14. doi:10.1002/tal.1391.
- Nzabonimpa, J. D., W. K. Hong, and J. Kim. 2017b. “Nonlinear Finite Element Model for the Novel Mechanical beam-column Joints of Precast concrete-based Frames.” Computers and Structures 189: 31–48. doi:10.1016/j.compstruc.2017.04.016.
- Orlando, M., and L. R. Piscitelli. 2018. “Experimental Investigation on Static and Cyclic Behaviour of Flanged Unions for Precast Reinforced Concrete Columns.” European Journal of Environmental and Civil Engineering 22 (8): 927–945. doi:10.1080/19648189.2016.1229226.
- Pampanin, S., A. Amaris, U. Akguzel, and A. Palermo. 2006. “Experimental Investigations on High-Performance Jointed Ductile Connections for Precast Frames.” First European Conference on Earthquake Engineering and Seismology September. 3–8.
- Song, L. L., T. Guo, Y. Gu, and Z. L. Cao. 2015. “Experimental Study of a self-centering Prestressed Concrete Frame Subassembly.” Engineering Structures 88: 176–188. doi:10.1016/j.engstruct.2015.01.040.
- Test, C. C., T. Drilled, and C. Concrete. 2010. “Standard Test Method for Flexural Strength of Concrete (Using Simple Beam with Third-Point Loading) 1.” Hand The C78-02 (C): 1–4. doi:10.1520/C0078.
- Wang, H., E. M. Marino, and P. Pan. 2019. “Design, Testing and Finite Element Analysis of an Improved Precast Prestressed beam-to-column Joint.” Engineering Structures 199 (May): 109661. doi:10.1016/j.engstruct.2019.109661.
- Wang, H., E. M. Marino, P. Pan, H. Liu, and X. Nie. 2018. “Experimental Study of a Novel Precast Prestressed Reinforced Concrete beam-to-column Joint.” Engineering Structures 156 (October 2017): 68–81. doi:10.1016/j.engstruct.2017.11.011.
- Yan, X., S. Wang, C. Huang, A. Qi, and C. Hong. 2018. “Experimental Study of a New Precast Prestressed Concrete Joint.” Applied Sciences (Switzerland) 8: 10. doi:10.3390/app8101871.