
ABSTRACT
In recent years, the results of resilience research have been applied to the adaptive strategies of urban systems facing unpredictable risks, but the exploration of resilience in the field of urban and architectural design remains rare. Through analysing and synthesising research on flood resilience, this paper discusses practical methods of urban and architectural design in the context of flood resilience and develops a design framework from the perspective of engineering design. The specific operational steps are as follows: after vulnerability analysis of the target project, the components of the project are divided into three levels: planning pattern, architectural layout, and architectural details. These levels correspond to three design strategies: multidisciplinary decision-making based on GIS analysis, quantitative evaluation based on Grasshopper, and architecture optimisation guidance based on nature-based solutions. Finally, a case study of a Chinese campus shows that design optimisation based on a multi-level strategy improves the overall ability of the campus to deal with rain and flood disasters, and provides a reference for similar engineering practice. By proposing a general framework for urban and architectural design, this paper promotes the development of flood resilience in the field of applied engineering.
GRAPHICAL ABSTRACT
1. Introduction
Rising global temperatures are making extreme weather events more common, and disasters including typhoons, heavy rain, and floods have become the new normal (Boumphrey Citation2017; Liao et al. Citation2021). Flood disasters caused by extreme weather have brought huge economic losses to urban systems. According to the Citation2020China Bulletin on Flood and Drought Disaster Mitigation (2022), in 2020, 78.615 million people were affected by floods, 279 people were killed or missing, 5.257 million people were displaced, and 90,000 houses collapsed. The direct economic losses reached 266.98 billion yuan, accounting for 0.26% of GDP. To meet the challenges of climate change, the “resilient city” concept has attracted the attention of researchers and become a focus of architects and planners.
The concept of flood risk management (FRM) has changed with the emergence and development of the concept of resilience, and flood resilience has had a far-reaching impact on the evolution of FRM (McClymont et al. Citation2020; Zevenbergen, Gersonius, and Radhakrishan Citation2020; Proverbs and Lamond Citation2017). In 1945, Gilbert Fowler White, the so-called “father of floodplain management,” wrote his influential book Human Adjustment to Floods which criticized the reliance on engineered flood defenses and began to change these approaches. White’s philosophy about flood resilient construction is now widely accepted through the concepts of making space for water and living with floods (White Citation1942).
The focus of research on resilience in various disciplines has changed frequently, leading to fuzziness around the concept of flood resilience (Martin-Breen and Anderies Citation2011). Keating et al. (Citation2017) highlighted that common challenges in resilience measurement frameworks are “(1) defining an appropriate scale of analysis both geographically and temporally [and] (2) identifying the potential end users and potential purposes”. Based on more than 50 years of interdisciplinary resilience research, three conceptual frameworks of resilience can be identified: engineering resilience, system resilience, and resilience based on complex adaptive systems (Martin-Breen and Anderies Citation2011). The concept of resilience of a complex adaptive system includes strategies to deal with flood disasters, moving from emphasising “resistance” to “recovery” to the ability to “living with water” (McClymont et al. Citation2020). Because this perspective emphasises the concepts of “disaster adaptation” and dynamic disaster response and focuses on longer-term resilience, the theory of complex adaptive systems may be the most appropriate conceptual framework given that flood disasters are becoming the new normal.
Although the concept of flood resilience is not well defined, three notable characteristics can be identified: (1) it emphasises the correlation of time and space, not only for resisting disasters, but also for recovery and reorganisation after a crisis (Keating et al. Citation2017); (2) allowing manageable floods to enter can be an opportunity to change the system to a new state (Liao Citation2014; Adeyeye and Emmitt Citation2017); and (3) there is a shift from “fighting the water” to “living with water” (Restemeyer, Woltjer, and Margo van den Brink Citation2015). These characteristics establish a theoretical basis for the formulation of flood resilience strategies.
To develop a design framework for flood resilience, we need entry points for research. The formulation of a resilience strategy often starts with vulnerability analysis, which is the entry point of architectural construction and urban design application strategies. Some authors argue that if the definition of vulnerability is related to the ability to resist disaster-related disturbance, vulnerability and resilience are a set of concepts with a negative correlation (McClymont et al. Citation2020). The Intergovernmental Panel on Climate Change (IPCC) has proposed a conceptual framework of social-ecosystem vulnerability to facilitate understanding of the role of nature in climate adaptation (Marshall et al. Citation2010). It recognises that in each system, vulnerability to climate change has three dimensions: exposure, sensitivity, and adaptive capacity.
From the perspective of architects and planners, flood resilience is an interdisciplinary problem, and the design decisions of architects and planners have an important impact on the building life-cycle. Research suggests that 20% of design decisions are made in the initial stages, which subsequently affect the remaining 80% of design decisions (McClymont et al. Citation2020), and these initial decisions usually involve multiple influences such as a large number of building codes, owners’ opinions, interdisciplinary suggestions and architects’ own subjective concepts. When it comes to interdisciplinary goal optimisation, traditional design methods are not well-suited to dealing with complex problems, and empirical methods are inefficient for realising the optimal solution (Jalali, Noorzai, and Heidari Citation2020).
Manfredo and Dayer (Citation2004) stress the importance of considering the impact of resilience at different spatial scales. As research at the community and campus scales is lacking, we hope to promote the progress of research at this larger scale. Based on this perspective, this study uses quantitative tools and methods to make design decisions in the field of urban design led by architects and planners, with the aim of improving the ability of the built environment to deal with rain and flood disasters and promoting and exploring applied flood resilience research.
1.1. Research AIM and method
In the research on flood resilience, there is little discussion of spatial and building applications, but some scholars have begun to study and discuss architectural solutions (Kuang and Liao Citation2020; World Bank Citation2021), simulation methods and tools (Chen, Samuelson, and Tong Citation2016; Morschek, König, and Schneider Citation2019) for flood resilience. The main aim of this study was to investigate the potential for enhancing flood resilience at the campus scale from the perspective of early-stage engineering design. We developed a design framework and evaluated its applicability in a case study.
Our research design adopted a “design science research process” (DSRP) methodology based on processes described by Peffers et al. (Citation2006) and Mukkavaara and Sandberg (Citation2020), in which a problem-centred approach drives a cycle of objectives from which suggestions are communicated by evaluating and reflecting on the results in light of existing theory. The DSRP model includes six steps: problem identification and motivation, objectives of a solution, design and development, demonstration, evaluation, and communication. The DSRP process was used in this study to develop a design framework for improving flood resilience (see ).
Figure 1. Design science research process for urban and architectural solutions for flood resilience (Peffers et al. Citation2006).
Our DSRP process was as follows:
(1) Problem identification and motivation. We recognised that prior literature(the previous research on FRM and flood resilience) lacks a design framework including methods and strategies for building flood-resilient urban spaces.
(2) Objectives of a solution. The objectives included consistency with flood resilience in prior literature and the definition of flood-resilient urban spatial characteristics.
(3) Design and development. A design framework was developed for improving flood resilience.
(4) Demonstration. The resulting process model was implemented for the design of Jiangxi Arts and Ceramics Technology Institute.
(5) Evaluation. The characteristics of the simulation results were compared with the objectives described above during a design optimisation process.
(6) Communication. This paper communicates our results.
2. Design framework for improving flood resilience
As noted above, in design practice for flood resilience optimisation, analysing the vulnerability of the research object is the entry point. Chen, Sun, and Li (Citation2019) constructed a whole-process “analysis–strategy–scheme–feedback” mechanism for the resilient urban design of a micro-city cluster, and some authors have noted that “vulnerability and resilience are a set of negatively related concepts” (Klein, Nicholls, and Thomalla Citation2003). Accordingly, we developed a design framework of “vulnerability analysis–hierarchical division of components–development of design strategies” from the perspective of engineering design (). The specific steps are as follows:
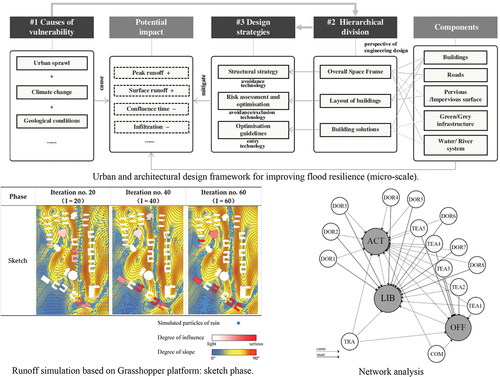
Figure 2. Urban and architectural design framework for improving flood resilience (micro-scale).
2.1. Vulnerability analysis
In our framework, the vulnerability analysis of the target project is carried out from the perspective of flood resilience. The main vulnerabilities are associated with urban expansion (such as changes in runoff conditions caused by new buildings and the increase of hard ground, water and soil loss), climate change (this study specifically refers to flood disasters caused by high-intensity rainfall), and geological factors (topographical and geological conditions of the target project). The research starts with a vulnerability classification, which helps to identify the key problems to be solved in the whole project.
The vulnerability of target projects will affect the catchment and runoff conditions of the site, which may have impacts including increases in runoff peak and surface runoff, decreased confluence time, and the deterioration of site conditions.
2.2. Hierarchical division of components
The micro-scale components of cities include buildings, roads, pervious/impervious surfaces, green/grey infrastructure and water/river systems. The components of the target project need to be divided into different levels. From the perspectives of engineering design and practical experience, components can be divided into three interrelated and nested levels: the overall spatial frame, layout of buildings, and building solutions. Each level has its corresponding strategy.
2.3. Development of design strategies
As noted above, flood resilience has three important characteristics: (1) it emphasises the correlation of time and space, not only to resist disasters but also for recovery and reorganisation to deal with a crisis; (2) allowing manageable floods to enter can be an opportunity to change the system to a new state; and (3) there is a shift from “fighting the water” to learning to “live with water”. Translating these characteristics to the field of spatial design to guide the design strategy, three key points arise: designers should (1) pay attention to recovery and use a combination of active and passive recovery strategies, (2) allow controlled flooding into the system to improve resilience, and (3) focus on “living with water” and provide as many rainwater management components as possible.
The corresponding design strategies are formulated according to the characteristics of the different levels in the system and engineering practice. It is important to note that a university campus belongs to the micro-scale in the context of an entire urban system, but its small scale means that the planning and design process can be combined with more sophisticated quantitative tools for design feedback, which has practical advantages.
Flood resilient construction strategies are categorized into three types as avoidance technology, water exclusion technology, and water entry technology (Proverbs and Lamond Citation2017). In the overall spatial frame, precipitation and terrain can be comprehensively analysed by using GIS and other tools to form a decision-making model dominated by planning and architecture and coordinated by multiple disciplines (Pistrika Citation2010). At this stage, the main focus is on determining the appropriate location preliminaries for the buildings and landscaping based on the flow and elevation of the water system within the site. The designer’s main approach is avoidance technology, and following the principles of “making space for water.”
In terms of the evaluation and optimisation of building layout, a quantitative flood simulation method based on Grasshopper can be used for design feedback, which is convenient for the rapid optimisation and adjustment of layout schemes at different design stages (Morschek, König, and Schneider Citation2019). The approach taken in this stage is also one of avoidance technology, where the designer uses simulation to address the main conflicts between building layout and rainwater runoff, and then combines this with water exclusion technology to solve local problems that are difficult to optimise.
Architectural detail can be optimised based on the architectural technology described in A Catalogue of Nature-based Solutions for Urban Resilience, published by the World Bank Group and the Global Facility for Disaster Reduction and Recovery (GFDRR) (World Bank Citation2021). Of the three approaches to building level measures (avoidance, water exclusion, water acceptance), the avoidance approach is usually preferred. However, we focus on the approach “NBS (Nature-based solutions) + architecture ” at this stage, which would be water entry technology, following the philosophy of “living with water ” while improving the quality of the spatial and thermal environment. Additionally, the network analysis is taken, adapting the approach of Emanuelsson et al. (Citation2014) and Sultana and Chen (Citation2007), that is, the effect of the potential flooding of one property on another or a combination of them. The results of the analysis can lead to a decision on mitigation measures for selected buildings.
All of these strategies are integrated to mitigate the potential impacts of the vulnerability of the target project.
3. Demonstration and evaluation: a case study
Based on the above research basis and design framework, a case study of Jiangxi Arts and Ceramics Technology Institute was carried out, and the specific solutions to the key problems and core steps of the target project were deepened and refined ().
Figure 3. Engineering research and design framework for Jiangxi arts and ceramics technology institute.
3.1. Vulnerability analysis
Jiangxi Arts and Ceramics Technology Institute is located in Fuliang County, Jingdezhen City, Jiangxi Province. The site covers an area of 533,000 square metres. The university has a total of 11,800 students and staff with a population density of 22,139 people/km2, a figure that is in the normal range for universities in China, but which is much larger than the population density figure for the city of Jingdezhen (319 people/km2). In China, when dealing with floods, the management of flood risk schemes for campuses are generally developed independently by the university administrators, but as universities have relatively complete functions and good building quality, they are used as temporary shelters in schemes developed by city administrators, so they often need to provide a large number of shelters in the event of a disaster, which places higher demands on the design of university campuses.
Jingdezhen has a subtropical monsoon climate with hot summers and cold winters. It has abundant precipitation throughout the year and often has sudden rainstorms. The month with the most rain in Jingdezhen is June, with an average rainfall of 287 mm (Climate and Average Weather Year Round in Jingdezhen Citation2022). In 2012, the largest single-day precipitation ever recorded in Jingdezhen was 642 mm due to Typhoon “HAIKUI,” with a return period of 200 years.
The site’s vulnerability background of rainstorms and flood disasters includes the frequent occurrence of climate disasters, the increase of surface runoff and peak rainwater runoff value caused by urban expansion, and the risk of geological collapse and landslides (Chen, Sun, and Li Citation2019; Dai et al. Citation2017).
The data analysis results () and practical experience show that the project site is located in a hilly landscape. The complex terrain and natural gully on the site are the biggest hidden danger. Sudden heavy rainfall could affect the normal operation of buildings on the campus. New buildings will also affect the original landform. An increase of hard paving and an inappropriate building layout may worsen runoff conditions, increase surface runoff, increase peak runoff, and shorten the confluence time.
Figure 4. GIS analysis: (a) aspect; (b) altitude; (c) slope.
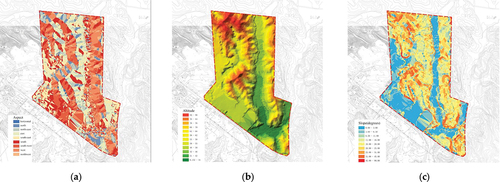
Figure 5. Features of three flood-resilient areas of the gully on the campus of Jiangxi Arts and Ceramics Technology Institute.
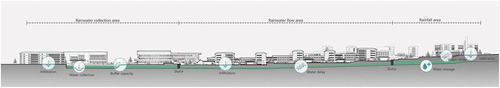
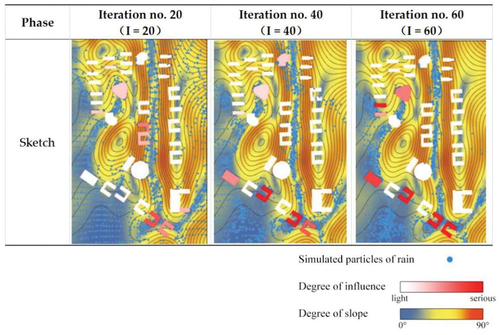
Figure 6. Runoff simulation based on Grasshopper platform: sketch phase.
3.2. Structural strategy for overall spatial frame
Based on GIS analysis, the design team made a preliminary judgment on the precipitation catchment and terrain of the site. The overall terrain of the campus is high in the north and low in the south, with an obvious catchment area (the gully), which is a great threat during rain storms. The structural strategy was developed using a multidisciplinary approach.
We aimed to implement the characteristics of “living with water” flood resilience by creating a flood-resilient landscape pattern on campus. Water interception infrastructure has been built on the site to create a rainfall area, rainwater flow area, and rainwater collection area according to different characteristics of rainfall, flow, and collection around the catchment gully, respectively (). Meanwhile, sluices have been set to divide the gully into the three areas for multi-level regulation of the water system to provide active flood resilience infrastructure to improve the possibility of restoration. Many nature-based solutions are present in the landscape.
The three flood-resilient landscape areas are as follows:
Rainfall area (rainwater landscape). This area is located at the highest part of the terrain. Nature-based solutions for water delay, infiltration, and water storage through green infrastructure exist in this area. The planning scheme focuses on exploiting the student activity centre to create a rainwater landscape, using the natural grass slope to reduce the speed of rainwater loss, and adjusting the site microclimate through evaporation and heat absorption.
Rainwater flow area (ecological corridor). This area is in the middle part of the gully. Rainwater flows here in a resilient ecological corridor. This area is relatively narrow and long, with green infrastructure for water delay. As the site is concentrated on a south-facing slope, a core teaching area is set here so that the classrooms are in sunshine. The landscape design combines a water affinity platform and footpath to enliven the campus atmosphere and guide teachers and students to get close to nature. According to specific flood conditions, the water level on the campus can be dynamically adjusted through active sluice control.
Rainwater collection area (depression landscape). Rainwater flows into this low-lying area, forming a large lake. The lakeside leisure infrastructure is more than 1.5 m above the lake surface, and water affinity steps made from anti-skid materials are set at more than 0.5 m above the water to create a convertible spatial mode that is designed to leave redundancy for sudden flood disasters. In normal times, the water level in this area is relatively low, and the steps 0.5 m above the water surface can be used normally. In a rainstorm, the system allows a controllable flood to enter, and the steps 0.5 m above the water surface are submerged, while the infrastructure 1.5 m above the water surface can be used normally. Because of the large catchment area and the advantages of the natural landscape, we placed the library and administrative building on opposite sides of the lake to create the core landscape area of the campus.
3.3. Risk assessment and optimisation of layout of buildings
This part of the study focuses on the interaction between buildings and surface rainwater runoff and refines the building layout scheme according to the results of a rainwater simulation.
Research on rain and flood simulation began in the 1970s. Two groups of methodologies emerged that are now the subject of ongoing research: empirical methods and physically based hydrodynamic models (Hurlimann and Wilson Citation2018). Today, it is widely acknowledged that using physically based hydrodynamic models to predict flood outcomes in an urban context is the most realistic approach (Pechlivanidis et al. Citation2011). These models are well established in commercial packages such as SWMM (Bisht et al. Citation2016), HEC-RAS (HEC-RAS Citation2022), MIKE FLOOD (Mike Flood Citation2022), and Hydro Bid (Hydrobid Citation2022). Architects and urban designers need to quickly compare proposals during the concept phase. Compared with the listed packages, the Grasshopper platform is more suitable for architects and planners because it has a better visual interface and multi-tool integration function and can use parametric methods to solve corresponding problems.
In this area, Chen, Samuelson, and Tong (Citation2016) developed the rainwater+ toolkit to enable architects to consider rainwater runoff at an early design stage based on the LID (low-impact development) concept. Morschek, König, and Schneider (Citation2019) developed the SRTF (spatial resilience toolbox-flooding) tool to enable designers to optimise spatial layouts according to rain and flood resilience evaluations in the early stage of the planning process. These tools provide a good foundation for our study. We adopted the research logic of SRTF and adjusted the Grasshopper link according to the project to conduct targeted calculation and comparison of specific cases during the concept phase.
The rain and flood risk assessment method developed based on the Grasshopper platform enables designers to intuitively judge the advantages and disadvantages of different layout schemes, and then select the layout scheme with the greatest potential. We designed several layout schemes based on functional rationality, landscape pattern, and other factors.
3.3.1. Rainwater simulation settings
For the rainwater simulation, we drew upon the SRTF toolbox, which can help to minimise the risk of flooding and simultaneously reduce the costs arising from the implementation and maintenance of drainage infrastructure. The rain runoff simulation was conducted with the help of the interactive physics/constraint solver Kangaroo for Grasshopper.
In the simulation process, particles are affected by gravity and produce a runoff-like path along the analysed surface. Three parameters can be set individually to match several different rainfall events: (1) the number of particles, (2) the size of particles, and (3) the number of iterations. It is important to note that simulating actual rainfall requires a huge processing capacity, which ordinary computer processing systems cannot achieve. Morschek, König, and Schneider (Citation2019) attempted to simulate a real rain environment (>100 mm/day) by setting each particle as a sphere with a diameter of 30 cm to represent approximately 4 litres of water per square metre, to simulate the rainfall in 1 hour. In our case, as we did not need to vary the rainfall conditions during the experiment, the layout was the only experimental variable.
3.3.2. Building information input and terrain analysis
In terms of building information input, we evaluated the footprint of the buildings, while the upper part of the building was regarded as an ideal green roof that could fully treat and absorb rainwater. When dealing with the input building model, the building was treated as two parts: the shape of the bottom floor of the building was the evaluation object, and the spatial form of the top floor of the building affected the number of particles in the rainfall simulation. In terms of terrain treatment, the input terrain needs to be larger than the evaluation range because the rainwater impact of the surrounding terrain should be considered.
3.3.3. Risk assessment of the layout scheme
In the simulation evaluation, the location in which the rainwater particles gather and the contour of the bottom of the building are projected onto the same two-dimensional plane at the same time. By evaluating the number of rainwater particles in a certain range around different buildings, the degree of influence of rainwater scouring and aggregation can be assessed. Buildings that are greatly affected by surface runoff and rainwater accumulation are marked as coloured blocks with different colours from white to red according to the degree of influence. According to the simulation results, the scheme reaches a steady state after 60 iterations, so the three rainwater simulation conditions of I (iteration) = 20, I = 40, and I = 60 were taken as the evaluation criteria.
3.3.4. Optimisation and improvement process
The above methods were used for design feedback in three different design phases of the project: sketch, preliminary design, and design refinement. The three phases of the optimisation design and their simulation feedback results are described below.
4. Phase 1: sketch ()
i. In the initial stage of rainfall (I = 20), most of the buildings with potential risks are located in low-lying terrain.
ii. During the rainfall event (I = 40), the risk of surface runoff scouring buildings in the south of the campus gradually increases (colour deepens and the number of affected buildings increases), and some buildings in the north near the gully are at risk.
iii. In the later stage of the rainfall event (I = 60), the buildings are affected by the accumulation of rainwater, and there is a risk of inundation in the south and in some buildings in the northwest.
Analysis: In the sketch step, the buildings in the south and northwest do not perform well in the simulation experiment. We have avoided the gully on the site for most of the buildings, but due to the lack of vertical design, many of the simulated surface rainwater particles are blocked by buildings, so it is difficult for water to flow naturally to low places. This is because architects tend to pay more attention to the function of the building during the sketch stage and do not consider the terrain.
Optimisation direction: Solve the main contradiction through reasonable vertical design. Specifically, the potential risks to some buildings in the south and west can be improved using sites with water seepage potential around key buildings (set as flat ground so that rainwater particles cannot move in the simulation). In the overall site design, the rainwater runoff relationship can be treated separately through a stepped terrace design. Step-by-step treatment of rainwater can increase the length of time for which rainwater flows into the gully and achieve the purpose of flood delay.
5. Phase 2: preliminary design ()
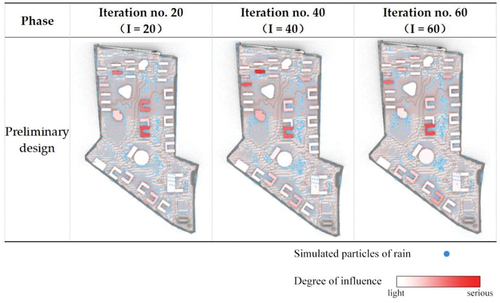
i. In the initial stage of rainfall (I = 20), the buildings in the middle are dark, indicating that the architectural form and surrounding sites are not conducive to runoff and catchment.
ii. During the rainfall event (I = 40), the buildings in the middle are still dark and some buildings on the north side become darker.
iii. In the later stage of the rainfall event (I = 60), some buildings in the middle and west have a great risk of rainwater inundation and accumulation, whereas some buildings in the south are at less risk compared with the preliminary scheme.
Analysis: According to the results of the preliminary stage, sites on the west and south sides have water seepage potential (the simulation is set as flat), which has been improved overall, but some buildings are still not ideal.
Optimisation direction: Optimise architectural form and the deepening design of site elevation.
Figure 7. Runoff simulation based on Grasshopper platform: preliminary design phase.
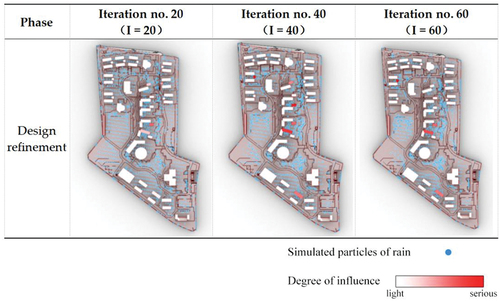
6. Phase 3: design refinement ()
i. In the initial stage of rainfall (I = 20), only a few buildings are coloured, and the overall performance is good.
ii. During the rainfall event (I = 40), some buildings are coloured and dark near the gully and in the risk areas in the south and west.
iii. In the later stage of the rainfall event (I = 60), two buildings in the middle, one in the south, and one in the northwest are at risk. Most of the buildings perform well in the simulation, and the rainwater particles are evenly distributed in the open plain or collected in the gully.
Analysis: Through the optimised design of building form and the fine adjustment of site elevation, the number of buildings affected by surface runoff is reduced, but a small number of buildings are still affected. Most buildings perform well in the experiment.
Optimisation direction: Improve performance by adjusting site elevation or adding grey and green infrastructure.
Figure 8. Runoff simulation based on Grasshopper platform: design refinement phase.
6.1. Optimisation guidelines for building solutions
The biggest challenge when creating optimisation guidelines is to implement the relatively macro-scale concept of “resilience” into specific architectural designs. However, some effective methods have been suggested based on previous case studies from around the world (World Bank Citation2021). The following three questions should be considered: (1) What solutions should we choose? (2) Are these solutions useful? (3) How should the solutions be applied to specific architectural designs?
The building solutions mention in this chapter are derived from the solutions that combine NBS with buildings mentioned in ’A Catalogue of Nature-based Solutions for Urban Resilience’. These solutions are mainly to restore nature’s water cycle process through the use of NBS-related measures at the building scale to alleviate flood problems caused by urban sprawl.
6.1.1. Nature-based building solutions
Our current research focus, flood resilience, often appears in the context of planning and landscape but there is little discussion in the context of architecture. A Catalogue of Nature-based Solutions for Urban Resilience, published by the World Bank Group and the Global Facility for Disaster Reduction and Recovery (GFDRR) (World Bank Citation2021), mentions architectural solutions in the construction of resilient cities. These solutions include roof and facade greening, which creates opportunities to collect, store, and reuse rainwater, and even improves air quality and reduces temperature. Studies have reported that participating in flood management through building solutions such as green roofs and green facades can reduce the demand for regional natural infiltration areas (Akther et al. Citation2018; Eisenberg and Polcher Citation2019). Specifically, collecting and storing rainwater through green roofs enables rainwater retention, flood peak reduction, and pollutant removal, reducing the peak load of rainwater and sewage systems, and allowing buildings to actively participate in the water system, which contributes to the improvement of flood resilience. Such building solutions are similar to those suggested by previous research (Restemeyer, Woltjer, and Margo van den Brink Citation2015) such as making buildings more actively participate in FRM to achieve the purpose of “living with water”.
6.1.2. Indicators of usefulness
The NBS catalogue focuses on intensive and extensive green roof types. The natural processes that green roofs are associated with are evapotranspiration, temporary storage and buffering of rainwater, and sunlight absorption. Extensive green roofs are basic lightweight systems characterised by minimal maintenance and management. The NBS catalogue sets a performance threshold for extensive green roofs. They should have at least 25 L/m2 storage capacity and 95% coverage after three years. Intensive green roofs are accessible for public or recreation purposes and also need regular maintenance, which leads to higher costs compared with extensive green roofs.
The usefulness of green roof technology is mainly reflected in rainwater retention, which can reach 20–50 L/m2 for extensive green roofs and 30–160 L/m2 for intensive green roofs (Eisenberg and Polcher Citation2019). The water retention rate decreases as rainfall increases, and due to different technical standards, the retention rates of green roofs in rainfall events show individual differences. Luo, Zhou, and Zhang (Citation2018) evaluated green roof performance in terms of storm-water runoff control under Hangzhou climate conditions, and found that green roofs could effectively reduce runoff volume by 53%–62%, reduce runoff peaks by 50%, and delay the peak runoff by 8 min compared with a control roof. In a study conducted in the United States, the retention rates of green roofs in light rainfall events (<25.4 mm), medium rainfall events (25.4–76.2 mm), and heavy rainfall events (>76.2 mm) were 88%, 54%, and 48% respectively (Carter and Rasmussen Citation2006). However, Simmons et al. (Citation2008) studied the performance of six different extensive green roof designs vegetated with native species with either non-reflective (black) roofs or reflective (white) roofs, and found that the maximum run-off retention was 88% and 44% for medium and large rain events, respectively.
It has been reported that the rainwater retention rate of green facades (facade-bound greening) can reach 15%–30% (World Bank Citation2021). Although experimental data are lacking, especially for China, green facades can be considered to have positive effect on flood resilience.
Based on the literature, we believe that nature-based solutions have indeed been shown to be useful for improving flood resilience, but there are individual differences in the effects of different technologies. Because of this, architects should comprehensively weigh various factors in the design in relation to cost and construction units before making design decisions. The actual effects need to be verified by measurement after project completion.
6.1.3. Guidelines for architectural design
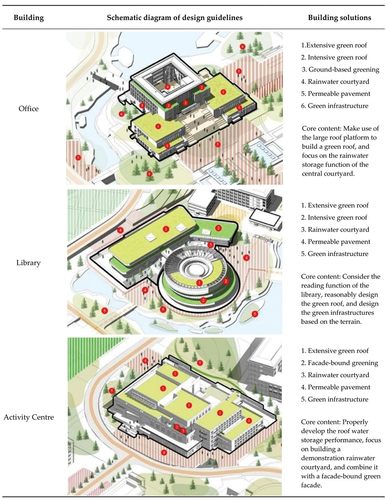
In our case, through the fine-grained design of important node buildings, we made comprehensive use of nature-based solutions: 1) ground-based and facade-bounded green facades; 2) extensive and intensive green roofs; and 3) a rainwater courtyard and rainwater collection technology combined with green facade technology to form an overall rainwater treatment system.
shows how flood-resilience technologies can enable the designer to control the overall design in combination with economic overall construction of the campus and the characteristics of architectural design. Importantly, these building technologies not only enable the building units to participate in the overall flood regulation of the campus but also play a positive role in the promotion of and education about the concepts of resilience, thermal comfort of indoor and outdoor environments, biodiversity and reducing air pollution. Furthermore, we still need a network analysis to guide our decisions on cost input, which will be carried out in the next step.
Figure 9. Design guidelines for important buildings on campus.
6.1.4. Network analysis
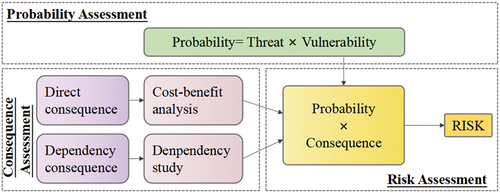
Network analysis is taken to inform the designer’s decision-making behaviour and determine the priorities of the buildings. The approach () is described as ’screening’ to indicate that it fails to provide absolute measures of risk. Instead, the methods provide relative and indicative measure of risk, aiming to identify those assets (buildings) that are at most risk from flooding and those pose most to other parts of the network (Emanuelsson et al. Citation2014). We adapt their ideas to our project which considers the campus as a functional system, to analyse the priorities of the three key assets in the design in terms of “functional coupling” and “cost-benefits.” The steps are as follows:
Figure 10. Overall view of flood risk tool (Emanuelsson et al. Citation2014).
Define the boundaries of the network to be analysed and identify assets within the network. All buildings that functionally related in this case.
Define the sample of flood events to be considered for each asset and estimate the flood exceedance probability and vulnerability. All the buildings, in this case, are newly constructed and have almost the same structural quality, so the vulnerability to flooding is considered to be the same and is 1.0. The probability depends on the frequency of flooding and is 0.005 (with a return period of 200 years), using the typhoon “ HAIKUI ” as a reference.
Identify types and locations of dependencies and create network diagrams (). The connection is established according to the interdependence of functions.
Figure 11. Interdependency network for case study area. ACT, activity centre; LIB, library; OFF, office; COM, communication centre; TRA, training centre; TEA 1–5, teaching building 1–5; DOR 1–8, dormitory building 1–8.
Assess the strength of each dependency (considering whether it is classed as a “tight” or “loose” coupling) and assign a strength score. The strength score for this case will depend on the condition “whether there is redundant space available to replace functions that have been disabled by flooding”, if this condition is met, meaning that the missing functions can be compensated for at less cost, the score will be 0.5, if not, the score may be 1.0.
Quantify the extent and importance of consequence for each flood event considered. The direct consequence in this case is based on an analysis of the costs required for restoration based on the real construction costs (assuming that the building structure is not destroyed by the flood). Then the cost of the damage is converted to 10,000,000, e.g. if the library costs 8,640,000 to repair, the value of its conversion is 0.864; Here it also includes an analysis of the consequences arising from dependencies.
For consequences arising from dependencies, adjust the consequence score by multiplying with the associated strength score. ( take the office building as an example.)
Table 1. Consequence scoring from dependencies of OFF.
Quantify risk for each asset by multiplying the adjusted consequence by the relevant probability ().
Table 2. Risk scoring for case study three buildings of the campus.
The score obtained for each building is utilized to rank the buildings according to flood risk and ultimately identify which building would benefit most from post-screening analysis and potential flood mitigation measures. This information is critical for this step, which would be further analysis potentially leading to a decision on mitigation measures for the selected buildings. Depending on the results in the library requires the most flood mitigation measures, while the office building is more important in the network than the activity centre.
7. Discussion
7.1. Research contribution
This paper describes the goal of improving the flood resilience of a built-up environment through spatial design, and discusses the usefulness of various methods based on previous research. We also develop a framework to improve flood resilience from the perspective of engineering design, which integrates qualitative judgment methods of engineering experience with some quantitative optimisation methods. This open framework can be expanded when new design methods are certified in the future. Finally, a case study is used to demonstrate the potential of the framework in a real-life application.
Although there has been an increase in research on flood resilience, there have been few explorations of applied technologies in this field, especially from the perspectives of architectural and urban design. The contribution of this paper is to provide an experimental design framework for architects or urban designers of similar projects. Meanwhile, we hope that architects and urban designers will pay more attention to the concept of resilience to promote the further development of research in this field.
7.2. Additional considerations
From an applied perspective, this paper reveals the potential contributions that designs at different spatial scales can make to flood resilience, and provides a feasible framework for designers. In the current engineering context, flood resilience is used as an optimisation aid of design, rather than being a core design goal, but further research in this field may cause a change in traditional design thinking.
It should be noted that the research methods used in this study had additive positive effects. We do not know whether, in other projects, this simple superposition of methods will bring positive effects to the whole system or whether this superposition will produce interactive negative effects. The effectiveness of this framework needs to be further verified by experiment.
The study focuses on the early design stages and the framework is based on actual engineering design processes. However, the methods used in the framework, in particular, the GIS-based and GRASSHOPPER-based simulation analysis methods, can also be used in the post-design stage as a tool for resilience study. But methods that can be utilized at the building level require a comprehensive consideration of the benefits. The validation of effectiveness of these building solutions should be verified through the actual measurement of rainfall and runoff data in the post-design stage, which requires a long-term plan to develop a healthy feedback pattern for optimisation.
The original aim of this research was to reduce the threshold of interdisciplinary judgment of architects and urban designers to facilitate appropriate design decisions by the main decision-makers. From this perspective, the unification of design platforms and the further simplification of the design process to develop a comprehensive platform with application value and rapid design feedback still needs to be considered, which will require further demonstration and ongoing research efforts.
Actual engineering experience should also be considered. In real projects, additional design is often rejected because the long-term economic costs and benefits cannot be foreseen. Therefore, it is necessary to further consider reducing the technical cost and to accurately estimate long-term economic benefits. At present, research on the concept of resilience in spatial design is still in its infancy. Despite its various limitations, we believe that our effort and results are worth sharing, and we hope that our work will help researchers and engineers in the same field.
8. Conclusions
This paper presents a design framework from the perspective of flood resilience. The application of the framework as a design prototype used by architectural designers in the early design stage is demonstrated using a case study of a university campus project in Jiangxi Province, China. The main aim of this paper is to draw architectural designers’ attention to the importance of FRM in different design dimensions, and make designers aware of the features that must be considered when designing a resilient spatial form.
At present, domestic research on resilience, especially rainwater flooding resilience, is still in its early stages, and there has been little in-depth research on the spatial form and design practice of urban designers and architects in China. From a perspective of engineering design, this study comprehensively applies different levels of resilience design methods at the scale of the university campus. We hope our practical exploration will be beneficial for similar university campuses and urban design projects.
We hope that this design framework and workflow will be referenced and applied, and will become a conventional tool for urban design and architectural design optimisation. However, further research is still needed in this field to supplement the toolkit for flood resilience, and to determine which scenarios this workflow can be used in, and what types of tools can solve resilience problems most efficiently.
Author contributions
Conceptualisation, X.K., W.Y.; data curation, X.K.; investigation, A.C., Z.R. and L.M.; methodology, X.K.; software, X.K. and L.M.; supervision, X.K., W.Y.; validation, A.C., Z.R. and L.M.; writing – original draft, X.K.; writing – review and editing, X.K., W.Y. All authors have read and agreed to the published version of the manuscript.
Disclosure statement
No potential conflict of interest was reported by the author(s).
Additional information
Funding
References
- 2020 China Bulletin on Flood and Drought Disaster Mitigation. Accessed 22 May 2022. http://www.mwr.gov.cn/sj/tjgb/zgshzhgb/202112/t20211208_1554245.html
- Adeyeye, K., and S. Emmitt. 2017. “Multi-scale, Integrated Strategies for Urban Flood Resilience.” International Journal of Disaster Resilience in the Built Environment 8 (5): 494–520. doi:10.1108/IJDRBE-11-2016-0044.
- Akther, M., J. He, A. Chu, J. Huang, and B. Van Duin. 2018. “A Review of Green Roof Applications for Managing Urban Stormwater in Different Climatic Zones.” Sustainability 10 (8): 2864. doi:10.3390/su10082864.
- Bisht, D. S., C. Chatterjee, S. Kalakoti, P. Upadhyay, M. Sahoo, and A. Panda. 2016. “Modeling Urban Floods and Drainage Using SWMM and MIKE URBAN: A Case Study.” Natural Hazards 84 (2): 749–776. doi:10.1007/s11069-016-2455-1.
- Boumphrey, S. 2017. “Extreme Weather Events are the New Normal.” Nature 548: 499. doi:10.1038/548499b.
- Carter, T. L., and T. C. Rasmussen. 2006. “Hydrologic Behavior of Vegetated Roofs 1.” JAWRA Journal of the American Water Resources Association 42 (5): 1261–1274. doi:10.1111/j.1752-1688.2006.tb05299.x.
- Chen, Y., H. W. Samuelson, and Z. Tong. 2016. “Integrated Design Workflow and a New Tool for Urban Rainwater Management.” Journal of Environmental Management 180: 45–51. doi:10.1016/j.jenvman.2016.04.059.
- Chen, B., Y. Sun, and Y. Li. 2019. “Resilient Urban Design of Central and Eastern Pazhou Based on ‘strategy–feedback’ Mechanism.” Landscape Architecture Journal 26 (9): 57–65. doi:10.14085/j.fjyl.2019.09.0057.09.
- Climate and Average Weather Year Round in Jingdezhen. Accessed 31 October 2022. https://weatherspark.com/y/131649/Average-Weather-in-Jingdezhen-China-Year-Round#Sections-Precipitation
- Dai, W., Y. Sun, H. Meyer, and T. K. Bacchin. 2017. “Resilient Planning of Delta Cities under Climate Change.” City Planning Review, no. 12: 26–34. doi:10.11819/cpr20171205a.
- Eisenberg, B., and V. Polcher. 2019. Nature Based Solutions: Technical Handbook. UNaLab. doi:10.13140/RG.2.2.24970.54726.
- Emanuelsson, M. A. E., N. Mcintyre, C. F. Hunt, R. Mawle, J. Kitson, and N. Voulvoulis. 2014. “Flood Risk Assessment for Infrastructure Networks.” Journal of Flood Risk Management 7 (1): 31–41. doi:10.1111/jfr3.12028.
- HEC-RAS. Accessed 22 May 2022. https://www.hec.usace.army.mil/software/hec-ras/
- Hurlimann, A., and E. Wilson. 2018. “Sustainable Urban Water Management under a Changing Climate: The Role of Spatial Planning.” Water 10 (5): 546. doi:10.3390/w10050546.
- Hydrobid. Accessed 22 May 2022. https://www.iadb.org/en/water-and-sanitation/hydrobid
- Jalali, Z., E. Noorzai, and S. Heidari. 2020. “Design and Optimization of Form and Facade of an Office Building Using the Genetic Algorithm.” Science and Technology for the Built Environment 26 (2): 128–140. doi:10.1080/23744731.2019.1624095.
- Keating, A., K. Campbell, M. Szoenyi, C. McQuistan, D. Nash, and M. Burer. 2017. “Development and Testing of a Community Flood Resilience Measurement Tool.” Natural Hazards and Earth System Sciences 17 (1): 77–101. doi:10.5194/nhess-17-77-2017.
- Klein, R. J., R. J. Nicholls, and F. Thomalla. 2003. “Resilience to Natural Hazards: How Useful Is This Concept?” Global Environmental Change Part B: Environmental Hazards 5 (1): 35–45. doi:10.1016/j.hazards.2004.02.001.
- Kuang, D., and K. H. Liao. 2020. “Learning from Floods: Linking Flood Experience and Flood Resilience.” Journal of Environmental Management 271: 111025. doi:10.1016/j.jenvman.2020.111025.
- Liao, K. H. 2014. “From Flood Control to Flood Adaptation: A Case Study on the Lower Green River Valley and the City of Kent in King County, Washington.” Natural Hazards 71 (1): 723–750. doi:10.1007/s11069-013-0923-4.
- Liao, Z., Y. Chen, W. Li, and P. Zhai. 2021. “Growing Threats from Unprecedented Sequential Flood‐hot Extremes across China.” Geophysical Research Letters 48 (18): e2021GL094505. doi:10.1029/2021GL094505.
- Luo, S., Y. C. Zhou, and Y. P. Zhang. 2018. “Experimental Study on Performance and Its Influence Factors of Green Roof on Stormwater Management.” Journal of Zhejiang University (Engineering Science) 52 (5): 845–852. doi:10.3785/j.1008-973X.2018.05.004.
- Manfredo, M. J., and A. A. Dayer. 2004. “Concepts for Exploring the Social Aspects of human–wildlife Conflict in a Global Context.” Human Dimensions of Wildlife 9 (4): 1–20. doi:10.1080/10871200490505765.
- Marshall, N. A., Marshall, P.A., Tamelander, J., Obura, D., and Cinner, J.E. 2010. “A Framework for Social Adaptation to Climate Change: Sustaining Tropical Coastal Communitites [Sic] and Industries.” IUCN.
- Martin-Breen, P., and J. M. Anderies. 2011. Resilience: A Literature Review Bellagio Initiative. Brighton, UK: IUCN (International Union for Conservation of Nature).
- McClymont, K., D. Morrison, L. Beevers, and E. Carmen. 2020. “Flood Resilience: A Systematic Review.” Journal of Environmental Planning and Management 63 (7): 1151–1176. doi:10.1080/09640568.2019.1641474.
- Mike Flood. Accessed 22 May 2022. https://www.mikepoweredbydhi.com/products/mike-flood
- Morschek, J., R. König, and S. Schneider. 2019, April. “An Integrated Urban Planning and Simulation Method to Enforce Spatial Resilience Towards Flooding Hazards.” Proceedings of the Symposium on Simulation for Architecture and Urban Design. 1–8. doi:10.5555/3390098.3390108.
- Mukkavaara, J., and M. Sandberg. 2020. “Architectural Design Exploration Using Generative Design: Framework Development and Case Study of a Residential Block.” Buildings 10 (11): 201. doi:10.3390/buildings10110201.
- Pechlivanidis, I. G., B. M. Jackson, N. R. Mcintyre, and H. S. Wheater. 2011. “Catchment Scale Hydrological Modelling: A Review of Model Types, Calibration Approaches and Uncertainty Analysis Methods in the Context of Recent Developments in Technology and Applications.” Global NEST Journal 13 (3): 193–214. doi:10.30955/gnj.000778.
- Peffers, K., T. Tuunanen, C. E. Gengler, M. Rossi, W. Hui, V. Virtanen, and J. Bragge. 2006. “The Design Science Research Process: A Model for Producing and Presenting Information Systems Research.” 1st International Conference, DESRIST 2006 Proceedings. Claremont, CA, USA. 83–106. http://urn.fi/URN:NBN:fi:jyu-201904092111
- Pistrika, A. 2010. “Flood Damage Estimation Based on Flood Simulation Scenarios and a GIS Platform.” European Water 30: 3–11. Acceesed 22 May 2022. http://www.ewra.net/ew/pdf/EW_2010_30_01.pdf
- Proverbs, D., and J. Lamond. 2017. “Flood Resilient Construction and Adaptation of Buildings.” Oxford Research Encyclopedia of Natural Hazard Science. doi:10.1093/acrefore/9780199389407.013.111.
- Restemeyer, B., J. Woltjer, and M. Margo van den Brink. 2015. “A strategy-based Framework for Assessing the Flood Resilience of cities–A Hamburg Case Study.” Planning Theory & Practice 16 (1): 45–62. doi:10.1080/14649357.2014.1000950.
- Simmons, M. T., B. Gardiner, S. Windhager, and J. Tinsley. 2008. “Green Roofs are Not Created Equal: The Hydrologic and Thermal Performance of Six Different Extensive Green Roofs and Reflective and non-reflective Roofs in a sub-tropical Climate.” Urban Ecosystems 11 (4): 339–348. doi:10.1007/s11252-008-0069-4.
- Sultana, S., and Z. Chen. 2007. “Modeling of flood-related Interdependencies among Critical Infrastructures.” Geomatics Solutions for Disaster Management Springer, Berlin, Heidelberg:369–387. doi:10.1007/978-3-540-72108-6_24.
- White, G. F. 1942. Human Adjustment to Floods: A Geographical Approach to the Flood Problem in the United States. United States: University of Chicago.
- World Bank. 2021. “A Catalogue of Nature-Based Solutions for Urban Resilience.”
- Zevenbergen, C., B. Gersonius, and M. Radhakrishan. 2020. “Flood Resilience.” Philosophical Transactions of the Royal Society A 378.2168: 20190212. doi:10.1098/rsta.2019.0212.