
ABSTRACT
The supply of public rental housing for young households has been on the rise in South Korea. Their size and composition vary depending on residents’ characteristics. However, even within similar groups, housing satisfaction may differ according to their lifestyle; hence, diversity may exist in the demand for housing improvement. This study identified housing satisfaction and improvement demands according to housing lifestyles of young residents of “Happy House”, a representative public rental housing for young households. The method used in this study was an online survey targeting individuals younger than 39 years and living in Happy Houses. A total of 536 responses were collected, and the respondents were divided into five housing lifestyle clusters despite being from similar groups. Depending on the lifestyle, differences existed in the satisfaction of space composition and size and basic options, such as facilities/furniture/home appliances. In addition, there were also differences in the demand for housing improvements. The group actively using housing for leisure, cultural activities, and social exchanges showed high demands for improvement, such as space composition and basic options. This study can be used as a reference for establishing a housing improvement plan for customizable public rental housing, considering the lifestyles of young adults.
1. Introduction
As the global economic downturn continues and labor market problems become more serious, the youth have become the most vulnerable group in the labor market (Tanveer, Marelli, and Signorelli Citation2012; Junankar Citation2015). Young people with a weak economic foundation due to unstable employment experience the complex problem of high housing costs required to secure housing necessary for their independence (Berrington and Stone Citation2014; Milić and Zhou Citation2018). Unlike older generations, which are already securing self-home housing, young people who need to secure homes are in a hierarchy that increases the burden of housing costs due to the rise in housing prices. These problems not only negatively affect their quality of life, but they also postpone their independence and marriage, leading to lower fertility rates and other social issues (Presidential Committee on Ageing Society and Population Policy, Citation2020). In particular, the coronavirus (COVID-19) pandemic, which occurred at the end of 2019 and created a global pandemic, has been recognized as another major cause of delays in independence, marriage, and childbirth among young people (Achdut and Refaeli Citation2020; Yukich et al. Citation2021). In South Korea (henceforth, Korea), the number of marriages and the total fertility rate have been continuously decreasing since 2012 (Korea Statistics Citation2021a, Citation2021b), and the low birth rate problem is more serious than in any other world country. Accordingly, the Korean government has strengthened policy support for young adults to overcome these problems. Among them, in the case of the housing sector, it has accelerated the expansion of housing support through the supply of youth housing and loan support (Office for Government Policy Coordination, Citation2020). A major example of housing policy support for young adults is the provision of public rental housing. The government expanded the supply of public rental housing with the “Happy House,” which is young adult-focused public rental housing. The house was first introduced in 2015 and has been studied since its launch in 2017. These studies have solely focused on Happy Houses in certain regions, identified their spatial characteristics, or conducted post-occupancy evaluations, including housing satisfaction (Shin et al., Citation2020, Noh and Jin, Citation2018, Song et al., Citation2018). Previous studies revealed that although Happy Houses are public rental homes tailored to young adults, residents’ overall satisfaction was slightly above average. Therefore, it is necessary to consider young adults’ lifestyles and their preferences to improve space (Mo et al., Citation2013, Kwon et al., Citation2016). However, when planning customized spaces for Happy Houses, it is essential to consider the characteristics, including the number of household members and types of households, such as university students, those just starting their careers, and newlyweds. Similarly, there may be various housing needs within the same age group and family lifecycle stages, which must also be considered. Accordingly, studies have focused on the post-occupancy evaluation of Happy House residents concerning their housing satisfaction based on sociodemographic characteristics or the previous housing type (Shin et al., Citation2020, Noh and Jin, Citation2018, Song et al., Citation2018). However, multiple studies have expressed the need to consider residents’ lifestyles to provide customized housing plans for young adults (Lee and Oh, Citation2019, Lim et al., Citation2019). As lifestyle greatly affects activities in homes, which will affect housing satisfaction or the need for improvement, it is important to identify the improvement needs of houses considering lifestyle types. Limited studies exist against this backdrop, focusing on housing preferences or satisfaction levels of young adult households based on lifestyle types. However, unlike previous studies, this study focused on Happy Houses to identify housing satisfaction and the need for improvement according to the lifestyles of young residents. The study participants were residents of Happy Houses across Korea. This is unique in suggesting housing improvement measures based on lifestyle types. The study results may be used as basic data to devise spatial improvement measures for Happy Houses as rental housing tailored to young adults, considering the lifestyle of young residents.
2. Literature review
2.1. Trends in previous studies on housing for young adults
The trend of previous studies related to housing demands for young adults can be divided into (1) studies dealing with housing consciousness and behavior, such as housing satisfaction, targeting general housing where young adults live; and (2) studies dealing with spatial characteristics of youth housing or spatial demands of young adults, which are summarized as follows.
First, some studies have determined the housing consciousness and other conditions of young adults, including housing satisfaction. Thus, Lee and Jee (Citation2021) classified the housing consciousness of young households as greatly affected by the COVID-19 pandemic due to poor housing conditions. They suggested changes in housing activities to develop young adult targeted housing programs after the pandemic. To this end, the study conducted an online survey of 600 households, whose residents were 20–39 years old. Consequently, the respondents were classified into four attentional clusters. Across the clusters, there were differences in the characteristics of the respondents, activities in the dwelling, and changes in living behavior due to COVID-19. Jang et al. (Citation2022) identified the qualitative and quantitative levels of housing characteristics, including the physical state of housing, its costs, and the physical housing environment and analyzed how these affect young adults’ quality of life by conducting a survey of 280 independent young households. The results showed that overall satisfaction with the physical characteristics of housing, physical characteristics of the residential environment, and burden of housing expenses had an effect on the quality of life of young households. Among them, satisfaction with physical characteristics had the greatest influence, and this study shows that the consideration of physical characteristics is important for improving the quality of life of residents living in young households. In addition, Noh and Jin (Citation2018) conducted a housing satisfaction survey with about 1300 residents in public rental housing, including Happy Houses in Gwangju and the Jeollanam-do area, examining the satisfaction levels based on housing sizes and ownership types, rent and public facilities, and commute time. The study found that the difference between the size of the desired house and that of the current house was larger than that of other types of rental housing, indicating that the size of the house was a problem. In addition, when the size of the house was larger than that of the existing house, housing satisfaction was higher. Therefore, it can be confirmed that the size of the house is an important variable in the satisfaction of residents with Happy Housing. Milić and Zhou (Citation2018) surveyed 350 Serbian youth aged 20–35 years regarding housing satisfaction. The authors found that households with higher housing satisfaction had higher satisfaction with housing accessibility, preference for housing characteristics, and attachment to neighbors as well. In other words, housing satisfaction can be improved when housing that considers the preferences of young households is supplied, and this is a study that explains that in addition to the characteristics of the housing itself, locational characteristics and relationships with neighbors can affect housing satisfaction.
Second, similar to this study, some studies have focused on the spatial characteristics and needs of young adult-targeted housing. Lee and Eom (Citation2018) examined young adults living alone to identify the spatial demands of shared housing. These included their preferences for basic housing installations, additional installation spaces, and shared spaces and facilities. Lim et al. (Citation2019) focused on the design preferences and needs of young adults who live alone. As young adults living alone spend time in their bedrooms or living rooms, this must be considered in housing designs. They also suggested expanding the living room, where young adults participate in various activities, and adding walk-in closets to the bedroom and other storage spaces. Shin et al. (Citation2020) identified the spatial characteristics of Happy Houses and the need for improvement among residents. Improvements were required to meet the satisfaction levels of the location, surrounding environment, and internal space of Happy Houses. The internal space was focused on the area, noise, light, kitchenware, and bathroom facilities. The study suggested improvement measures based on these findings. Baek and Kim (Citation2022) surveyed a total of 595 young people aged<39 years living in shared housing and analyzed the factors affecting their housing satisfaction. It was found that the physical, emotional, social, and beneficial characteristics of shared housing affected residents’ housing satisfaction. This result shows that even in the case of a shared house, not a general independent house, it needs to be planned considering its detailed properties.
The literature revealed various types of housing ownership by young adults, from owning to renting a house, and various housing types, from general to shared. Housing characteristics affect satisfaction and quality of life. However, multifaceted research on housing satisfaction has been affected by characteristics such as gender, age, occupation, and lifestyle. Several studies have examined housing satisfaction among young adults. However, limited research has focused on the satisfaction levels and needs for the improvement of young adults living in Happy Houses. While housing improvement needs in the past have been dealt with mainly based on individual socio-demographic characteristics or economic characteristics, in this study, even in the case of groups with similar characteristics, there were differences in lifestyle, and the corresponding improvement needs were identified. However, there was a difference.
2.2. Studies on housing lifestyle
Lazer introduced the concept of lifestyle to the American Marketing Association in 1963, which has since been actively used. Lazer (Citation1963) defined lifestyle as “a distinctive or characteristic mode of living in its aggregative and broadest sense, of a whole society or segment thereof.” In the field of housing studies, the concept was incorporated from the 1960s to 1970s with studies on selecting housing locations in the United States (Thorkild, Citation2006). Lifestyle has become an important factor that affects housing consciousness, including housing preferences, satisfaction levels, and sociodemographic characteristics (Kwon et al., Citation2016). There are many ways to analyze lifestyles. In housing studies, Activity, Interest, and Opinion (AIO) is commonly used for analysis. AIO is effective because it reflects various factors regarding housing, including consumption patterns, interests, and values, concerning general aspects of life.
Housing lifestyle studies have focused on the lifestyle of particular groups, including young adults, pre-old age, and those living in apartments (Kwon et al., Citation2016, Lee et al., Citation2007) or housing preferences based on lifestyle. Regarding housing preferences, many studies have focused on housing type, location, or both as well as lifestyle characteristics concerning housing plans. Lee and Oh (Citation2019) classified the lifestyles of young adults and newlyweds in Korea and identified the housing sizes, types, and preferred plane structures. They classified the housing lifestyles of young adults into information oriented, uniqueness seeking, future oriented, self-development, and practicality oriented, and analyzed housing preferences accordingly. They revealed that people with all lifestyle types preferred to live in apartments, but the uniqueness-seeking types preferred “officetels” (buildings combining offices and hotels). In contrast, the information-oriented type preferred detached housing. Future-oriented types preferred large housing, whereas the uniqueness-seeking types did not have clear preferences for size. The future-and-practicality-oriented types preferred a plane structure with an expanded living room, while the information-oriented and uniqueness-seeking types preferred a plane structure with expanded bedrooms. Lee et al. (Citation2014) classified the lifestyles of those in their 20s and 30s and living alone as students and workers. They studied the differences in their preferences for shared housing. As the students preferred a convenient diet, they enjoyed instant food. Furthermore, they had a low demand for their own houses and wanted a convenient urban housing environment close to public transportation, with a heavy focus on leisure activities. In contrast, workers spent more money on leisure activities than did students who were interested in their diet. For instance, they used pretty plates even when eating at home. Moreover, they have little desire to own a house and focus more on its internal structure and functional convenience than on its size. Yun (Citation2019) analyzed the relationship between lifestyle types and housing preferences of one-person households in Busan, Korea. Although the study was conducted in one-person households, 96% of the participants were in their twenties and thirties; thus, it can be said that this study focuses on young adults living alone. The study classified housing lifestyle types as follows: extroverted unique, passionate challenger, and success-focused hardworking. Items of housing satisfaction included internal area, building facilities, external environment and factors, and installations. The findings revealed distinctive preferences for all lifestyle types for bathroom size and the direction of the windows. The passionate challenger and success-focused hardworking types showed high preferences for proximity to medium- or larger-sized hospitals, and the passionate challenger type showed preferences for induction cooktops within the home.
Although multiple studies exist on lifestyle and focusing on young adults, there are various ways to classify lifestyles depending on the purpose of the study. Furthermore, there are differences in housing preferences according to lifestyle types. Unlike previous studies, this study focused on the lifestyles of young adults living in Happy Houses to emphasize the need to consider lifestyles when devising improvement plans for Happy Houses. Furthermore, we comprehensively investigated the relationship between lifestyle, need for improvement, and satisfaction levels with current housing.
2.3. Spatial characteristics of happy houses
Representative types of constructed-type public rental housing supplied in Korea include permanent rental houses, national rental houses, and happy houses. Permanent rental houses, which have the longest history, are mainly supplied to beneficiaries, can be lived in for up to 50 years, and are supplied at a very low cost of 30% of the market price (Korea Land and Housing Corporation, Citation2022a). In contrast, the national rental houses are targeted to the second-level class, which has more income than that, can be residents for up to 30 years, and can be occupied at 60%–80%of the market price. The size of national rental houses is 60 m2, which is larger than that of permanent rental houses (40㎡). Unlike other rental types, Happy Houses show a difference in the increase in income standards and are mainly supplied for certain classes such as college students, newlyweds, and young people. Consequently, happy houses are built and supplied near workplaces, schools, and public transportation. The criteria for net leasable area and rental costs are similar to those of the national rental houses, but the actual housing size is smaller than the national rental houses. As of 2020, there are 89,000 Happy Houses in Korea and 9.1% of all long-term public rental housing. Furthermore, 31000 Happy Houses were provided, exceeding 61.6% of the year’s housing supply, consuming a large share of housing (Ministry of Land, Infrastructure, and Transport, Citation2020).
The Happy Houses varied in size from 14㎡ to 55㎡. The major types of sizes are 16㎡, 26㎡, 36㎡, and 44㎡, which have been sustainably supplied on a similar scale since it is provided (Ha and Kim, Citation2020) (). The 16㎡ and 26㎡ houses are generally provided to young adults living alone, including those beginning their careers, seeking employment, and university students. Furthermore, newlyweds were provided in 36㎡, 44㎡, and 55㎡ houses, respectively. However, if there are insufficient applicants, young adults living alone can also enroll in houses that are 36㎡ years old and larger. According to Ha and Kim (Citation2020), the sizes of Happy Houses were 14㎡, 26㎡, 36㎡, and 43㎡ for one-, two-, three-, and four-person households, respectively. However, the average house sizes were 31㎡ and 66.5㎡ for young adults living alone and newlyweds, respectively, which is 1.5 to 1.8 times larger than the minimum level set by the government (Kim, Citation2019).
Figure 1. Examples of Happy Houses.
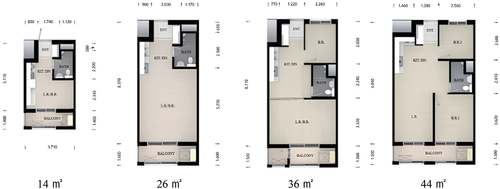
In terms of the actual composition of their sizes, the 16㎡ houses are generally studio-type houses with separate entrances, kitchens, dining and living rooms, bedrooms, bathrooms, and balconies. Some houses provide a sliding door between the living room and kitchen to create a makeshift bedroom. Some 26㎡ houses are studio-type houses, such as 16㎡ houses, and there are also one-bedroom houses that separate the bedroom from the living room. Of the 36㎡ houses, there was a bedroom, and they had larger kitchens or dining rooms than those of the 26㎡ houses. There were two bedrooms in 44㎡ houses with a living, dining, and kitchen structure, with a separate living room connected to the kitchen or dining room. Moreover, the exact composition of houses may vary within the same size depending on the location. A study revealed that houses sized 36㎡ and larger might have up to six plane structures with different locations and room sizes, apart from the kitchen and bathroom (Ha and Kim, Citation2021).
There are also differences in the basic options provided, depending on the size of the house supplied. Happy Houses have shoe storage, kitchenware, and shower facilities at the entrance. However, furniture and appliances, including desks, bookshelves, and refrigerators, are only provided in small houses (less than 26㎡) for university students and young adults living alone. However, some have gas cooktops in houses sized 36㎡ or larger; hence, the options provided may vary.
There are no distinct characteristics in the interior designs of Happy Houses. Generally, all houses use light brown vinyl linoleum for flooring and white silk wallpaper.
3. Materials and methods
3.1. Developing the survey questionnaire
This study categorized the housing lifestyle of young adults and newlywed couples living in public rental housing and identified differences in housing satisfaction and demands for improvement. First, a housing lifestyle research tool was developed using the “AIO Analysis” theory based on the housing studied (Kwon et al., Citation2016, Lee et al., Citation2007, Moon and Lee, Citation2019). Another relevant study of Kim and Jang (Citation2021) was referred to reflect the characteristics of the housing lifestyle of young adults and newlyweds. However, there were many items initially, which were later revised and omitted based on the study objectives. The developed survey items comprised 23 items, with eight items on daily life activities in the housing setting and 15 items on the level of interest and thoughts regarding the housing setting. Each item was measured using a five-point Likert scale, ranging from 1 (highly disagree) to 5 (highly agree) ().
Table 1. References for developing the housing lifestyle items.
Also, some previous studies were reviewed to identify the differences in housing satisfaction and demands for improvements. Based on the literature (Lim et al., Citation2019, Lee and Oh, Citation2019), the actual composition of the house, its usable area, its basic options (appliances, furniture, equipment), and interior design were selected to develop the survey items. The housing satisfaction level and demands for improvement were used as survey items. Each item was based on a five-point Likert scale. Furthermore, to identify the demands in detail, additional detailed items were developed. The final version of the survey used the sociodemographic, economic, and physical characteristics of the current house ().
Table 2. Composition of the questionnaire.
3.2. Research participants and methods
The survey participants comprised young adults and newlyweds residing in public rental housing called Happy Houses. Although older adults and general low-income households also reside in Happy Houses, the participants were limited to young adults aged 19–39 and newlyweds who have been married for no longer than 10 years. A pre-survey of 20 people from the public with similar characteristics as the young adults and newlyweds living in Happy Houses and those majoring in housing was conducted. In the pre-survey, participants had to fill out the house area exclusively in either pyeong (1 pyeong = 3.3 m2) or m2. The results revealed that participants did not answer using the unit or made mistakes by getting the unit confused with the area size unit. Therefore, to ensure consistent data collection on house size, the survey was edited so that the participants respond in m2. Also, the logical errors of optional items depending on the characteristics of the participants and slight changes to the wording were made to complete the tool. Based on the developed tool and the research plan, the survey was conducted after attaining approval from the research ethics committee of the affiliated institution (anonymized for the review).
An online survey was used for this study. With the cooperation of the supply organization of Happy House, information on the questionnaire was attached to the apartment complex. As there may be regional differences in housing satisfaction and the demand for improvement, the number of complexes asked to participate was selected by the number of households in a complex. This ensured similar numbers of participants from Greater Seoul and other regions. In addition, most of the chosen Happy House complexes were built after 2018, ensuring the deterioration of the houses was similar. After collecting a certain number of responses from the complexes to match the number of participants by region, more data were collected from online communities of those living in Happy Houses and those who wish to live in Happy Houses. A total of 753 responses were collected, and 536 were analyzed after eliminating invalid responses or those who did not fall under the inclusion criteria. Of the valid responses, 92.6% were from the apartment complexes, and the response rate of the distributed surveys was approximately 4.4%.
The collected data were analyzed using the SPSS 22.0 statistics program. Descriptive statistics were used to analyze the participants’ general characteristics and those of the current houses. Housing lifestyle types were analyzed using factor and cluster analyses. Lastly, the chi-square test and analysis of variance were used to analyze differences in housing satisfaction and demands for improvement in housing environments per the housing lifestyle types.
4. Results
The analysis results were organized according to the participants’ general characteristics, characteristics of the current houses, housing lifestyle types, housing satisfaction, and demands for improvement by lifestyle types.
4.1. Participants’ general characteristics
The general characteristics of the participants were analyzed for the householder. First, 57.8% of the householders were women, 15.6% higher than men. The average age of the householder was 30.19 years, and 51.3% of the householders were 30 and older, which was more than those younger than 30. The most common occupation among the householders was from the general economic activity sector, including office workers, entrepreneurs, and self-employed, at 87.3%. There were 4.7% students and 8.0% unemployed participants. The average number of people in the household was 1.45, as more than half (61.2%) were one-person households. About 33.4% of the participants responded that they were a two-people household, among which 77.1% were couples with no children, 11.2% were brothers and sisters, 9.5% were friends, and 2.2% were others. Three-people households comprised 4.9% of the participants and were generally couples with children. The average monthly income was considered to understand the participants’ economic characteristics. The income was analyzed using the income standards by the household members based on the 100% level of the average monthly income of urban households in 2021. On average, the participants had a monthly income of KRW 3.1625 million. More than half (53.7%) responded that their monthly income was KRW 2.99 million or under. Even though more than half of the participants were one-person households, there were relatively more households with a lower income than the average monthly income of one-person households. Participants had a monthly income of over KRW 2.99 million to KRW 4.56 million or less (27.4%), the standard for two-people households. Considering two-people households took up 33.4% of the participants, this shows that the participants generally had lower than average income. Lastly, 16.6% of the participants had a monthly income of more than KRW 4.56 million ().
Table 3. General characteristics of the participants.
4.2. Characteristics of the participants’ current houses
The analysis of the characteristics of the Happy House, where the participants resided, revealed that 59.3% of the houses were in the Greater Seoul region (Seoul, Gyeonggi-do, Incheon). The percentages of responses from those living in metropolitan cities, Sejong, and other regions were equal at 20.3%. The average house size was 33.02 m2. The house was divided into sections using the size standard by the number of people per the minimum standards in housing to analyze the housing size. Hence, the most common size was houses that were 36 m2 and over, suitable for households with three or more people, with 59.7%, followed by houses that were 26 to under 36 m2 with 21.5%. The average number of bedrooms was 1.94. The proportions of responses from those living in a studio-type apartment and a two-bedroom apartment were similar at 35%, and 29.3% of participants lived in three-bedroom apartments. Most participants (98.5%) responded having one bathroom. Lastly, the participants had resided in their houses for an average of 11.74 months. More than half of the participants (58.5%) responded that they had resided in the current house for less than a year, and 35.9% were reportedly residing for more than a year but less than two years ().
Table 4. Characteristics of the current houses of the participants.
4.3. Housing lifestyle types of the participants and the characteristics of each type
4.3.1. Housing lifestyle factors of the participants
There was an analysis on the results of the AIO items on housing lifestyle. First, the averages and the bias were analyzed to verify the normality of the responses. Eight items on daily life activities showed an average of a minimum of 1.50 to a maximum of 4.28 out of five. The item with the highest average among the eight items was “I generally shop online” (4.28), followed by “I frequently watch movies or listen to music at home” (4.12). Only these two factors had an average of over four. The responses to 14 items on interests and opinions generally had higher averages than the items related to daily life activities. The item with the highest average was “I want a house where I can rest comfortably”(4.89), which was close to five, and 11 items, including “I want a house where I will not be distracted by neighbors,” had an average of over four. Second, descriptive statistics was used to select only the items with a certain level of normality. Hence, five items, including “I frequently take baths in the tub,” which had the lowest score among the daily life activities items, “I want a house that is easy to keep clean,” and “I want a house where I can rest comfortably” from the interest and opinion items were removed as the concentration level of a certain response exceeded 70% ().
Table 5. Analysis of housing lifestyle.
Third, there was a factor analysis using the 17 housing lifestyle items that passed the normality standard. Principal Components Analysis and Varimax were used for the analysis. After the analysis, four items, including “I frequently study or work at home,” “I generally shop online,” and “My house should have the latest technology,” were removed as the commonality for these here items was less than 0.4. Another factor analysis was conducted afterward with 14 items. Hence, housing lifestyle factors were classified into five factors. The total cumulative variance of the factors was 60.726, resulting in an explanation power exceeding 60%. The KMO (Kaiser-Meyer-Olkin) value of the selected factor solution was 0.653, showing an appropriate sample fit. The significance level of the chi-square test from Bartlett’s test of sphericity test was less than 0.001, verifying the statistical appropriateness. Furthermore, as the commonality was at a minimum of 0.497 to a maximum of 0.741, the relative contribution level of individual factors was also high.
Regarding the five factors, Factor 1 comprised three items. It had an explanation power of 13.712% for all variables. Factor 1 was named “Basic Living” as it included basic lifestyle factors, including eating or sleeping. This factor’s reliability (Cronbach’s α) was 0.665. Factor 2 comprised three items and had an explanation power of 13.369% for all variables. Factor 2 was named “Engagement Activities” as it included engagement with neighbors and family members and expanding the family in the long term (Cronbach’s α = 0.554). Factor 3 comprised three items. It was named “Home Styling” as it related to a lifestyle that prefers aesthetic houses and wishes to decide the interior design of the houses. Factor 3 had an explanation power of 12.606% and a reliability of 0.588. Factor 4 comprised four items. It included a lifestyle that prioritized watching movies, listening to music, exercising or participating in other leisure activities, and joining parties. Accordingly, this factor was named “Leisure Activity,” and its explanation power was 10.952% (Cronbach’s α = 0.463). Lastly, factor 5 comprised two items, with an explanation power of 10.087% (Cronbach’s α = 0.458). This factor included a lifestyle that emphasized a life with animals or plants, and so was named “Living with Companions” ().
Table 6. Analysis of housing lifestyle factors.
4.3.2. Housing lifestyle cluster of the participants
Based on the results of the factor analysis, there was a cluster analysis using the standardized scores of each factor. After the hierarchical cluster analysis, three to six cluster solutions were identified based on a dendrogram. Then, using K-means cluster analysis, the characteristics of each cluster solution were analyzed. The results revealed that five cluster solutions would be most appropriate for this study’s purpose and have appropriately distributed housing lifestyle factors in each cluster. Hence, these five clusters were confirmed as the final clusters. Afterward, there was an F test on the standardized scores of the factors of each cluster. It revealed statistical significance among the five clusters and the five factors (p < 0.001).
The characteristics of the five clusters were as follows. Cluster 1 comprised the households that actively used all parts of the house to participate in engagement and leisure activities, apart from the basic housing activities. This cluster was named “Actively Using.” Cluster 2 had more interest in the house itself and decorated it by their tastes rather than being interested in particular housing activities. This cluster was named “Self-Expression.” Cluster 3 was also interested in decorating their houses like Cluster 2 but was focused on basic housing activities, such as eating and sleeping. They wished for a stable personal life by engaging with animals or plants. This cluster was named “Personal Activity.” Cluster 4’s lifestyle prioritized engagement with others, including friends or family, or plants or animals, over their lives. This cluster was named “Engagement-Focused.” Lastly, Cluster 5 had relatively less interest in all five factors, particularly decorating their houses. These households accepted the conditions of the house that was handed over to them and engaged in minimal housing activities. This cluster was named “Minimally Using” ().
Table 7. Analysis of standardized scores of each factor by clusters.
4.4. Characteristics by housing lifestyle clusters
4.4.1. General characteristics by housing lifestyle clusters
The differences in general characteristics by housing lifestyle clusters were analyzed. The results revealed that besides the ages and educational levels of the householders, all characteristics showed statistically significant differences by clusters. That is, there were similar characteristics across all clusters, as many participants were younger than 30 and had graduated from two- or four-year universities. The differences in the major characteristics by cluster are as follows.
First, many householders in the “Actively Using” cluster participated in economic activities, and this cluster had more households with two or more people or couples than other clusters. Many households in this cluster had relatively high monthly incomes that fell under the appropriate amount of household income with three or more people. That is, the households had more than two people and high income. Hence, their lifestyle focused on family and other leisure activities. The “Self-Expression” cluster had relatively more women student householders than other clusters and the highest proportion of one-person households. Their incomes matched with one-person households. That is, as women living alone are the major type of household in this cluster, they focused on using the house to self-express rather than for leisure activities or engaging with others. The “Personal Activity” cluster had the largest portion of women householders than any other cluster and many unemployed householders. It had the second-most one-person households, followed by the “Self-Expression” cluster, with some two-people households. The income of this cluster fell more in the one-person household category than the “Self-Expression” cluster and had relatively few households with high income. That is, this cluster mostly comprised women in one- or two-people households, who were not likely to participate in economic activities. They were relatively more economically vulnerable than other clusters. Therefore, their lifestyle included basic activities, such as eating and sleeping, which did not cost much, or living with animals or plants. Households in the “Engagement-Focused” cluster had more householders where the men participated in economic activities than other clusters. These households comprised married couples with two or more people in the household. There were households that fell under the income bracket for two-people households, and relatively more households fell under the three-people household income bracket. That is, the households in this cluster had a certain income level and enjoyed married life. Although they prioritized family bonding time, they were relatively less interested in leisure activities like the “Actively Using” cluster. Lastly, the “Minimally Using” cluster had the greatest number of households with a man householder who participated in economic activities. This cluster mostly comprised one-person households or households with married couples without children. Accordingly, many households in this cluster responded that their incomes fell under the one-person to two-people household income brackets. That is, this cluster can be defined as a one-person household engaged in economic activities or newlywed couples with relatively less interest in houses and participation in minimal housing activities ().
Table 8. General characteristics by housing lifestyle cluster.
a Only valid responses were analyzed
4.4.2. Characteristics of the current houses by housing lifestyle cluster
There was an analysis to identify the differences in the characteristics of the current houses by housing lifestyle cluster. The results revealed that apart from the number of bathrooms and the length of residence, all characteristics showed statistically significant differences by lifestyle cluster. In all clusters, the most common number of bathrooms was one, and the most common length of duration was 1 year or less. The differences in the major characteristics by cluster are as follows.
First, for the “Actively Using” cluster, there were relatively more households in the Greater Seoul region, and the cluster had the least proportion of households living in the province areas. The cluster had the most proportion of houses that were 36㎡ or more and had the relatively less proportion of households living in houses that were 26 m2. As they lived in relatively larger houses, the greatest number of households replied they lived in a three-bedroom house. Among all clusters, this cluster had the smallest proportion of households living in studio apartments. As seen from the sociodemographic characteristics, many households in the “Actively Using” cluster are married couples with two or more people in the household. The most common place of residence for the “Self-Expression” cluster was metropolitan cities and Sejong. They resided in houses with a size of less than 26 m2. Therefore, the most common house type was a studio. This may be because there were relatively more students in the “Self-Expression” cluster than in other clusters with more one-person households. Among all clusters, the “Personal Activity” cluster had the highest proportion of households living in the Greater Seoul region. Although many households resided in houses that were 36 m2 or larger, compared with other clusters, there was a higher proportion of households living in houses that were 26 m2 or smaller. This cluster also had many one-person households, with a high proportion of students or the unemployed, who did not engage in economic activities. This may have led to a greater proportion of households living in the smallest houses than in other clusters. A large proportion of the“Engagement-Focused” cluster lived in the Greater Seoul region. Although there were slight differences, the regional distribution of this cluster was like that of the “Actively Using” cluster. A large proportion of households in the “Engagement-Focused” cluster lived in houses with a size of 36 m2 or more and two rooms. As there were many households with two or more people like the “Actively Using” cluster, many households lived in larger houses. Lastly, although a large proportion of households in the “Minimally Using” cluster lived in the Greater Seoul area, there was also a large proportion of those living in the province area than in other clusters. Many households in this cluster lived in houses sized 36 m2 or more. This cluster had the highest proportion of houses with two or more rooms ().
Table 9. Characteristics of the current houses by housing lifestyle cluster.
4.4.3. Housing satisfaction by housing lifestyle cluster
There was an F test to identify the differences in the satisfaction levels in the current houses by housing lifestyle clusters. The results revealed statistically significant differences in satisfaction with the space composition of the house, house size, and basic provided equipment, furniture, and appliances by cluster. That is, no difference existed in the overall satisfaction and the interior design by cluster. To analyze the differences in the clusters with differences in the satisfaction level, there was a Duncan post hoc test. “Personal Activity” and “Engagement-Focused” clusters showed differences in the satisfaction levels in the space composition. The “Personal Activity” cluster showed an average satisfaction level of 3.61 for the space composition, higher than the “Engagement-Focused” cluster. This may be because the “Personal Activity” cluster had a high proportion of one-person households, but many houses were 36㎡ or more in size with three rooms. Approximately half of this cluster lived in such two-bedroom houses, leading to high satisfaction levels with relatively more space. Although there were many one-person households in the “Engagement-Focused” cluster, there were relatively more households with married couples. This may have led to low satisfaction levels in the space composition. The satisfaction levels in the housing sizes differed between the “Self-Expression” and “Engagement-Focused” clusters, together as a group, and the “Personal Activity” and “Minimally Using” clusters, put together as a group. That is, the “Self-Expression” and “Engagement-Focused” clusters had an average satisfaction level of 2.81, lower than the “Personal Activity” and “Minimally Using” clusters. After analyzing the satisfaction levels in the sizes in detail, 40% or more of the two clusters of “Self-Expression” and “Engagement-Focused” clusters with relatively lower satisfaction levels responded that they were not satisfied with the sizes of the houses. There are relatively more households in the “Self-Expression” cluster living in the provinces. Even though many households in this cluster were one-person households living in a house of 36㎡ or larger, due to the differences in the subjective housing norms in the area in size, they might find their houses small. As the “Engagement-Focused” cluster had more people in the households than the “Self-Expression” cluster and more married households, they showed relatively greater dissatisfaction regarding housing sizes. Regarding the differences in the satisfaction levels in the basic provided equipment, appliances, and furniture, there were differences between the “Minimally Using” cluster and the other three clusters. The satisfaction level of the “Minimally Using” cluster was 3.09, relatively higher than other clusters. Approximately 80% of householders in this cluster responded that they felt neutral, satisfied, or greatly satisfied with the equipment, furniture, or appliances. As the “Minimally Using” cluster participated in minimal housing activities within the house, they were relatively more satisfied with the equipment, furniture, or appliances for the housing activities. However, their highest satisfaction level was just above three, a near neutral, which meant that the other clusters were dissatisfied regarding the equipment, appliances, and furniture ().
Table 10. Differences in satisfaction in the current houses by housing lifestyle.
4.4.4. Demands for improvement in housing environments by housing lifestyle cluster
There was an analysis on the demands for improvement in housing environments by housing lifestyle cluster. The results revealed significant differences by cluster. First, statistically significant differences existed in the general demands for improvement from the “Minimally Using” and “Actively Using” clusters as a group, compared with the “Self-Expression” and “Engagement-Focused” clusters as a group. The “Minimally Using” cluster had an average demand level of 3.13 for all types of improvements, relatively lower than other clusters. The satisfaction levels of the “Minimally Using” cluster in the equipment, appliances, and furniture were relatively higher than those of the other clusters, as the cluster did not use the house as much as the other clusters. Hence, the cluster had relatively fewer demands for the improvement of the housing environment than other clusters. “Actively Using” and “Engagement-Focused” clusters had greater demands for improvement in the space composition of the houses than the “Self-Expression” and “Minimally Using” clusters. The “Personal Activity” and “Engagement-Focused” clusters showed differences in housing satisfaction levels, as the “Engagement-Focused” cluster had lower satisfaction levels. The cluster with lower satisfaction levels had greater demands for improvements in the space composition. The greatest demand for improvement for the “Actively Using” and “Engagement-Focused” clusters was having more rooms, followed by having two bathrooms. The “Actively Using” and “Engagement-Focused” clusters had greater demands for a larger house than the “Minimally Using” cluster. A large proportion of these clusters demanded a large kitchen, dining room, and living room, and more than half demanded larger bedrooms than the present ones. Many households in this cluster also demanded large bathrooms. These clusters participated in various housing activities in the house or had a big affection on their house, which may lead to increased demands for a big house. The “Personal Activity” and “Engagement-Focused” clusters had different levels of demand for improving basic equipment, furniture, and appliances. Like the demand for a bigger house, the “Actively Using” cluster demanded improved equipment, furniture, and appliances. For detailed demands for improvement, the “Actively Using” cluster submitted more demands than the “Personal Activity” cluster. The former submitted 892 detailed demands, while the latter submitted 511. Regarding the demands for basic options of the house, the “Actively Using” cluster had high demands for an improved air conditioner in the living room and induction cooktops and dishwashers in the kitchen. Contrarily, the “Personal Activity” cluster had high demands for induction cooktops in the kitchen but relatively higher demands for refrigerators in the kitchen and washing machines. In the bedroom, the two groups did not differ in their demands for wardrobes and desks. However, in the bathroom, the “Actively Using” cluster had a very high demand for bathtubs, whereas the “Personal Activity” cluster responded with no additional needs. Lastly, a significant difference existed in the demand levels of interior design between the “Self-Expression” and “Minimally Using” clusters as a group and the “Actively Using” and “Personal Activity” clusters as a group. The Self-Expression” and “Minimally Using” clusters had relatively lower demand for improvements in interior design than other clusters. For the two clusters with high demands for improvements in interior design, the highest demand came from improvements in soundproof levels and finishing materials ().
Table 11. Differences in the demands for improvements in the housing environment by housing lifestyle cluster.
5. Discussion
This identified the housing improvement measures by lifestyle types of young adults living in Happy Houses. The results are as follows.
First, although all young adults living in Happy Houses were in their twenties and thirties, we could classify them into five lifestyle types depending on how they used their homes. The first was the “Actively Using” cluster, utilizing the house for leisure, forming relationships with various groups, and basic living purposes. Another cluster was the “Minimally Using” cluster which barely used their houses, and the “Personal Activity” cluster, which focused on using the house for basic living purposes and engaging with their companion animals or pets. The “Engagement-focused” cluster used the houses to engage with others and participate in personal activities, and the “Self-expression” cluster used houses to express themselves. Many young adults in their twenties and thirties lived in Happy Houses, including university students, those beginning their careers, newlyweds, and couples with toddlers. Hence, the young adults in Happy Houses had varying lifestyles. Currently, Happy House considers the number of household members depending on the minimum housing standard provided by the government and the age and sex of children as a standard to apply to each housing size. However, there are various ways that the residents use the house for varied lifestyles. Lifestyles should be considered when planning the composition of Happy Houses.
Second, regardless of lifestyle clusters, residents of Happy Houses generally showed higher-than-average satisfaction levels. However, there were differences in satisfaction levels by lifestyle clusters for the spatial composition, size, equipment/furniture/appliances, and other basic installments. The “Engagement-focused” cluster had lower satisfaction levels than other clusters regarding the spatial composition, size, and basic installation options. It comprised married couples with relatively high incomes living in two-bedroom houses in the Seoul area. They had the lowest satisfaction levels in all areas. “Actively Using” cluster had similar demographic characteristics and used the house for various activities, lived in generally large homes with three bedrooms, or the Seoul area. Those living in the Seoul area were less likely to be satisfied with smaller houses than those living in areas outside Seoul, hence the differences in satisfaction levels. Although the participants lived in houses larger than the minimum standards provided by the government, married couples with high-income levels were not satisfied with small houses with two bedrooms. In rural areas, due to location or housing sizes, Happy Houses are frequently left vacant for a long time. The difference in demand for space between urban and rural areas is a topic that has been discussed extensively. As the differences between urban and rural areas are considered for the sizes of general housing, the regional differences for Happy Houses must also be considered. Moreover, as the residents are more likely to take part in more activities in the house in areas with poor living infrastructure, and those living in Happy Houses have a relatively higher income than those living in other types of public rental housing, it is necessary to increase the area per house and improve the spatial composition standards. There should be more housing models as compared with the present scenario.
Third, there were differences in clusters in their demands for housing improvement of Happy Houses for overall and detailed improvements. All clusters showed higher-than-average demands for housing improvements. The “Minimally Using” cluster, which used homes for some purposes, showed relatively low demands for general and detailed improvements. The “Actively Using” cluster, which used the homes the most, had the highest demands for general and detailed improvements. It is necessary for Happy Houses to be diverse in spatial composition, area, and interior design while considering the residents’ use of housing. Although there is a demand for large houses with varied room compositions and basic options that consider interior design, it may be a viable option to provide the current Happy Houses with various options for interior design, leading to low cost. In the “Self-expression” cluster, those who vested in their houses showed low demands for improvement. Hence, it may be viable to provide various options to the young adults to customize their houses depending on their tastes. The regulations of rental housing must be reviewed, and changes made to the house in the interior design must be changed when returning the house.
6. Conclusion
This study verified that there are differences in demands for housing improvements depending on lifestyle clusters among young adults living in public rental housing. It also showed that there are demands for housing improvements in the Happy Houses which are representative public rental housing the young households. To resolve the housing issues of young adults, the Korean government has expanded policy support in the policy area. As Happy House is used as a major policy support program to resolve the housing issues of the young adults, this study is significant in presenting a post-occupancy evaluation happening six years after the first residents of Happy Houses moved in. There were studies focusing on housing satisfaction or demands for improvement depending on the individual characteristics of the residents, including age, marital status, children, and region. However, this study is unique as no study has focused on housing satisfaction and demands for improvement considering the housing lifestyle types. However, when suggesting detailed demands for improvement for Happy Houses, there need to be practical suggestions for improvement. Future studies are suggested to identify the detailed demands for improvement of residents in the area, size, and basic options of the houses. This study presented an analysis of the status quo of public rental housing from the residents’ perspectives. The results can be used as basic data to identify ways to improve public rental housing for the young adults in the future.
Ethics approval statement
This work was approved by the Research Ethics Committee of Jeonbuk National University (IRB File No. : JBNU 2022-01-013-003).
Disclosure statement
No potential conflict of interest was reported by the authors.
Correction Statement
This article has been republished with minor changes. These changes do not impact the academic content of the article.
Additional information
Funding
Notes on contributors
Miseon Jang
Miseon Jang is an associate professor at the Department of Housing Environmental Design, Jeonbuk National University. Her research focuses on housing policy and planning especially for households with special housing needs, such as the elderly, disabilities and young adults.
Tae-Wan Kim
Tae-Wan Kim completed master’s degree at the Department of Housing Environmental Design, Jeonbuk National University.
Ji-Yun Kim
Ji-Yun Kim is in the master's course at the Department of Housing Environmental Design, Jeonbuk National University.
Hua Zheng
Hua Zheng is an associate professor at the Department of Environmental Art Design at Shanghai Normal University. Her research interests are in the issues around environmental design for disadvantaged groups and spatial behavior.
References
- Achdut, N., and T. Refaeli. 2020. “Unemployment and Psychological Distress Among Young People During the COVID-19 Pandemic: Psychological Resources and Risk Factors.” International Journal of Environmental Research and Public Health 17 (19): 1–21. doi:10.3390/ijerph17197163.
- Baek, J., and S. Kim. 2022. “Effect of Characteristics of Shared Housing in Single-Person Households on Housing Satisfaction and Shared Housing Performance.” Sustainability 14 (22): 1–21. doi:10.3390/su142214906.
- Berrington, A., and J. Stone. 2014. “Young adults’ Transitions to Residential Independence in the UK: The Role of Social and Housing Policy.” In Young People and Social Policy in Europe. Work and Welfare in Europe, edited by L. Antonucci, M. Hamilton, and S. Roberts, 210–235. London: Palgrave Macmillan.
- Ha, M. -H., and J. -M. Kim. 2020. “Possibility of Plan Change by Types of Happy Housing: Focused on with N.J. Habraken Supports System.” Korea Institute of Ecological Architecture and Evironment Journal 20 (5): 81–86. doi:10.12813/kieae.2020.20.5.081.
- Ha, M. -H., and J. -M. Kim. 2021. “Variability in South Korea Housing Unit Plan: Focused on the Cases of Happy Housing by Area.” Korea Institute of Ecological Architecture and Evironment Journal 21 (3): 63–68. doi:10.12813/kieae.2021.21.3.063.
- Jang, M. S., T. W. Kim, and J. Y. Kim. 2022. “A Study on Housing-Related Index Affecting the Quality of Life of Young Households.” Journal of the Korean Housing Association 33 (5): 9–16. doi:10.6107/JKHA.2022.33.5.009.
- Jeon, S. -R., and Y. -S. Kim. 2020. “Factors Influencing Satisfaction on Housing Assistance Programs of Single-Person Households.” Journal of Korean Institute of Spatial Design 17 (3): 179–188.
- Junankar, P. 2015. “The Impact of the Global Financial Crisis on Youth Unemployment.” The Economic and Labour Relations Review 26 (2): 191–217. doi:10.1177/1035304615580536.
- Kang, H. -S., and Y. -S. Park. 2020. “A Study on the Change of Housing Welfare Policy: Focused on the Changes of the Beneficiary of Happy Housing Policy by Applying the Modified Multiple Streams Framework.” Journal of the Korean Housing Association 31 (4): 91–101. doi:10.6107/JKHA.2020.31.4.091.
- Kim, B. C. 2019. A study on adequate housing standards of customized public rental housing for the youth group. Master’s thesis, Gyeongsang National University, Jinju.
- Kim, J. -T. 2022. “Blind Spot and Improvement Plan of Youth Housing Policy.” Urbanity & Poverty 118: 1–10.
- Kim, T. -W., and M. -S. Jang. 2021. “Changes in Housing Behaviors of Young Single Person Households by COVID-19.” Journal of the Korean Housing Association 32 (6): 81–90. doi:10.6107/JKHA.2021.32.6.081.
- Kim, J. -Y., T. -W. Kim, and M. -S. Jang 2021. ‘A Basic Study on Indicator Development to Evaluate the Effects of Housing Policy for Youth Adult and Newlywed Households’. Proceedings of Autumn Annual Conference of Korean Hounsing Association. Korean Hounsing Association, Mokpo, 153–156.
- Korea Statistics. 2021a. Fertility statistics in 2021.
- Korea Statistics. 2021b. “Marriages and Divorces Statistics in 2021.”
- Kwon, H. J., H. -J. Lee, and J. O. Beamish. 2016. “U.S. boomers′ Lifestyle and Residential Preferences for Later Life.” Journal of Asian Architecture and Building Engineering 15 (2): 255–262. doi:10.3130/jaabe.15.255.
- Land, Korea, and Housing Corporation. 2022a. Happy House. Available from: https://www.myhome.go.kr/hws/portal/cont/selectContRentalView.do#guide=RH108 [Accessed 9th October, 2022].
- Land, Korea, and Housing Corporation. 2022b. Tenant recruitment notice of Paju Unjeong District Sannae Village Happy House. Available from: https://www.myhome.go.kr/hws/portal/sch/selectRsdtRcritNtcView.do [Accessed 10th November, 2022].
- Lazer, W. 1963. “Lifestyle Concepts and Marketing.” In Toward Scientific Marketing, edited by S. Greyser, 243–252. Chicago: American Marketing Association.
- Lee, H. -J., G. R. Carucci, and J. O. Beamish. 2007. “Influence of Lifestyle on Housing Preferences of Multifamily Housing Residents.” Housing and Society 34 (1): 11–30. doi:10.1080/08882746.2007.11430542.
- Lee, S. -Y., and S. -C. Eom. 2018. “Analysis on the Housing Needs for Young Adults Living Alone.” Journal of the Korean Institute of Interior Design 27 (2): 77–85.
- Lee, H. -J.&., and E. -Y. Jee. 2021. “Young persons’ Housing Consciousness Clusters and At-Home Activities: Reflecting COVID-19 Situation.” Journal of the Korean Housing Association 32 (3): 83–96. doi:10.6107/JKHA.2021.32.3.083.
- Lee, S. -Y., and M. -W. Oh. 2019. “A Study on Lifestyle Type and Housing Preference for Young Adults and Newely Weds.” Journal of the Korean Institute of Interior Design 28 (5): 125–133. doi:10.14774/JKIID.2019.28.5.125.
- Lee, H., M. -H. Sung, J. -W. Ryu, J. -B. Lee, and K. -S. Lee. 2014. “Architectural Planning Characteristics of Urban Share House for Single-Household.” The Regional Association of Architectural Institute of Korea 16 (3): 1–8.
- Lee, T. -J., S. -H. Woo, and J. -Y. Choi. 2017. “What is the Housing Situation of Young People?” Health and Welfare Policy Forum 244: 38–53.
- Lim, J., I. -Y. Choi, and H. Park. 2019. “A Study on the Residential Environment Preference and Needs of the Multi-Academic Young Single Family Based on Lifestyle.” Korea Science & Art Forum 37 (1): 249–260. doi:10.17548/ksaf.2019.01.30.249.
- Milić, J., and J. Zhou. 2018. “Residential Satisfaction Among Young People in Post-Socialist Countries: The Case of Serbia.” Journal of Housing and the Built Environment 33: 715–730. doi:10.1007/s10901-017-9579-9.
- Ministry of Land, Infrastructure, and Transport. 2020. Housing welfare roadmap.
- Mo, J. -H., S. -J. Kang, O. -J. Kwon, J. -M. Choi, and S. -J. Kim. 2013. “Analysis of the Characteristics of residents’ Preferences on LDK at Small-Sized Apartment According to Lifestyle Types by Housing.” Journal of the The Korean Housing Association 24 (4): 83–96. doi:10.6107/JKHA.2013.24.4.083.
- Moon, S. -H., and H. -J. Lee. 2017. “Young Single-Person Renter households’ Housing Situation and Expectations in Relation to Family Support and Housing Cost Burden Reflected in the 2014 Korea Housing Survey.” Journal of the Korean Housing Association 28 (3): 11–22. doi:10.6107/JKHA.2017.28.3.011.
- Moon, S. -H., and H. -J. Lee. 2019. “Influence on Young persons’ Intention to Participate in Housing Information, Education and Counseling Programs.” Journal of the Korean Housing Association 30 (3): 57–66. doi:10.6107/JKHA.2019.30.3.057.
- Noh, S. -H., and E. -A. Jin. 2018. “Demand Characteristics and Residential Satisfaction Analysis of Public Rental Housing: Focused on Haengbok-Housing and National Rental Housing in Jeonnam, Gwangju.” Journal of the Korean Housing Association 29 (6): 121–132. doi:10.6107/JKHA.2018.29.6.121.
- Office for Government Policy Coordination. 2020. The 1st Basic Plan for Youth Ploicy. Seoul, KoreaOffice for Government Policy Coordination.
- Presidential Committee on Ageing Society and Population Policy. 2020. The 4th Basic Plan for Low Fertility and Aging Society.
- Shin, Y. -J., J. -H. Lim, J. -W. Jeon, and K. -Y. Park. 2020. “The Residential Satisfaction of the Youth Who Live in the Happy Housings.” Journal of Human Ecology 24 (3): 47–64. doi:10.36357/johe.2020.24.3.47.
- Song, B. -R., O. -J. Kwon, and D. -S. Kim 2018. ‘A Study on residents’ Satisfaction of Consumer-Based Happy House: For the Youth Residents of Happy House in Gajwa’. Proceedings of Autumn Annual Conference of Korean Hounsing Association. Korean Hounsing Association, Yongin, 471–474.
- Tanveer, C. M., E. Marelli, and M. Signorelli. 2012. “Youth Unemployment Rate and Impact of Financial Crises.” International Journal of Manpower 33 (1): 76–95. doi:10.1108/01437721211212538.
- Thorkild, Æ. 2006. “Residential Choice from a Lifestyle Perspective.” Housing, Theory and Society 23: 109–130. doi:10.1080/14036090600773139.
- Yukich, J., M. Worges, A. J. Gage, D. R. Hotchkiss, A. Preaux, C. Murray, and C. Cappa. 2021. “Projecting the Impact of the COVID-19 Pandemic on Child Marriage.” Journal of Adolescent Health 69 (6): 23–30. doi:10.1016/j.jadohealth.2021.07.037.
- Yun, I. -S. 2019. A study on the lifestyle and preference of single-person households. Master’s thesis, Dong-eui University, Busan.