
ABSTRACT
Many Asian countries are experiencing rapid urbanization. Japan is no exception, and urbanization is progressing in many regions. This study focuses on condominiums that have supported Japan’s urbanization and captures the evolution of their common areas. We target condominiums built in Sapporo City and analyze changes over a 40-year period based on data books and pamphlet drawings. The survey results revealed the following four points: 1) We determined the trends of the reduction in site and building areas and the move to an increase in number of floors. 2) In recent years, the installation rates of various common facilities, such as storage rooms, have increased. 3) We observed that the separation between public and private became clear with the progress of common facilities that had been moved indoors and outdoors, and in particular, the progressing trend of consolidating common facilities on the first floor of residential buildings. 4) We ascertained that, accompanying the consolidation of common facilities on the first floor, the number of flow lines from the inside to common facilities such as “parking lots” increased, where the original relationship with the outside in particular had been enhanced.
1. Introduction
The Setagaya Corporas in 1956 are said to be the first private subdivided condominiums (hereinafter referred to as condominiums) in Japan (Shiki, Matsumoto, and Otsuki Citation2018). Currently, condominium stock totals 6.75 million units, and condominiums have taken root as urban housing. As condominiums generally emphasize sales to customers, their designs focus on dwelling units rather than on the provision of common non-dwelling unit areas. Historically, apartment buildings in Japan, such as Dojunkai apartments, had common areas, such as recreation rooms and laundry rooms (Uchida Citation2004), whereas in today’s condominiums, the structure and location of the common areas are gradually changing. Common areas supplement the living functions of condominiums and cannot be simply reduced to dwelling units; their roles remain unchanged even in today’s condominiums. However, the common areas can change in response to the needs of time. Thus, a comprehensive understanding of the changes in common condominium areas can provide insight into the current state of urban housing and housing needs.
In Japan, various studies regarding the common areas of condominiums have been conducted. Adachi and Sakamoto (Citation2000) focused on common outdoor areas and classified them according to their spatial composition in apartment buildings. Liang Chun (Citation1986) organized the spatial composition of outdoor communal spaces and surveyed their use. Regarding indoor spaces in residential buildings, although Aoki and Hattori (Citation1998) investigated the ground-floor common areas of high-rise apartment buildings and considered the relationship between access form and area composition, their studies were confined to a limited portion of the common areas. Takada and Tatsumi (Citation1991) analyzed the actual state of condominiums by type according to various elements, including common areas. This study targeted 806 condominium buildings in Osaka over 11 years and ascertained the actual state of general condominiums in Japan for that duration. However, it was conducted 30 years ago and did not address changes in common areas. Takai, Saito, and Takada (Citation2005) focused on the changes in common areas. The subjects of this study were condominiums that differed by approximately 20 years in terms of construction years; although changes in the number of common facilities were captured, the subjects were limited to large-scale buildings. As the majority of subdivided condominiums cannot be considered large scale, Takai et al. did not capture trends in general condominiums.
We limited the survey subjects to Sapporo to ascertain changes in the common areas of condominiums within a specific city. According to the data from the Ministry of Land, Infrastructure, Transport and Tourism (Citation2011), the population concentration rate in Japan’s three largest metropolitan areas (Tokyo, Nagoya, and Osaka) rose from 46% in 1970 to 50% in 2005 and is predicted to reach 57% by 2050. Hokkaido is not one of the three major metropolitan areas, but a similar concentration of population or urbanization is observed in the city of Sapporo. For example, Sapporo’s population immigration rate has been consistently positive, going from 2% in 1975 to 0.4% in 2014. Sapporo is the only city in Hokkaido where the population has always increased since 1960, and the demand for condominiums in Sapporo is supported by this urbanization. This urbanization is not limited to Japan; similar urbanizations can also be observed in many Asian countries. While comparisons should be made with caution because the definition of “urban” varies from country to country, United Nations Department of Economic and Social Affairs Population Division (Citation2009) statistics show changes in the ratio of urban population to total population from 1975 to 2009—from 57 to 67% in Japan, 48 to 83% in South Korea, 19 to 44% in Indonesia, and 17 to 46% in China, all showing an increase. In other words, the demand for Sapporo condominiums arose in relation to urbanization, which began earlier in Japan than other Asian countries, and it would be useful to clarify the case of Japan’s urbanization.
As in other large cities in Japan, condominiums began to be provided on a large scale in Sapporo around 1970 and are now a major part of urban housing. In addition, the availability of complete condominium data was a major reason for the selection of Sapporo. When identifying the common areas, we determined the types of common facilities, their occurrence frequencies, and areas. In addition, to ascertain the changes in common areas, determining the types of requirements for common areas arising according to the varying arrangements of the spatial composition and interior and exterior of residential buildings is necessary. We intended to ascertain not only the needs for common areas but also their characteristics and modifications, with a focus on the design of such spaces, and ideas and improvements thereto.
2. Study positioning and research methods
2.1. Research methods
The data targeted all Sapporo condominiums constructed annually, every decade. The national surveys were conducted in 1985, 1995, 2005, and 2015. The study data were obtained from the “Condominium Databook, Sapporo Area((Citation1985),1995,2005,2015)”Footnote1, which records basic information, such as the locations, numbers of dwelling units, dwelling unit areas, and floor plans of all condominiums sold each year in Sapporo. In addition, for drawings data, the “pamphlets” distributed during condominium sales were used because the Housing Logistics Laboratory (Jutaku Ryutsu Kenkyujo), the publisher of the Condominium Databook Sapporo Area, had pamphlets for most sales in Sapporo since the 1980s. As shown in , the number of survey targets in 1985, 1995, 2005, and 2015 was 61, 166, 80, and 41, respectively, totaling 348. The status of condominium development was divided into roughly two types: Standalone buildings, where a residential building was constructed within the premises as a single building, and multiple buildings, where two or more buildings were constructed (). Of the total buildings examined, 77–89% were standalone buildings.
Figure 1. Standalone building and multiple building condominiums.
Table 1. Quantities of standalone buildings and multiple buildings supplied.
The major trends in condominium provision in Sapporo, such as the locations where condominiums have been supplied, site sizes, and total floor areas, are examined in Section 3, focusing on 348 examples that combine standalone and multiple buildings. In Section 4, we examine the configuration of common areas in residential buildings; thus, we restrict the targets to standalone buildings. The targets included 44 (1985), 89 (1995), 65 (2005), and 29 (2015) buildings. We determine the changes in installation floors for common condominium areas and trends in the common area. In Section 5, we investigate changes in the installation type, rate, and sites of common facilities. In Section 6, we study spatial configuration as a characteristic of the common area design. In this study, we focused on the flow plan of a common area on the first floor of a building and ascertained its design characteristics.
2.2. General situation of Sapporo and target year surveys
Twenty large cities in Japan were designated as ordinances. In 2020, Yokohama had the largest population (3.75 million), followed by Sapporo at number 4 (1.97 million). In 1970, Sapporo’s population was > 1 million, and it grew continuously, reaching 1.5 million in 1985 and 1.97 million in 2020.
A trend graph () of the condominium-dwelling unit supply in Sapporo and the mean sale price obtained from the Condominium DATABOOK of the Sapporo area were used. Between 1986 and 1991, the prices of housing and residential land increased in most cities in Japan under the favorable business climate of the bubble economy. Similarly, they rose in Sapporo, and the sales price of condominiums peaked at 32.56 million yen in 1991. The supply of condominium dwellings peaked in 1994 (11400 units), with a gradual decrease thereafter, reaching 1477 units by 2015. Sales prices have increased since 1994. They increased precipitously from 2013 onward. The mean price per unit reached 38.64 million yen in 2015, exceeding the price during the bubble era. Moreover, the current price of condominiums in Hokkaido is slightly higher than that of average detached houses in Sapporo.
Figure 2. Dwelling unit supply and mean sale price.
2.3. Act on building unit ownership, etc
The Act on Building Unit Ownership (1962) is an important act for condominiums in Japan and is introduced here because of its high relevance to the subject of this study. This act regulates the rights of the units within a condominium and the incorporated management associations, which manage the common areas and their operation. In a condominium, the owner of a unit or other divided portion of the condominium is called the unit owner, and the portion owned by the unit owner is called the exclusively owned areas. In principle, the inner area separated by walls, sashes, and doors is the exclusive use area. The areas other than exclusively owned area are called common areas, which can be divided into two types: 1) legal common area, such as corridors and entrances, that are shared by all unit owners; 2) bylaws common areas, such as building manager’s office, meeting hall, and parking lots, that are made common by residents’ bylaws. Although ascertaining areas as legal or bylaw is difficult because of the pamphlet-based survey, the common areas discussed in Sections 4 and 5 were selected for this study because they may have been used by both residents and the incorporated management association.
3. Ascertaining status of Sapporo condominiums
3.1. Location trends
Sapporo consists of ten wards, starting with Chuo Ward, where administrative institutions, such as Sapporo City Hall and the largest commercial area in the city, are located (). In 2020, Kita Ward had the highest population (280000 residents), followed by Chuo Ward (240000 residents). Kiyota Ward has the least population (110000 residents).
Figure 3. Hokkaido and Sapporo.
Regarding the locations of the condominiums, Chuo Ward had the highest proportion of examples during each period (), with 26% (43/166) of condominiums in 1995 and 51% (21/41) in 2015.
Figure 4. No. of buildings supplied per ward.
3.2. Scale ofconstruction
Although the site area of condominiumsFootnote2() decreased from 2663 m2 in 1985 to 1960 m2 in 2015, the mean building areaFootnote3remained in the range of 758–890 m2. The average total floor areaFootnote4increased from 4838 m3 (1985) to 7037 m2 (2015).
Figure 5. Site area, building area, total floor area.
When the site areas were viewed by size (), the proportion of 4000 m2 or larger areas decreased in recent years without any notable trends. Buildings with sizes of 1000–2000 m2 accounted for the highest proportion at 42% (147/348). In terms of building area (), cases <1000 m2 accounted for 74% (259/348) of the total, and in 2015, cases <500 m2 increased to 49% (20/41). Therefore, we understand that condominiums in Sapporo have small building areas in addition to increasingly narrow sites; however, the number of condominiums with large total floor areas has increased.
Figure 6. Site area.
Figure 7. Building area.
3.3. Size of residential buildings
We observed a gradual increase in the number of floors in condominiums. Regarding the number of floorsFootnote5(), in 2005, condominiums with 11–15 floors accounted for the majority at 83% (66/80); a similar trend was observed in 2015. The mean numbers of floors for the different years were 7.3 (1985), 9.9 (1995), 13.0 (2005), and 13.8 (2015). Buildings with ≥ 20 floors are referred to as super high-rises in Japan. The number of super high-rise buildings constructed in Sapporo in the target years were zero in 1985, one in 1995, three in 2005, and two in 2015. The installation rate of basement floors () peaked at 65% (52/80) in 2005 and decreased to 34% (14/41) in 2015. In Japan, the economy has not recovered since 2010, and the decrease in the rate of basement floor installation in 2015 is thought to be an effect of construction cost reductions.
Figure 8. No. of building floors.
Table 2. Basement floor installation rate.
Regarding the number of dwelling units per example (), where an example may consist of multiple buildings, buildings with ≤ 30 units per example were 34% (120/348). Until 1995, the supply of small-scale examples of ≤ 30 units was 42% (69/166), which gradually decreased with an increase in the number of dwelling units being mainly observed in buildings of 31–50 units, in recent years. In addition, we observed a gradual increase in condominium size, with 51 units increasing by 51% (21/41) in 2015.
Figure 9. No. of dwelling units per example.
4. Outline of common areas and common facilities
4.1. Changes in common areas and rates of common areas
We examined the changes in 44 (1985), 89 (1995), 65 (2005), and 29 (2015) stand-alone buildings that could be analyzed in terms of materials according to actual measurement data. Here, the indicator “common area rate” was used with reference to a previous study (Takemura and Komatsu Citation2019)(). The trends in the changes in mean of common areas () were examined. Although an increase has been observed since 1985, the total floor area has also increased (). Therefore, the common area rate of 33% in 2015 was not high. No apparent differences in the common area proportions were observed throughout the study period, with the common area proportion trending at approximately 30%.
Figure 10. Calculation of common area rate.
Figure 11. Common area, common area rate.
Condominium common areas can be approximately divided into three types: ① first-floor common areas within the building, ② second-floor or higher common areas within the building and other outdoor spaces within the premises, and ③ common areas outside the building (). The changes in the proportions of the three zones were examined (). During 1985–2015, the proportion of outdoor common areas decreased from 63 to 48%, whereas the proportion of first- and second-floor or higher indoor common areas increased. This is due to the increased building-to-land and floor-area ratios in condominiums in recent years, along with reduced outdoor spaces within the premises. In the years 1985–2015, first-floor common areas within buildings exhibited a 1.2-fold increase, whereas second-floor or higher common areas increased by 1.5 folds. However, considering that the mean number of condominium floors in 2015 had nearly doubled to 14 floors compared to 1985, the increase in first-floor common areas within buildings has greatly increased. The common first-floor areas within buildings are examined in detail in the following section.
Figure 12. Inside/Outside building relationship with three common area zones.
Figure 13. Distribution of common area, floor area.
4.2. Types and installation rates of common facilities
The various applications constituting the common areas are referred to as common facilities. shows the types and installation rates of on-premise common facilities during 1985–2015. The installation rate of building managers’ offices has been high since 1985, at 95%, whereas parking lots and mail corners have been installed at rates of 93 and 100% since 1985 and 1995, respectively. The installation rates of bicycle parking lots, storage units, waste disposal areas, and delivery lockers rapidly increased from 0% in 1985 to 100% in 2015. Moreover, the installation rates of motorcycle parking spaces and pet foot washing stations increased significantly, reaching 59 and 38% in 2015, respectively. Although the installation rate of tire storage was 34% in 2005, it was only 3% in 2015. This is because gas stations that replaced tires started paid tire storage services and many residents shifted to these services. Additionally, the installation rate of meeting halls, which are community spaces within residential buildings, peaked at 14% in 1985 and decreased to 0% in 2015.
Figure 14. Installation rates of main common facilities.
5. Relocation of common areas to inside buildings and changes in first-floor common areas inside buildings
In this section, we have classified the installation locations of common facilities, as shown in , and determined their trends.
5.1. Changes in parking lots
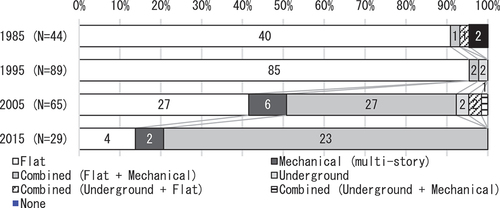
Parking lots are necessary common facilities for condominiums. The mean number of parked vehicles per building exhibited an increasing trend with values of 22 (1985), 35 (1995), 43 (2005), and 43 (2015). The mean proportion of vehicles parked per dwelling unit () was 50% in 1985 and 100% in 2005. Although it decreased slightly to 81% in 2015, more sales were in the city center and targeted elderly people who do not drive cars. Regarding parking methods (), the proportion of non-mechanical flat parking was high at 96% (85/89) in 1995, whereas in 2015, the proportion of condominiums with mechanical parking together with combined flat and mechanical parking increased to 86% (25/29).
Figure 15. Proportion of no. of dwelling units to no. of parked vehicles.
Figure 16. Parking method.
In recent years, the number of parking spaces inside buildings has significantly increased. shows the percentage of cars parked in the condominiums inside the building, which increased from 10% in 1985 to 14% in 2015. Although this appears to be a small increase of 4%, the average number of vehicles increased significantly from 1.1 to 4.5. Considering the reduction in building area, the proportion of in-building parking garages has increased in recent years.
Figure 17. Parking lots inside building.
5.2. Trends of relocation of other common facilities to inside the building
We examined the changes in common facilities other than parking lots, which were mainly installed in common areas outside buildings. Although the installation rate of outdoor common areas for bicycle parking lots () peaked in 1985 at 45% (20/44), it significantly changed in 2015, with 79% (23/29) on the first floor inside the building. Although the installation rate of motorcycle parking lots () was 0% in 1985, they were installed in 2005, and 45% (13/29) of motorcycle parking lots were installed on the first floor inside the building in 2015. Although the installation of outdoor common areas for storage units () peaked in 1985 at 27% (12/44), in 2015, installations at “individual floors” peaked at 55% (16/29). The installation of waste disposal areas () in common outdoor areas peaked in 2015; however, first-floor indoor installations accounted for 48% (14/29), with the proportion of installations increasing inside buildings in recent years. Consequently, we ascertained that the installations in common areas installed outside buildings in 1985, in particular, have tended to be installed on the first floor inside buildings in recent years.
Figure 18. Installation of bicycle parking lots.
Figure 19. Installation of motorcycle parking lots.
Figure 20. Installation of storage units.
Figure 21. Installation of waste disposal areas.
5.3. Area compositions of first-floors inside buildings
According to the results presented in section 5.2, common areas tend to be arranged on the first floor of the building. By determining the changes in the proportion of surface area of the first floor inside the building occupied by common areas (), we ascertained a trend in which most of the first floor was occupied by common areas, with the proportion increasing from 37% in 1985 to 81% in 2015.
Figure 22. Proportion of first-floor common areas inside building.
Trends in the first-floor area configurations inside the buildings were investigated (). The proportion of the area occupied by non-common areas such as dwelling units/shops was large (63%) in 1985, but it had significantly decreased (to 19%) in 2015. The mean number of first-floor dwelling unit installations per condominium () decreased from 5.9 in 1985 to 0.8 in 2015.
Figure 23. Inside building first-floor area configuration.
Figure 24. Buildings with dwelling units installed on the first-floor and mean no. of first-floor dwelling units.
Furthermore, as of 2015, the proportion of condominiums with no dwelling units on the first floor inside the building was 72% ( = 21/29).
The installation rate of pathways (common area) increased to 25% in 2015 (). This is because, in this study, entrance halls were included in pathways, and this increase was caused by the entrance halls being widely designed to lend the pathway a richer and wealthier appearance.
Based on the above results, we clarified the public and private zones in residential buildings and ascertained the trends of the first floors inside buildings as public places with common areas and the second floor and higher as private residential spaces.
6. Spatial configuration changes in first-floor common areas inside buildings
The common first-floor areas inside buildings exhibit significant changes such as the consolidation of common facilities. In particular, buildings had numerous common facilities installed within, which were originally set outdoors in the past, as mentioned in the previous section; common facilities with strong outdoor utilization properties were also included. Therefore, we maintained the nature of utilization, such as indoors and outdoors (), while ascertaining the changes in the spatial configuration of common facilities in first-floor common areas within buildings. Therefore, we randomly sampled 30 buildings in 1985, 1995, 2005, and 2015.
Figure 25. Indoor/Outdoor relationship of first-floor common areas inside the building.
6.1. Definitions of terms and signs and analysis methods
The spaces with common facilities are referred to as rooms. A room, whether indoor or outdoor, generally counts as a single area demarcated with a wall; however, mail corners and similar facilities placed in the corners of rooms may also be treated as rooms even though they are not clearly demarcated with a wall. According to the above definition of room, they were extracted from the condominium floor plans, and to examine the adjoining relationship of the rooms, we performed an analysis using an “undirected adjacency graph”Footnote6, where the order and directionality of the adjacency were not considered. As shown in (), rooms surrounded by ○ were treated as nodes, and flow lines from room to room were displayed as links.
Figure 26. Graph creation.
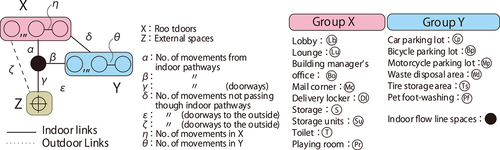
shows the terms, signs and room types, used in this study. The solid and dotted lines represent indoor and outdoor links, respectively. The multiplicity of links indicates select ability. With reference to space syntax theory (Hillier and Hanson Citation1984), for modes other than rooms, all external spaces outside the building were consolidated into a single external space of the building, and this was marked by the addition of a “+” to the ○. Additionally, movement spaces such as corridors were consolidated as indoor flow line spaces (marked with a ● in the figure). In this graph, the nodes are classified into three groups (X, Y, and Z) according to their properties. The first-floor common areas inside the building were classified as X and Y according to whether the room was indoors or outdoors and as Z for external spaces outside the building. Specifically, X is the group of rooms mainly used indoors and includes the building manager’s office, lounges, and storage units. Y includes the rooms mainly used outdoorsFootnote7, such as parking lots, tire storage areas, and waste disposal areas. The numbers of links to X, Y, Z, and inside are expressed as α, β, γ, δ, ε, and ζ, respectively. For example, if an X and Y node room has a doorway and direct movement to an outdoor space is possible, the number thereof has ε and ζ for the number of doorways. The number of links was expressed as δ in cases where movement from X to Y was possible without passing through a corridor/flow line space, such as direct movement from a parking lot to a storage unit.
Figure 27. Explanation of graph.
6.2. Number of nodes (number of rooms)
First, we observed changes in the number of nodes for X and Y (). The value of X increased from 1.7 (1985) to 3.6 (2015). In addition, Y peaked at 3.4 in 2005, 0.8 in 1985 and 3.3 in 2015. It had nearly quadrupled since 1985, and the proportion of rooms mainly used outdoors had greatly increased.
Figure 28. Change in the no. of nodes for X and Y.
We observed distributions of the node quantities for X and Y and divided the data into four zones: I (X≦2,Y≦2), II (3≦X,Y≦2), III (X≦2, 3≦Y), and IV (3≦X, 3≦Y) for ease of observing the annual trends (). In 1985, I was the highest at 76% (23/30). shows an example of
Figure 29. Example for 1985.
Table 3. Distribution with respect to the no. of nodes (four zones).
Figure 30. Example for 1995.
Figure 31. Example for 2005.
Figure 32. Example for 2015.
6.3. Number of links (number of room and doorway connections)
α, β, γ, and δ were appended as the numbers of links occurring indoors (). α increased by approximately the same value as the number of nodes for X (X≒α). This indicated that most of the rooms in X were directly connected to internal flow line spaces. β is the number of links directly connected to Y from the internal flow line space and is an example of movement from corridors to a parking lot inside the building without passing through the main entrance. Although β was 0.1 in 1985, it increased significantly to 1.6 in 2015. γ corresponds to the doorways connecting the external space outside the building to the internal flow line space. The mean number of doorways increased from 3.0 in 1985, plateauing at 3.9 from 2005 onward. δ was largely absent in all years; it was only observed in cases where movement to the waste disposal area was possible via the mail corner.
Figure 33. No. of indoor links for X, Y, and Z.
ε and ζ signify outdoor links (). ε is approximately equal to the number of nodes for Y (Y≒ε). This indicated that most of the rooms in Y were directly connected to external spaces outside the building. ε increased significantly from 0.8 in 1985 to 3.4 in 2005 to 2.9 in 2015. Regarding ζ, a few examples included cases where the building manager’s office was directly accessible from the outside, and these were observed in 1985 and 1995.
Figure 34. No. of outdoor links for X, Y, and Z.
6.4. Number of links in groups
The changes in the number of links are mentioned in section 6.3. We also examined the number of links appearing in each group. shows η and θ, which are the numbers of links for rooms in groups X and Y, respectively. Although η did not appear during any of the time periods, θ increased to 0.30 in 2005 and 0.33 in 2015. As specific examples of θ, rooms were arranged in a multilayered manner, such as in an example where a parking lot is not directly connected to an external space outside the building but is connected to a bicycle parking lot (), an example of movement to a waste disposal area from a bicycle parking lot (), and an example where a pet foot-washing station was set inside a bicycle parking lot (). presents the occurrences of θ related to the number of Y-nodes. With an increase in the number of Y nodes from two to eight, the occurrence rate of θ increased from 13 to 50%.
Figure 35. No. of links in X and Y.
Figure 36. Overlayed arrangement of a car parking lot and bicycle parking lot.
Figure 37. Overlayed arrangement of a bicycle parking lot and waste disposal area.

Figure 38. Overlayed arrangement of a bicycle parking lot and pet foot-washing station.
Table 4. No. of links between nodes in Y observed at each node in Y.
According to the above results, the number of nodes increased on the first floor of the condominium buildings in Sapporo. Along with the common areas the number of rooms regarded as common facilities also increased in recent years. Although the increase in the number of rooms was correlated with the increase in the number of flow lines related thereto, the design characteristics were identified as the increase in the number of flow lines to the “rooms mainly used outdoors” from indoors and the increased arrangement of rooms on top of each other mentioned in this section.
7. Discussion and conclusion
As mentioned in Section 3, construction in the central areas of Sapporo has strengthened in recent years, and we determined the trends moving from the reduction in site and building areas to the increase in the number of floors. In addition to an increase in the mean sale price, we observed an increase in the number and scale of units per building. In Section 4, we observed that the common area rate has trended at approximately 30% over the years. In recent years, the installation rates of various common facilities, such as storage rooms, have increased and those of meeting halls have decreased. In Section 5, we observed that the separation between public and private buildings became clear with the trend of outdoor common facilities being moved indoors and, in particular, the progressive trend for consolidating them on the first floor of residential buildings, with the first floors of residential buildings being common spaces without dwelling units and the second floor being dedicated areas for dwelling units. In Section 6, we examined the changes in the spatial configuration of first-floor areas within buildings where the common facilities observed in the previous section often existed. We ascertained that, accompanying the consolidation of common facilities on the first floor, an increase in the number of flow lines from the inside to common facilities such as parking lots was observed, where the original relationship with the outside had been enhanced.
According to the above findings, although the common areas of condominiums in Sapporo are currently lacking in terms of size, in recent years, they have been differentiated into multiple types of common facilities. This was attributed to the addition of new service functions, such as storage rooms and pet foot-washing stations, along with the new appearance of motorcycle parking lots, where a corner of the parking lot had likely been used until then in response to resident demands. Waste disposal areas and parking lots, which usually have been outdoor installations, were installed indoors as detailed responses to resident demands and were connected for increased convenience. In addition, a trend of dwelling units not being installed on the first floor, which is undesirable from a security perspective, was observed in recent years.
In addition, we observed that the first floors were increasingly designed to accommodate many common facilities. For example, although flow lines capable of entry to and exit from parking lots arranged outdoors have been designed in recent years, we believe that this is connected for increased convenience. In contrast, cases where sufficient flow line space was not available were also connected with an increased arrangement of common facilities on top of each other (Exp: η observed in Section 6). However, in some cases, moving to waste disposal areas was not possible without passing through the parking lot, and some cases were associated with reductions in the degree of convenience.
The findings of this study on condominiums in Sapporo indicated a growth in the diversity of common areas in recent years, which have been intended to improve convenience from the standpoint of spatial structure via comprehensive responses to residents’ use. Finally, we highlight the limitations of this study. Most condominium plans are ordered by a particular developer. We attempted to conduct an interview survey with major developers regarding their design aims, but they declined, claiming that indicating their design aims would reveal their business strategies. Although there are likely trends in the installation of common areas from the supplier’s perspective, such as business feasibility, the inability to adequately capture these trends is probably a limitation of this study. By adding a developer’s business perspective, the differences between commercial trends and the inevitable residential needs of urbanization can be captured, and we would like to devise a research methodology for this purpose.
Acknowledgements
This paper describes the development of Jianting Xu’s master’s thesis at the Muroran Institute of Technology. We would like to specially thank Jianting Xu (Fujita Corporation).
Disclosure statement
No potential conflict of interest was reported by the authors.
Additional information
Notes on contributors
Tatsuya Majikina
Tatsuya Majikina is an Associate Professor at the Muroran Institute of Technology. His research interests include architectural planning and housing.
Yuta Ito
Yuta Ito is a Master’s student at the Muroran Institute of Technology. His research interests include the housing sector.
Notes
1 The subdivided condominiums recorded all buildings sold in advertisements, such as newspapers and magazines. For these subdivided condominiums, we coordinated in advance with the Housing Logistics Research Lab that publishes the “Condominium Databook,” which confirmed the application of construction.
2 As the site area was ascertained for each example, in some cases the site area was large because construction from the following year onward was planned for multibuilding condominiums.
3 Here, the “building area”, in the case of multiple buildings, refers to the sum of the building areas of the multiple buildings constructed that year.
4 Here, the “total floor area”, in the case of multiple buildings, refers to the sum of the total floor areas of multiple buildings constructed that year.
5 For multiple buildings and cases in which several floors were present in a single building, the top floor was treated as the number of floors in the building.
6 There is a reference (Hanazato, Sasaki, and Kigawa Citation2011) to a study in which adjacency graphs are used. Hanazato used adjacency graphs to determine the spatial configuration characteristics of dwelling units in different types of residential buildings.
7 For example, waste disposal areas, as mentioned in Section 5, were originally installed in common areas outside buildings and therefore included Y groups as a strong property of outdoor use.
References
- Adachi, M., and K. Sakamoto. 2000 12 . “Typological Composition of Housing Units with Exterior Spaces Collective Form in Contemporary Japanese Housing (4).” Journal of Architecture and Planning 65(538): 101–108. In Japanese. https://doi.org/10.3130/aija.65.101_6.
- Aoki, M., and M. Hattori. 1998 10 . “The Area Size of Common Space in High-Rise Housing Projects, Configuration of Common Space in High-Rise Housing.” Journal of Architecture and Planning 63(512): 79–84. In Japanese. https://doi.org/10.3130/aija.63.79_3.
- Condominium Databook, Sapporo Area. “Condominium Databook, Sapporo Area”. Housing Distribution Research Institute Co., Ltd. 1985 edition, 1995 edition, 2005 edition, 2015 edition.
- Hanazato, T., M. Sasaki, and T. Kigawa. 2011 8 . “Architects’ Understanding Toward Spatial Configuration of Dwelling Units in Super-Highrise Condominiums and Their Differentiation in an Apartment Building.” Journal of Architecture and Planning 76(668): 1771–1780. In Japanese. https://doi.org/10.3130/aija.76.1771.
- Hillier, B., and J. Hanson. 1984. The Social Logic of Space. Cambridge University Press. https://doi.org/10.1017/CBO9780511597237.
- Liang Chun, C. 1986 1. “A Study on Structure and Utilization of Outdoor Common Space in Apartment Houses Supplied by Private Enterprises.” Journal of Architecture and Planning (359): 62–73. In Japanese. https://doi.org/10.3130/aijax.359.0_62
- Ministry of Land, Infrastructure, Transport and Tourism. 2011. “Long-Term Outlook for Japan.” Accessed March 2 2023. https://www.mlit.go.jp/policy/shingikai/kokudo03_sg_000030.html
- Ministry of Land, Infrastructure, Transport and Tourism. 2015. “White Paper on Land, Infrastructure, Transport and Tourism in Japan, 2015.” Accessed March 2 2023. https://www.mlit.go.jp/hakusyo/mlit/h26/hakusho/h27/index.html
- Shiki, Y., M. Matsumoto, and T. Otsuki. 2018. Yotsuya Co-Operative. In Japanese. Kajima Institute Publishing Co., Ltd.
- Takada, M., and K. Tatsumi. 1991 8 . “Classification of Condominiums Supplied by Private Enterprises in Large City.” Journal of Architecture and Planning 426: 83–90. In Japanese. https://doi.org/10.3130/aijax.426.0_83.
- Takai, H., H. Saito, and M. Takada. 2005. “A Study on the Successive Change Condition of Common Spaces and Facilities in Condominiums Including Many Units”, Proceedings of the Research Foundation Jusoken, Volume 31, pp.241–250. ( In Japanese).
- Takemura, H., and H. Komatsu. 2019 8. “Study on the Borders in the Common Space of the Housing Complexes Opening to the Neighbors.” In Summaries of Technical Papers of Annual Meeting, 1229–1230. Architectural Institute of Japan, Architectural planning. In Japanese
- Uchida, S. 2004. Learn from Dojunkai. In Japanese. Oukokusya Publishing Co., Ltd.
- United Nations. Department of Economic and Social Affairs. Population Division. 2009. “World Urbanization Prospects: The 2009 Revision”, United Nations.