
 ?Mathematical formulae have been encoded as MathML and are displayed in this HTML version using MathJax in order to improve their display. Uncheck the box to turn MathJax off. This feature requires Javascript. Click on a formula to zoom.
ABSTRACT
Improving energy efficiency in buildings is a challenge during operation and maintenance. The work proposes a cloud artificial intelligence-based building energy management (cloud AI-BEM) system for predicting building energy consumption. The proposed system includes the data layer, the AI-analytics layer, and the decision support information layer. The data layer collects and stores data in the cloud database management system. The analytics layer performs applied a hybrid AI model which was developed and deployed in this layer that enables predict future energy consumption in buildings. The hybrid AI model, namely the SAMFOR model was developed based on the integration of the seasonal autoregressive integrated moving average (SARIMA) model and the firefly algorithm (FA) and least-squares support vector regression (LSSVR). The web-based layer visualizes insights for users. As insights, the cloud AI-BEM system enables to monitor and to compare the energy consumption among buildings; to predict one-day-ahead energy use in buildings, to produce key performance indicators of energy use; to visualize energy data and outdoor temperature data; to easily interact with data from the system interface. Average accuracy in terms of RMSE values ranged from 1.36 kW per 30 min. The R values were higher than 0.957 and very close to 1.
1. Introduction
The global population explosion has resulted in a significant increase of buildings that have been recognized as one of the most dominant energy-consuming sectors. Increasing energy use in cities has increased the importance of planning for future energy strategies (Jahani, Cetin, and Cho Citation2020). In European countries and the United States, buildings contribute 40% to the total energy consumption of each nation (Belussi et al. Citation2019). Building operations are estimated to account for 36% of global energy use and 39% of energy-related global greenhouse gas emissions (Belussi et al. Citation2019). In addition, urbanization has led to the continuous extension of cities where 75% of global energy is used (Á et al. Citation2012). Efficient energy usage in buildings, thus, is an unhesitating solution to yield economical savings, reduce energy poverty, and mitigate the greenhouse effect.
The characteristics of building operational data are large-scale, high-dimensional, time-dependent, and the nonlinear relationship among input variables which demand a high requirement for data analytics to extract insightful knowledge. Traditional analytics which applies physical principle-based and statistical methods are limited for large data (Fan et al. Citation2019). Due to the improper control strategies and operating faults during the whole building life cycle, data analytics has a large potential to improve the operation and maintenance of buildings. Data analytics is mainly used to monitor and estimate building energy-saving potentials through energy use pattern recognition, occupancy schedules, control optimization, and benchmarking for energy use efficiency. Data analytics aims to leverage building data to build analytical models that extract insights on the performance of a building; as a result, it facilitates energy-efficiency interventions and policymaking (Srivastava, Yang, and Jain Citation2019).
Efficiency in building energy use has become vital towards saving the environment (Amasyali and El-Gohary Citation2018; Olu-Ajayi et al. Citation2022; Pham et al. Citation2020). The development of a reliable energy use forecasting model is important to analyze the energy consumption in buildings (Liu et al. Citation2020; Sha et al. Citation2022; Zhao et al. Citation2021). With the development of artificial intelligence (AI) and the Internet of Things (IoT), advanced data analytics like machine learning (ML) techniques have been widely applied for energy use prediction and management (Guo et al. Citation2018; Jahani, Cetin, and Cho Citation2020; Tian et al. Citation2021). ML-based models such as artificial neural networks (ANNs), support vector machines (SVMs), and random forests (RF) have demonstrated their effectiveness in predicting energy consumption in residential buildings (Alobaidi, Chebana, and Meguid Citation2018; Biswas, Robinson, and Fumo Citation2016; Fan et al. Citation2019) and non-residential buildings (Zekić-Sušac, Mitrović, and Has Citation2020). A probabilistic method was developed by integrating ANNs and the probabilistic concept to forecast daily energy use in buildings (Baba Citation2021). With these data-driven prediction models, analyses are carried out to detect the abnormal electric load (Xu and Chen Citation2020; Zhu et al. Citation2019). Such information needs to be timely alerted to building managers so that solutions for appropriate energy use are performed. In addition, studies have adopted ML-based models optimized by nature-inspired algorithms for an energy-efficient system (Ngo and T-T-H Citation2019; Sholahudin et al. Citation2019). By automatically tuning hyperparameters, optimization algorithms significantly improve the accuracy of prediction models.
For enhancing energy-efficient management, managers and operators are interested in identifying building load usage profiles. Electricity users were defined into classes based on their features, such as housing and dwelling characteristics, demographic and socio-economic factors, and energy usage habits (Rajabi et al. Citation2020). However, the clusters produced in such ways are unreliable due to the lack of actual energy consumption data. The mass installation of smart meters in recent years has facilitated electricity user categorization via applying clustering techniques (Rajabi et al. Citation2020). Clustering has become a powerful tool in the energy domain to improve the performance of forecast models (e.g., machine learners) and detect abnormal load consumption (Amjady Citation2001; Khan et al. Citation2013). Time-series clustering techniques have been proposed to extract patterns of buildings behavior from the energy consumption data (Ruiz et al. Citation2020).
To perform an effective energy management strategy, the framework of building energy management has been proposed (Chou and Ngo Citation2016; Luo et al. Citation2019). These platforms contain layers or components that collect, store, process, predict, and visualize big data of buildings. Major techniques were reviewed to model building energy consumption at an urban scale (Wong et al. Citation2021). Due to recent advances in technology, generating and analyzing data is fast and voluminous (Dubey et al. Citation2019). The big data platform for buildings is not only a tool for stakeholders improving both the reliability and performances of building assets, but also enable to scale up seamlessly from a single building to a building cluster, in the direction of smart areas and smart cities (Linder et al. Citation2017). Most studies have presented a single task, such as analysis and prediction of energy data, few studies have overall investigated data analytics applications. The literature review indicates that many platforms and frameworks for big data are still focused on the individual building level and cluster level. Therefore, an innovative mechanism that explores all data analytics is imperative.
Most of the studies have proposed ML models for predicting energy use in buildings. Few studies have developed a holistic prediction and management system for building energy consumption. The work aims to propose a cloud artificial intelligence-based building energy management (cloud AI-BEM) system for retrieving and analyzing energy consumption data in buildings. The proposed cloud AI-BEM system has three layers including (1) the data layer, (2) the AI-analytics layer, and (3) the web-based decision-support information layer. The data layer aims to collect and store data in the cloud database management system. The analytics layer performs applied a hybrid AI model which was developed and deployed in this layer that enables predict future energy consumption in buildings. The hybrid AI model, namely the SAMFOR model was developed based on the integration of the seasonal autoregressive integrated moving average (SARIMA) model and the firefly algorithm (FA) and least-squares support vector regression (LSSVR). The decision-support information layer visualized insights and information that were derived from the analytics layer. Notably, the hybrid AI model was integrated into the analytical layer to forecast future energy consumption in buildings. The web application was developed to provide users with interactive information and insights.
The cloud AI-BEM system enables to monitor and to compare the energy consumption among buildings; to predict one-day-ahead energy use in buildings, produces key performance indicators of energy use; to visualize energy data and outdoor temperature data; to easily interact with data from the system interface. Users or building managers have various options for understanding energy use for their buildings. The threefold contribution of this study includes (1) contributing to the domain knowledge with the advanced – innovative data analytics framework for building energy efficiency toward the smart city and sustainable development; (2) providing building users, utility companies, or government agencies with energy-efficient oriented information; (3) providing practitioners and researchers with a holistic base and reference for tailoring smart energy management system in cities.
The remainder of this study is organized as follows. Section 2 reviews relevant literature. Section 3 elucidates the development of the cloud AI-BEM system. The system implementation and discussion are presented in Section 4. The final section provides concluding remarks and recommendations.
2. Literature review
Since the importance of efficient energy usage in buildings, this topic has become of interest to many researchers (Chen et al. Citation2021; Jeong et al. Citation2017; Kim and Cho Citation2021; Li et al. Citation2022). A key-variable-based parallel HVAC energy predictive model was developed to predict future energy consumption in buildings (Sha et al. Citation2022). An interpretable ML-based method was developed to assess the performance of data-driven building energy models (Fan et al. Citation2019). The proposed method used five ML techniques which were generalized linear models, ANNs, SVMs, RF, and extreme gradient boosting tree. Operational data in 30-minute intervals collected from an educational building in Hong Kong were used for analysis. Similarly, an energy demand stochastic frontier model was employed for estimating the energy efficiency of educational buildings in Hong Kong (Yeo et al. Citation2019). The decomposition analysis and the end-use analysis indicated that energy use allocated for research activities remained in its leading position.
A comprehensive review of anomaly detection systems for energy consumption in building based on AI has been performed in (Himeur et al. Citation2021). The ANNs based on system was developed for enhancing automation and management systems of sports buildings (Elnour et al. Citation2022). The integration of ANNs and PSO was implemented to build an energy management system (Aguila-Leon et al. Citation2022). Smart fusion of sensor data and human feedback for personalized an energy efficiency recommendation was presented using an innovative fusion of sensor data and occupants (Varlamis et al. Citation2022). A smart recommendation system for Internet of energy was developed for buildings (Sayed et al. Citation2022). An abnormal detection system for energy use in buildings was developed based on enhanced K-nearest neighbors (Himeur et al. Citation2021).
The wide applicability of ML techniques towards efficient energy management in buildings has been demonstrated in various researches (Fan et al. Citation2019; Yuan et al. Citation2021; Zhu et al. Citation2019). ML models were applied to forecast annual building energy use in the early design phase (Olu-Ajayi et al. Citation2022). ML models in their study include ANNs, Gradient Boosting (GB), Deep Neural Network (DNN), RF, Stacking, K Nearest Neighbour (KNN), SVM, Decision tree (DT) and Linear Regression (LR). A systematic approach was presented using ML techniques to quantify daily load profiles (Zhu et al. Citation2019). Data collected from two multi-story buildings were used to verify the prediction performance of seven predictors including linear regression, K-nearest neighbors, RF, ANNs, SVMs, and others. In addition, the residual analysis was performed to timely warn building managers about abnormal energy consumption. a forecasting model of energy consumption in residential buildings using web crawler and AI was proposed in (Chou and Hsu Citation2022);
To assist the energy efficiency management in public buildings, the prediction capacity of ML-based models, namely, the deep neural networks (DNNs), Rpart regression tree, and RF were investigated (Zekić-Sušac, Mitrović, and Has Citation2020). A dataset consisting of 575 public buildings in Croatia was collected to verify the performance of three models. Results showed a potential of ML-based prediction models with the symmetric mean absolute percentage errors (SMAPE) of three models below 20%. RF was the most accurate predictor which yielded a SMAPE of 13.59%. In addition, ML techniques were adopted for predicting hourly electricity demand at a campus consisting of 47 commercial buildings (Walker et al. Citation2020). The predictive accuracy of models was evaluated at an individual building level and building cluster level. Experimental results indicated the superiority of boosted-tree, RF, and ANNs in predictive capacity and computational cost. Elman neural networks and evolutional optimization were integrated also to build a model for predicting energy consumption (Ruiz et al. Citation2018).
Clustering techniques have been widely applied for their benefits in operating and managing the power system. With the application of clustering, similar strategies could be adopted to clusters of buildings and customers. By using a density-based spatial clustering, the time-of-use tariffs structures for different groups of energy was designed to reduce peak load and maintain the reliability of the power system (Yang et al. Citation2019). A shape-based clustering was utilized to identify daily electricity consumption profiles of Irish homes (Wen, Zhou, and Yang Citation2019). Findings indicated that the clustering technique assisted the residents in regulating their electricity consumption habits to decrease bills in peak-valley periods. Moreover, analyzing energy usage patterns could detect anomalous behavior of appliances and electricity theft (Funde et al. Citation2019; Khan et al. Citation2013). Another advantage of the clustering technique is its pre-process role to improve the accuracy of energy forecasts (Aly Citation2020). For example, a k-shape algorithm was adopted to discover energy usage patterns of 10 institutional buildings in Singapore (Yang et al. Citation2017). Analytical results indicated that the SVR model with cluster obtained higher forecast accuracy than that without the cluster.
The development of big data and IoT has facilitated data analytics and application development towards energy-efficient buildings (Linder et al. Citation2017; Luo et al. Citation2019; Terroso-Saenz et al. Citation2019; Wu et al. Citation2018). a Hadoop-based big data platform for energy data storage, query, and analysis were proposed in (Wilcox et al. Citation2019). Notably, this system could visualize knowledge via a web-based graphical user interface. For storing and processing building data, Linder et al. (Citation2017) developed a big building data platform that provides multiple functions for building stakeholders including building users, the building owner, the architects, and the engineering consultancies.
For instance, an IoT-based big data platform was designed for the one-day-ahead prediction of building heating and cooling demands (Luo et al. Citation2019). A hybrid model of k-means clustering and ANNs was adopted to validate daily datasets that were collected from an office building in the United Kingdom. The k-means clustering was used to classify the daily weather data profile, while the ANNs model was utilized for energy prediction. Analytical results showed that the MAPE values obtained by the predictor were respective 3% in the training phase and 8% in the test phase for whole-building heating and cooling demands.
Many studies have proposed frameworks and architects for an intelligent energy management system (Alobaidi, Chebana, and Meguid Citation2018; Chou and Ngo Citation2016; Zhou, Fu, and Yang Citation2016). A 4-layer framework for an energy-saving decision-support system was developed in (Chou and Ngo Citation2016). This framework included a smart grid, data collection, analytics bench, and a web-based portal. Smart meters were installed in residential buildings to collect data for evaluating the effectiveness of the proposed framework. A 3-step framework was proposed that included data preprocessing, prediction model construction, and residual analysis for quantifying daily load patterns (Zhu et al. Citation2019). Data profiles were collected by the sub-metering system set up in residential and office buildings.
The rapid extension of urbanization during the past decades has imposed imperative requirements for efficient energy management at a city level and national level. A life-cycle dynamic simulation model was introduced for the city scale to discover the features of energy consumption in residential buildings (Belussi et al. Citation2019). The life-cycle assessment and the system dynamics were combined to form a Stock-and-Flow model. By validating a case study of Beijing (China), the proposed model proved its usefulness and ability in analyzing the dynamic trend of multiple indicators, such as population, residential stock, to support the policy-making of the governments. An intelligent energy management system for public buildings that could be utilized for a smart city was developed (Zekić-Sušac, Mitrović, and Has Citation2020). The proposed architect contained six layers including big data collection, data processing, ML-based prediction, data interpretation and visualization, decision making, and benefits measure.
To date, most research has proposed platforms that solve separate tasks in a smart energy management system. Few studies have focused on holistic frameworks that were adopted a hybrid AI for data analytics. Therefore, this work develops a cloud artificial intelligence-based building energy management system that takes advantage of cloud technology, artificial intelligence, metaheuristic-based optimization algorithms, and web applications. Particularly, the cloud AI-BEM system is a three-layer architecture of the data collection layer, the AI-based analytics layer, and the layer of web-based decision-support information and interactive visualization.
3. Proposed cloud hybrid artificial intelligence system for energy efficiency in buildings
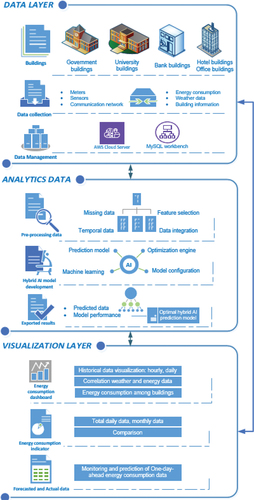
presents the innovative framework of the proposed cloud AI-BEM system that consists of three main layers including the data layer, the AI-analytical layer, and the layer of web-based decision-support information. Details of these layers are described in the following subsections.
Figure 1. The innovative framework of the proposed cloud AI-BEM system.
3.1. Input layer – database system
The data layer aims to collect and store data. Collected data involves energy consumption data, weather data, and building information. Data were collected by the energy metering system, sensors, and the communication network. The collected data are stored in database management systems, such as MySQL or cloud-based database services. Amazon Relational Database Service (Amazon RDS) is a managed relational database service that provides users with several database engines to select from, involving Amazon Aurora, MySQL, MariaDB, Oracle, Microsoft SQL Server, and PostgreSQL (Aws Citation2021b). Amazon RDS handles routine database tasks, such as provisioning, patching, backup, recovery, failure detection, and repair. Amazon RDS is a cost-efficient and resizable capacity while automating time-consuming administration tasks, such as hardware provisioning, database setup, patching, and backups. MySQL is the most widely used open-source relational database in the world and it can be easy to set up, operate, and scale MySQL deployments in the cloud by Amazon RDS (Aws Citation2021b). With Amazon RDS, a scalable MySQL server can be deployed in minutes with cost-efficient and resizable hardware capacity.
Large datasets were collected in 30-min resolutions from hundreds of buildings in Danang city, Vietnam. Data consists of building information, energy consumption data, and weather data. Particularly, large energy consumption data in 659 buildings were derived from the Central Power Corporation EVNCPC in Vietnam. Weather data were recorded from the weather station. The raw data for each building were retrieved within two and half years from the year of January 2018 to June 2020.
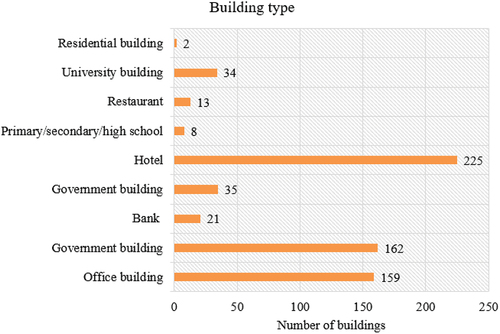
Data were collected from buildings, such as office buildings, hotel buildings, university buildings, governmental buildings located in Danang city, Vietnam. These buildings are categorized by their location. Investigated buildings were distributed within six districts in Danang city. Most of the buildings are located in Sontra and Haichau districts as these two districts are central of Danang city. presents the building types in the database. Most buildings are hotel buildings (225 buildings), government buildings (162), and office buildings (159 buildings).
Figure 2. Building types in the database.
3.2. Analytics layer – artificial intelligence model
The analytics layer was used to preprocess the raw data such as dealing with the missing data, extracting temporal data, and feature selection. This layer performed the data analytics to produce useful information for monitoring and predicting energy use in buildings. The hybrid AI model was developed and deployed in this layer that enables predict future energy consumption in buildings. The hybrid AI model, namely the SAMFOR model was developed based on the integration of the seasonal autoregressive integrated moving average (SARIMA) model and the firefly algorithm (FA) and least-squares support vector regression (LSSVR).
3.2.1. SARIMA model
SARIMA models are multiplicative models which is involved nonseasonal and seasonal parts. EquationEquation 1(1)
(1) represents mathematically SARIMA models as explained in (Tseng and Tzeng Citation2002; Wang et al. Citation2012).
where p is the nonseasonal autoregressive (AR); d is nonseasonal differencing; q is the nonseasonal moving average (MA); yt is the actual value at the time t; αt is the estimated residual at the time t; d, q, P, D, Q are integers.
3.2.2. FA-SVR model
The FA-SVR model was developed based on the FA and LSSVR. For the LSSVR model, given a learning data , function forecasting with LSSVR is formulated as an optimization problem, as expressed in Equation.
; subject to
where J(ω,e) denotes the objective function, ω denotes the linear approximator parameter, is a regularization constant, xk are inputs, yk are outputs, and N is the sample size.
The FA was applied to optimize the LSSVR model (i.e., C and the RBF width σ), which helps to improve the predictive accuracy of the proposed model. The FA (Firefly Algorithm Citation2008), is a nature-inspired metaheuristic algorithm that is inspired by the flashing behavior of fireflies. The FA is effective to identify the global optima and local optima. The movement of a firefly is expressed as EquationEquation 3(3)
(3) .
where is the position of the ith firefly;
is the position of the ith firefly;
is the position of the jth firefly; αt is a randomization parameter; and
is random numbers; β0 is the attractiveness at r = 0.
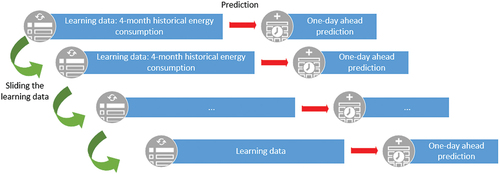
visualizes the operation of the AI prediction model in the analytics layer. Data used for learning model are extracted from the cloud database management system. The SAMFOR model performs the two-step prediction which is the first step of learning the prediction model and the second step of generating one-day-ahead energy consumption prediction in buildings using the learned SAMFOR model. The input data for learning the model include historical energy consumption, outdoor temperature, day of the week, the hour of the day.
Figure 3. Hybrid AI prediction model in the analytics layer.
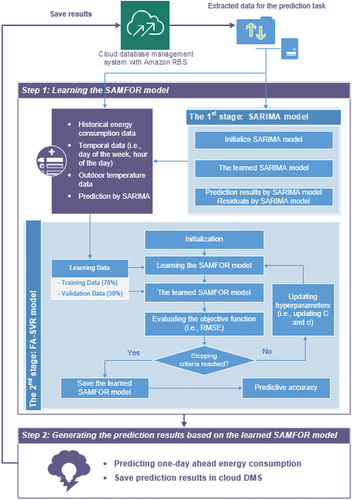
During the learning step, the SAMFOR model is learned through two phases using the four-month historical data. The SARIMA model was applied to model and predict the linear part of one-day-ahead energy consumption in the 30-minute intervals using the historical energy consumption data. Prediction results by the SARIMA model along with the outdoor temperature data, day of the week, and hour of the day were fed into the FA-SVR model to perform the optimization process of SAMFOR model, which aims to minimize the predictive error. After all, the SAMFOR model was learned and saved successfully. It was then used to generate the final prediction of one-day-ahead energy use in buildings.
The prediction results were stored back in the cloud database and were visualized using the web-based application. Along with the prediction results, the predictive performance of the SAMFOR model during the learning step was stored in a specific table in the database. This performance can be used to track and evaluate continuously the effectiveness of the prediction model during the serving course of the SAMFOR model by users or building managers.
3.3. Visualization and decision-support information
A web-based system is developed and integrated within the decision-support information layer. The layer of decision-support information visualized insights and information that were derived from the analytics layer. Users or building managers have various options to understand their energy use for their buildings. Daily or monthly energy consumption data were provided. Energy consumption history and energy use comparisons during the time were also involved.
AWS Elastic Beanstalk is used to deploy the web application in this study. The AWS Elastic Beanstalk is an Amazon web service that is easy to use (Aws Citation2021a). It is compatible with various platforms such as Java, .NET, PHP, Node.js, Python, Ruby, Go, and Docker (Aws Citation2021a). Elastic Beanstalk is a fast and simple method for deploying an application on AWS. AWS management console, a Git repository, or an integrated development environment (IDE) such as Eclipse or Visual Studio can be used to upload an application.
Elastic Beanstalk is then automatically handling the deployment of capacity provisioning, load balancing, auto-scaling, and application health monitoring. Within short time, the application can be ready to access without any infrastructure or resource configuration work (Aws Citation2021a). Elastic Beanstalk applies core AWS services, such as Amazon EC2, Amazon Elastic Container Service (Amazon ECS), Auto Scaling, and Elastic Load Balancing to quickly facilitate applications for scaling and serving millions of users.
IntelliJ IDEA is an integrated development environment written in Java for developing computer software (Hemeur, Citation2021). IntelliJ IDEA was used in this study as a Java-integrated development environment tool to develop the web-based system. It enables to significantly enhance developer productivity. With the support of intelligent coding feature and ergonomic design, development is not only productive but also enjoyable (Hemeur, Citation2021).
Highcharts library is a software library for charting written in pure JavaScript (Hønsi et al. Citation2021). This library was used in the development of a web application for plotting and visualizing the data in this study. With the aid of the Highcharts library, the design of a dashboard is easy and dynamic. It provides users with various features for interacting with data.
4. System implementation and discussion
4.1. System performance
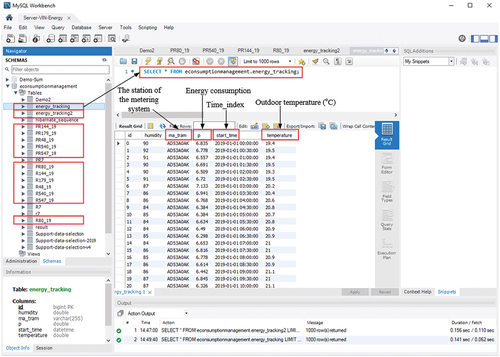
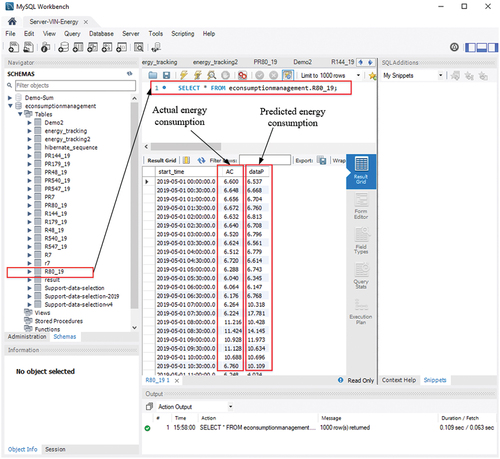
To verify and demonstrate the proposed cloud artificial intelligence-based innovative data analytics system, the original datasets were transferred into the cloud database management system, namely “econsumptionmanagement” using the Amazon Relational Database Service (Amazon RDS). shows tables of the cloud database in AWS assessed by MySQL workbench. For demonstrating and verifying the proposed system, data from six building blocks in the original database were exported randomly into the cloud data management in this study. Their building codes are 144, 179, 48, 540, 547, 80. There are 12 tables in the database that include the table of “energy_tracking”, the table of “energy_tracking2”, the tables of “PR144_19”, “PR179_19”, “PR48_19”, “PR540_19”, “PR547_19”, “PR80_19”, and the table of “R144_19”, “R179_19”, “R48_19”, “R540_19”, “R547_19”, “R80_19”. The “energy_tracking” table stores data that were transferred from the recorded original data (i.e., energy consumption data from the Central Power Corporation EVNCPC in Vietnam and weather data) as shown in . The table of “energy_tracking2” stores input data that were used to proceed with the prediction task. The tables of “R144_19”, “R179_19”, “R48_19”, “R540_19”, “R547_19”, “R80_19” store the prediction results produced by the SAMFOR prediction model. The tables of “PR144_19”, “PR179_19”, “PR48_19”, “PR540_19”, “PR547_19”, “PR80_19” save predictive performance of the SAMFOR model during its learning step.
Figure 4. The cloud database in AWS assessed by MySQL workbench.
As mentioned in the analytics layer in the previous section, the SAMFOR model has been developed and integrated into the analytics layer to predict one-day-ahead energy consumption in buildings. With the aim of demonstrating the proposed system, the table of “energy_tracking2” in the database was created to store the necessary data that aim to perform the prediction task of the proposed system. Particularly, it contains data about the day of the week, the hour of the day, outdoor temperature, and historical energy consumption in investigated buildings. presents the 4-month data sample for learning the SAMFOR model, which is from 1 January 2019 to 30 April 2019. This sample data was used to learn the SAMFOR model which aims to produce the one-day-ahead energy consumption on 1 May 2019.
Table 1. Four-month data sample for learning the SAMFOR model.
reveals the sliding approach of the learning data for one-day-ahead energy consumption prediction. The learning data for the SAMFOR model were 4-month historical data. The learning data are moved forward a one-day step as the prediction is done each day to keep the learning data size of 4-month. The learned model was used to produce one-day-ahead energy consumption. With this regard, the prediction model was performed daily from 1 May 2019 till 31 December 2019 which are 245 times.
Figure 5. Sliding the learning data for one-day-ahead energy consumption prediction.
The prediction results were produced by the SAMFOR model and saved in the tables of “R144_19”, “R179_19”, “R48_19”, “R540_19”, “R547_19”, “R80_19”. presents prediction results in the table “R80_19” for the building with the code 80. The prediction results were one-day-ahead energy consumption in 30-min intervals in buildings. These results were then visualized interactively by the web-based application to provide users with interactive charts. Predictive accuracy indices during the learning steps of the SAMFOR model were also saved in the cloud database under the table of “PR80_19”.
Figure 6. Prediction results in the database for energy consumption in buildings.
These indices were calculated based on the predicted values and actual values that derived from a group of buildings. They were used to evaluate the effectiveness of the prediction model. These indices were stored cumulatively in the database. They are the root-mean-squared error (RMSE), mean absolute error (MAE), mean absolute percentage error (MAPE), and correlation coefficient (R). summarizes the values of these indices for those buildings during the prediction over the period from 1 May 2019 to 31 December 2019. Average accuracy in terms of RMSE values ranged from 1.36 (kW per 30 min) at building code of 80 to 4.23 (kW per 30 mins) at the building code of 144. The R values were higher than 0.957 and very close to 1, which depicts the strong agreement between prediction results and actual energy consumption data.
Table 2. Predictive accuracy indices of the AI-BEM system.
4.2. Web-based application
The interactive web-based application system was developed to visualize energy data and provide users with dynamic and interactive information. Key features of the visualization of energy consumption in buildings are below.
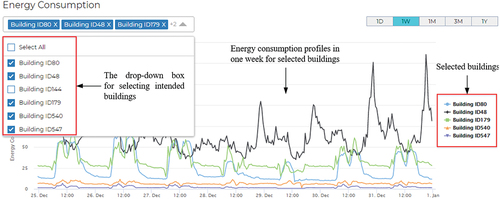
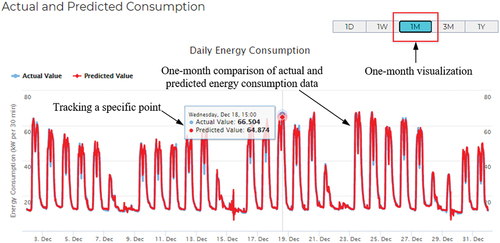
The system can visualize interactively historical energy consumption data in various time spans, such as 1 day, 1 week, 1 month, 3 months, and 1 year. presents the 30-min interactive graph of historical energy consumption data in 1 day. Users enable to click in the upper right corner of the graph to switch the time span for visualization. For example, are graphs for one-month and one-year historical energy consumption data. This feature provides users with an overall understanding of energy use patterns in buildings over different periods. This feature also helps the user to quickly detect if there are any extraordinary data in the graph.
Figure 7. Interactive graph of historical energy consumption data in one day.
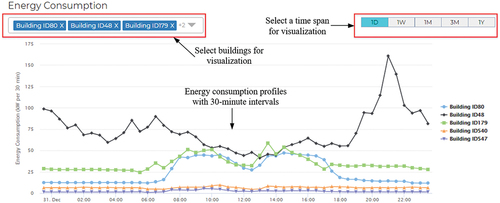
Figure 8. Interactive graph of historical energy consumption data in one month.
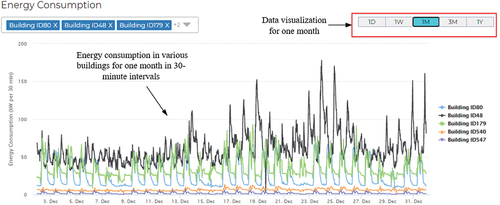
Figure 9. Interactive graph of historical energy consumption data in one year.
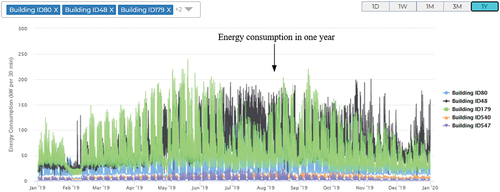
The system allows users to multiply choose buildings to plot their energy use. The drop-down box at the upper left corner of the graph () is displayed to allow users to select buildings that they want to show the visualization. Simultaneous visualization for various buildings is beneficial to users.
Figure 10. Interactive graph of historical energy consumption data in one year.
The interactive feature was integrated into the graphs. This feature provides users with an easy way to zoom out any space in the graph. Users are easy to access any space to deeply understand the building data. Users then click “Reset zoom” in the current view to come back to the previous visualization. In addition, users can point a mouse to see the values at a specific time.
To provide users with holistic understanding of their energy consumption, along with data in 30-min intervals, the AI-BEM system creates a function to enable users to access their data in daily or monthly format as shown in . With this feature, users can know their energy use trend over months or a year.
Figure 11. Visualization for daily energy consumption in buildings.
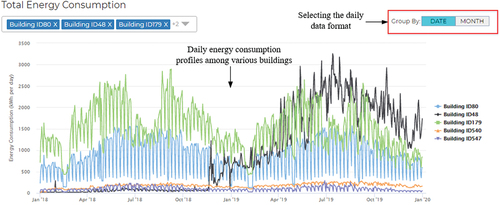
Figure 12. Visualization for monthly energy consumption in buildings.
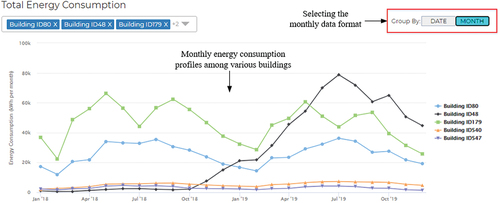
Notably, the AI-BEM system provides a highly interactive visualization for prediction results. presents the comparison visualization for daily energy consumption prediction in buildings. This graph enables users to understand their energy use behavior and they may adjust their usage to reduce energy consumption. In addition, the proposed AI-BEM system provides users with dynamic options to select the period to visualize a comparison between actual and predicted energy consumption data. For example, is the monthly comparison between actual and predicted energy use patterns.
Figure 13. Comparison visualization for daily energy consumption prediction in buildings.
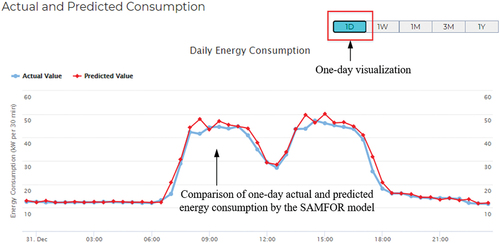
Figure 14. Comparison visualization for monthly energy consumption prediction in buildings.
presents key performance indicators for an individual building, which include the total building energy used in the current year, the total energy used in the current month, and the total energy used in the current day. The accumulative energy consumption in the building code 80 in the current year is 186,352 kWh, the accumulative energy consumption in the current month is 10,793 kWh, accumulative energy consumption in the current day is 258 kWh. With this information, building managers or users enable understanding their current energy use and they are willing to adjust their behavior to reduce energy consumption and save energy costs.
Figure 15. Key performance indicators for an individual building.

The proposed system provides information on the correlation between the energy consumption in buildings and the outdoor temperature. Users enable to zoom out at the specific period to understand their relationship in detail. The correlation of the energy consumption in a building and outdoor temperature is positive during working days such from Monday to Friday and Saturday morning. There is no correlation between the energy use and out temperature in the lay-days such Sunday or Saturday afternoon.
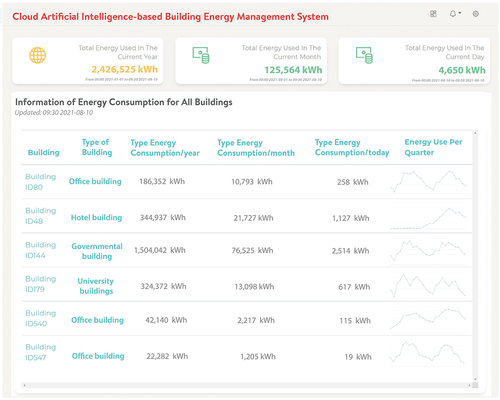
With the cloud AI-BEM system, building managers or users can access key performance indicators for all buildings as shown in . The total building energy consumption data for all buildings are 2,426,525 kWh in the current year, 125,564 kWh in the current month, and 4.650 kWh in the current day. These indicators are updated continuously as 30-minute steps. Users also access this information at the individual building level as shown in . For example, at the current day, the energy consumption is 258 kWh in the building code 80 (an office building), 1,127 kWh in the building code 48 (a hotel building), 2,514 kWh in the building code 144 (a governmental building), 617 kWh in the building code 179 (a university building), 115 kWh in the building code 540 (an office building), and 19 kWh in the building code 547 (an office building). Notably, the chart on the right present energy use per quarter in those buildings, which help users understanding drafty trends of energy consumption in buildings.
Figure 16. Key performance indicators for all buildings.
5. Conclusions and recommendations
The rapid growth of the global population has resulted in a significant increase in energy demand. Efficient energy usage in buildings, thus, is an unhesitating solution to yield economical savings, reduce energy poverty, and mitigate the greenhouse effect. The application of artificial intelligence for efficient energy management in buildings has been demonstrated in various research. The development of big data and the IoT has supported data analytics and application development for building energy management systems.
Few studies have focused on holistic frameworks that were adopted a hybrid AI for data analytics. Thus, this work proposed a cloud artificial intelligence-based building energy management (cloud AI-BEM) system that integrates cloud technology, artificial intelligence, metaheuristic-based optimization algorithms, and web applications. Particularly, the cloud AI-BEM system was designed with a three-layer architecture. They are the data layer, the AI-based analytics layer, and the layer of web-based decision-support information and interactive visualization.
The data layer aims to collect and store data. Collected data involves energy consumption data, weather data, and building information. The cloud database system in Amazon RBS was used to store data and the MySQL workbench was used to connect with the database system in Amazon RBS. The collected data can be accessed and played easily with the MySQL workbench. The analytics layer was used to preprocess the raw data, such as dealing with the missing data, extracting temporal data, and feature selection. The hybrid AI model was developed in the analytics layer to predict future energy consumption in buildings. Notably, the hybrid AI model takes advantage of SVR-based machine learning model and an optimization algorithm to enhance the efficacy of the prediction task. This layer performed the data analytics to produce useful information for monitoring and predicting energy use in buildings. A web-based system is developed and integrated within the decision-support information layer. The layer of decision-support information visualized insights and information that were derived from the analytics layer.
Case studies were applied to demonstrate the effectiveness of the proposed system. The cloud AI-BEM system enables to monitor and to compare the energy consumption among buildings; predicts one-day-ahead energy use in buildings, produces key performance indicators of energy use; to visualize energy data and outdoor temperature data; to easily interact with data from the system interface. Users or building managers have various options for understanding energy use for their buildings. The prediction accuracy of the proposed system was ranged from 1.36 to 4.23 (kW per 30 min) in terms of RMSE values. The R values were about 0.957 and very close to 1, which confirms the strong agreement between prediction results and actual energy use in buildings.
The threefold contribution of this study includes (1) contributing to the domain knowledge with the advanced – innovative data analytics framework for building energy efficiency toward the smart city and sustainable development; (2) providing building users, utility companies, or government agencies with energy-efficient oriented information; providing practitioners and researchers with a holistic base and reference for tailoring smart energy management system in cities. Due to limitations, the proposed system can predict short-term energy consumption in building. Future study can consider long-term prediction of energy use in buildings, such as 1 week or 1 month period. In addition, the AI-BEM system can be updated with more dynamic visualization techniques to provide users with diverse information.
Acknowledgements
This work was funded by Gia Lam Urban Development and Investment Company Limited, Vingroup and supported by Vingroup Innovation Foundation (VINIF) under project code VINIF.2019.DA05.
Disclosure statement
No potential conflict of interest was reported by the authors.
Additional information
Funding
Notes on contributors
Ngoc-Tri Ngo
Dr. Ngoc-Tri Ngo specializes in digital construction engineering management. Dr. Ngo is a Senior Lecturer at the University of Danang – University of Science and Technology (DUT), Danang city, Vietnam. His expertise is in project management, artificial intelligence applications in the built environment, building information modeling, optimization, building energy modeling, and sustainable urban development.
Ngoc-Son Truong
Ngoc-Son Truong specializes in construction management. He is a Lecturer at the University of Danang – University of Science and Technology (DUT), Danang city, Vietnam. His expertise is in construction management, artificial intelligence, building information modeling, and building energy modeling.
Thi Thu Ha Truong
Thi Thu Ha Truong specializes in construction economics. Her expertise is in project management, time series forecasting and analysis, artificial Intelligence-based data mining in civil engineering.
Anh-Duc Pham
Anh-Duc Pham earned his Ph.D. in the Department of Civil and Construction Engineering from the National Taiwan University of Science and Technology. His main teaching and research focuses on applications of artificial intelligence & machine learning in construction engineering and management, it related to data analytics & intelligence, professional skills & project management, and financial analysis.
Nhat-To Huynh
Dr. Nhat –To Huynh specializes in industrial and engineering management and project management. His expertise is in artificial intelligence, theory of computation, and industrial engineering.
References
- Á, R.-L., D. L. González-Álvarez, M. A. Vega-Rodríguez, J. A. Gómez-Pulido, J. M. Sánchez-Pérez MO-ABC/DE - Multiobjective Artificial Bee Colony with Differential Evolution for Unconstrained Multiobjective Optimization. 2012 IEEE 13th International Symposium on Computational Intelligence and Informatics (CINTI) 2012, Budapest, Hungary. p. 157–162.
- Aguila-Leon, J., C. Vargas-Salgado, C. Chiñas-Palacios, and D. Díaz-Bello. 2022. “Energy Management Model for a Standalone Hybrid Microgrid Through a Particle Swarm Optimization and Artificial Neural Networks Approach.” Energy Conversion and Management 267:115920. https://doi.org/10.1016/j.enconman.2022.115920.
- Alobaidi, M. H., F. Chebana, and M. A. Meguid. 2018. “Robust Ensemble Learning Framework for Day-Ahead Forecasting of Household Based Energy Consumption.” Applied Energy 212:997–1012. https://doi.org/10.1016/j.apenergy.2017.12.054.
- Aly, H. H. H. 2020. “A Proposed Intelligent Short-Term Load Forecasting Hybrid Models of ANN, WNN and KF Based on Clustering Techniques for Smart Grid.” Electric Power Systems Research 182:106191. https://doi.org/10.1016/j.epsr.2019.106191.
- Amasyali, K., and N. M. El-Gohary. 2018. “A Review of Data-Driven Building Energy Consumption Prediction Studies.” Renewable and Sustainable Energy Reviews 81:1192–1205. https://doi.org/10.1016/j.rser.2017.04.095.
- Amjady, N. 2001. “Short-Term Hourly Load Forecasting Using Time-Series Modeling with Peak Load Estimation Capability.” IEEE Transactions on Power Systems 16 (3): 498–505. https://doi.org/10.1109/59.932287.
- Aws. 2021a. Amazon RDS for MySql. USA: Aws.
- Aws. 2021b. Amazon Relational Database Service (RDS). USA: Aws.
- Baba, A. 2021. “Advanced AI-Based Techniques to Predict Daily Energy Consumption: A Case Study.” Expert Systems with Applications 184:115508. https://doi.org/10.1016/j.eswa.2021.115508.
- Belussi, L., B. Barozzi, A. Bellazzi, L. Danza, A. Devitofrancesco, C. Fanciulli, M. Ghellere, et al. 2019. “A Review of Performance of Zero Energy Buildings and Energy Efficiency Solutions.” Journal of Building Engineering 25:100772. https://doi.org/10.1016/j.jobe.2019.100772.
- Biswas, M. A. R., M. D. Robinson, and N. Fumo. 2016. “Prediction of Residential Building Energy Consumption: A Neural Network Approach.” Energy 117:84–92. https://doi.org/10.1016/j.energy.2016.10.066.
- Chen, B., Q. Liu, H. Chen, L. Wang, T. Deng, L. Zhang, X. Wu. et al. 2021. “Multiobjective Optimization of Building Energy Consumption Based on BIM-DB and LSSVM-NSGA-II.” Journal of Cleaner Production 294:126153. https://doi.org/10.1016/j.jclepro.2021.126153.
- Chou, J.-S., and S.-M. Hsu. 2022. “Automated Prediction System of Household Energy Consumption in Cities Using Web Crawler and Optimized Artificial Intelligence.” International Journal of Energy Research 46 (1): 319–339. https://doi.org/10.1002/er.6742.
- Chou, J.-S., and N.-T. Ngo. 2016. “Smart Grid Data Analytics Framework for Increasing Energy Savings in Residential Buildings.” Automation in Construction 72:247–257. https://doi.org/10.1016/j.autcon.2016.01.002.
- Dubey, R., A. Gunasekaran, S. J. Childe, T. Papadopoulos, Z. Luo, S. F. Wamba, D. Roubaud. et al. 2019. “Can Big Data and Predictive Analytics Improve Social and Environmental Sustainability?” Technological Forecasting and Social Change 144:534–545. https://doi.org/10.1016/j.techfore.2017.06.020.
- Elnour, M., Y. Himeur, F. Fadli, H. Mohammedsherif, N. Meskin, A. M. Ahmad, I. Petri, et al. 2022. “Neural Network-Based Model Predictive Control System for Optimizing Building Automation and Management Systems of Sports Facilities.” Applied Energy 318:119153. https://doi.org/10.1016/j.apenergy.2022.119153.
- Fan, C., F. Xiao, C. Yan, C. Liu, Z. Li, and J. Wang. 2019. “A Novel Methodology to Explain and Evaluate Data-Driven Building Energy Performance Models Based on Interpretable Machine Learning.” Applied Energy 235:1551–1560. https://doi.org/10.1016/j.apenergy.2018.11.081.
- Firefly Algorithm, Y. X.-S. 2008. Nature-inspired Metaheuristic Algorithms. Bristol, UK: Luniver Press.
- Funde, N. A., M. M. Dhabu, A. Paramasivam, and P. S. Deshpande. 2019. “Motif-Based Association Rule Mining and Clustering Technique for Determining Energy Usage Patterns for Smart Meter Data.” Sustainable Cities and Society 46:101415. https://doi.org/10.1016/j.scs.2018.12.043.
- Guo, Y., J. Wang, H. Chen, G. Li, J. Liu, C. Xu, R. Huang, et al. 2018. “Machine Learning-Based Thermal Response Time Ahead Energy Demand Prediction for Building Heating Systems.” Applied Energy 221:16–27. https://doi.org/10.1016/j.apenergy.2018.03.125.
- Himeur, Y., A. Alsalemi, F. Bensaali, and A. Amira. 2021. “Smart Power Consumption Abnormality Detection in Buildings Using Micromoments and Improved K-Nearest Neighbors.” International Journal of Intelligent Systems 36 (6): 2865–2894. https://doi.org/10.1002/int.22404.
- Himeur, Y., K. Ghanem, A. Alsalemi, F. Bensaali, and A. Amira. 2021. “Artificial Intelligence Based Anomaly Detection of Energy Consumption in Buildings: A Review, Current Trends and New Perspectives.” Applied Energy 287:116601. https://doi.org/10.1016/j.apenergy.2021.116601.
- Hønsi, T., G. Hjetland, A. Nesse, A. Jorunn Fjærestad, C. Vasseng, and L.-F. Berntsen. 2021. “Highcharts Library.“ Accessed Apr 17, 2021. https://www.highcharts.com/
- Jahani, E., K. Cetin, and I. H. Cho. 2020. “City-Scale Single Family Residential Building Energy Consumption Prediction Using Genetic Algorithm-Based Numerical Moment Matching Technique.” Building and Environment 172:106667. https://doi.org/10.1016/j.buildenv.2020.106667.
- Jeong, J., T. Hong, C. Ji, J. Kim, M. Lee, K. Jeong, C. Koo, et al. 2017. “Development of a Prediction Model for the Cost Saving Potentials in Implementing the Building Energy Efficiency Rating Certification.” Applied Energy 189:257–270. https://doi.org/10.1016/j.apenergy.2016.12.024.
- JetBrains. 2021. JetBrains. IntelliJ IDEA. https://www.jetbrains.com/idea/
- Khan, I., A. Capozzoli, S. P. Corgnati, and T. Cerquitelli. 2013. “Fault Detection Analysis of Building Energy Consumption Using Data Mining Techniques.” Energy Procedia 42:557–566. https://doi.org/10.1016/j.egypro.2013.11.057.
- Kim, J.-Y., and S.-B. Cho. 2021. “Explainable Prediction of Electric Energy Demand Using a Deep Autoencoder with Interpretable Latent Space.” Expert Systems with Applications 186:115842. https://doi.org/10.1016/j.eswa.2021.115842.
- Linder, L., D. Vionnet, J.-P. Bacher, and J. Hennebert. 2017. “Big Building Data - a Big Data Platform for Smart Buildings.” Energy Procedia 122:589–594. https://doi.org/10.1016/j.egypro.2017.07.354.
- Liu, Y., H. Chen, L. Zhang, X. Wu, and W. X-J. 2020. “Energy Consumption Prediction and Diagnosis of Public Buildings Based on Support Vector Machine Learning: A Case Study in China.” Journal of Cleaner Production 272:122542. https://doi.org/10.1016/j.jclepro.2020.122542.
- Li, J., C. Zhang, Y. Zhao, W. Qiu, Q. Chen, and X. Zhang. 2022. “Federated Learning-Based Short-Term Building Energy Consumption Prediction Method for Solving the Data Silos Problem.” Building Simulation 15 (6): 1145–1159. https://doi.org/10.1007/s12273-021-0871-y.
- Luo, X. J., L. O. Oyedele, A. O. Ajayi, C. G. Monyei, O. O. Akinade, and L. A. Akanbi. 2019. “Development of an IoT-Based Big Data Platform for Day-Ahead Prediction of Building Heating and Cooling Demands.” Advanced Engineering Informatics 41:100926. https://doi.org/10.1016/j.aei.2019.100926.
- Ngo, N.-T., and T. T-T-H. 2019. “Forecasting Time Series Data Using Moving-Window Swarm Intelligence-Optimised Machine Learning Regression.” International Journal of Intelligent Engineering Informatics 7:422–440. https://doi.org/10.1504/IJIEI.2019.103625.
- Olu-Ajayi, R., H. Alaka, I. Sulaimon, F. Sunmola, and S. Ajayi. 2022. “Building Energy Consumption Prediction for Residential Buildings Using Deep Learning and Other Machine Learning Techniques.” Journal of Building Engineering 45:103406. https://doi.org/10.1016/j.jobe.2021.103406.
- Pham, A.-D., N.-T. Ngo, T. T. Ha Truong, N.-T. Huynh, and N.-S. Truong. 2020. “Predicting Energy Consumption in Multiple Buildings Using Machine Learning for Improving Energy Efficiency and Sustainability.” Journal of Cleaner Production 260:121082. https://doi.org/10.1016/j.jclepro.2020.121082.
- Rajabi, A., M. Eskandari, M. J. Ghadi, L. Li, J. Zhang, and P. Siano. 2020. “A Comparative Study of Clustering Techniques for Electrical Load Pattern Segmentation.” Renewable and Sustainable Energy Reviews 120:109628. https://doi.org/10.1016/j.rser.2019.109628.
- Ruiz, L. G. B., M. C. Pegalajar, R. Arcucci, and M. Molina-Solana. 2020. “A Time-Series Clustering Methodology for Knowledge Extraction in Energy Consumption Data.” Expert Systems with Applications 160:113731. https://doi.org/10.1016/j.eswa.2020.113731.
- Ruiz, L. G. B., R. Rueda, M. P. Cuéllar, and M. C. Pegalajar. 2018. “Energy Consumption Forecasting Based on Elman Neural Networks with Evolutive Optimization.” Expert Systems with Applications 92:380–389. https://doi.org/10.1016/j.eswa.2017.09.059.
- Sayed, A., Y. Himeur, A. Alsalemi, F. Bensaali, and A. Amira. 2022. “Intelligent Edge-Based Recommender System for Internet of Energy Applications.” IEEE Systems Journal 16 (3): 5001–5010. https://doi.org/10.1109/JSYST.2021.3124793.
- Sha, H., P. Xu, C. Yan, Y. Ji, K. Zhou, and F. Chen. 2022. “Development of a Key-Variable-Based Parallel HVAC Energy Predictive Model.” Building Simulation 15 (7): 1193–1208. https://doi.org/10.1007/s12273-021-0885-0.
- Sholahudin, N., P. Satrio, T. M. I. Mahlia, N. Giannetti, K. Saito, and K. Saito. 2019. “Optimization of HVAC System Energy Consumption in a Building Using Artificial Neural Network and Multi-Objective Genetic Algorithm.” Sustainable Energy Technologies and Assessments 35:48–57. https://doi.org/10.1016/j.seta.2019.06.002.
- Srivastava, C., Z. Yang, and R. K. Jain. 2019. “Understanding the Adoption and Usage of Data Analytics and Simulation Among Building Energy Management Professionals: A Nationwide Survey.” Building and Environment 157:139–164. https://doi.org/10.1016/j.buildenv.2019.04.016.
- Terroso-Saenz, F., A. González-Vidal, A. P. Ramallo-González, and A. F. Skarmeta. 2019. “An Open IoT Platform for the Management and Analysis of Energy Data.” Future Generation Computer Systems 92:1066–1079. https://doi.org/10.1016/j.future.2017.08.046.
- Tian, W., C. Zhu, Y. Sun, Z. Li, and B. Yin. 2021. “Energy Characteristics of Urban Buildings: Assessment by Machine Learning.” Building Simulation 14 (1): 179–193. https://doi.org/10.1007/s12273-020-0608-3.
- Tseng, F.-M., and G.-H. Tzeng. 2002. “A Fuzzy Seasonal ARIMA Model for Forecasting.” Fuzzy Sets and Systems 126 (3): 367–376. https://doi.org/10.1016/S0165-0114(01)00047-1.
- Varlamis, I., C. Sardianos, C. Chronis, G. Dimitrakopoulos, Y. Himeur, A. Alsalemi, F. Bensaali, et al. 2022. “Smart Fusion of Sensor Data and Human Feedback for Personalized Energy-Saving Recommendations.” Applied Energy 305:117775. https://doi.org/10.1016/j.apenergy.2021.117775.
- Walker, S., W. Khan, K. Katic, W. Maassen, and W. Zeiler. 2020. “Accuracy of Different Machine Learning Algorithms and Added-Value of Predicting Aggregated-Level Energy Performance of Commercial Buildings.” Energy and Buildings 209:109705. https://doi.org/10.1016/j.enbuild.2019.109705.
- Wang, Y., J. Wang, G. Zhao, and Y. Dong. 2012. “Application of Residual Modification Approach in Seasonal ARIMA for Electricity Demand Forecasting: A Case Study of China.” Energy Policy 48:284–294. https://doi.org/10.1016/j.enpol.2012.05.026.
- Wen, L., K. Zhou, and S. Yang. 2019. “A Shape-Based Clustering Method for Pattern Recognition of Residential Electricity Consumption.” Journal of Cleaner Production 212:475–488. https://doi.org/10.1016/j.jclepro.2018.12.067.
- Wilcox, T., N. Jin, P. Flach, and J. Thumim. 2019. “A Big Data Platform for Smart Meter Data Analytics.” Computers in Industry 105:250–259. https://doi.org/10.1016/j.compind.2018.12.010.
- Wong, C. H. H., M. Cai, C. Ren, Y. Huang, C. Liao, and S. Yin. 2021. “Modelling Building Energy Use at Urban Scale: A Review on Their Account for the Urban Environment.” Building and Environment 205:108235. https://doi.org/10.1016/j.buildenv.2021.108235.
- Wu, W., W. Lin, C.-H. Hsu, and L. He. 2018. “Energy-Efficient Hadoop for Big Data Analytics and Computing: A Systematic Review and Research Insights.” Future Generation Computer Systems 86:1351–1367. https://doi.org/10.1016/j.future.2017.11.010.
- Xu, C., and H. Chen. 2020. “A Hybrid Data Mining Approach for Anomaly Detection and Evaluation in Residential Buildings Energy Data.” Energy and Buildings 215:109864. https://doi.org/10.1016/j.enbuild.2020.109864.
- Yang, J., C. Ning, C. Deb, F. Zhang, D. Cheong, S. E. Lee, C. Sekhar. et al. 2017. “K-Shape Clustering Algorithm for Building Energy Usage Patterns Analysis and Forecasting Model Accuracy Improvement.” Energy and Buildings 146:27–37. https://doi.org/10.1016/j.enbuild.2017.03.071.
- Yang, J., J. Zhao, F. Wen, and Z. Dong. 2019. “A Model of Customizing Electricity Retail Prices Based on Load Profile Clustering Analysis.” IEEE Transactions on Smart Grid 10 (3): 3374–3386. https://doi.org/10.1109/TSG.2018.2825335.
- Yeo, J., Y. Wang, A. K. An, and L. Zhang. 2019. “Estimation of Energy Efficiency for Educational Buildings in Hong Kong.” Journal of Cleaner Production 235:453–460. https://doi.org/10.1016/j.jclepro.2019.06.339.
- Yuan, X., Y. Pan, J. Yang, W. Wang, and Z. Huang. 2021. “Study on the Application of Reinforcement Learning in the Operation Optimization of HVAC System.” Building Simulation 14 (1): 75–87. https://doi.org/10.1007/s12273-020-0602-9.
- Zekić-Sušac, M., S. Mitrović, and A. Has. 2020. “Machine Learning Based System for Managing Energy Efficiency of Public Sector as an Approach Towards Smart Cities.” International Journal of Information Management 58:102074. https://doi.org/10.1016/j.ijinfomgt.2020.102074.
- Zhao, T., J. Xu, C. Zhang, and P. Wang. 2021. “A Monitoring Data Based Bottom-Up Modeling Method and Its Application for Energy Consumption Prediction of Campus Building.” Journal of Building Engineering 35:101962. https://doi.org/10.1016/j.jobe.2020.101962.
- Zhou, K., C. Fu, and S. Yang. 2016. “Big Data Driven Smart Energy Management: From Big Data to Big Insights.” Renewable and Sustainable Energy Reviews 56:215–225. https://doi.org/10.1016/j.rser.2015.11.050.
- Zhu, J., Y. Shen, Z. Song, D. Zhou, Z. Zhang, and A. Kusiak. 2019. “Data-Driven Building Load Profiling and Energy Management.” Sustainable Cities and Society 49:101587. https://doi.org/10.1016/j.scs.2019.101587.