
 ?Mathematical formulae have been encoded as MathML and are displayed in this HTML version using MathJax in order to improve their display. Uncheck the box to turn MathJax off. This feature requires Javascript. Click on a formula to zoom.
ABSTRACT
In the context of large-scale rural construction in China, scientific and effective cognition and evaluation of the visual quality of public space in traditional villages is very important for improving the spatial quality of traditional villages. This study builds a cognitive and evaluation mechanism about the visual quality of public space in traditional villages by focusing on eye tracking techniques in ergonomic analysis, combining the results of subjective questionnaires and empirical judgments about the spatial perception of traditional villages. Lixiang Village in Nanjing is selected as a case to explore a scientific analysis of the visual quality of public spaces in traditional villages by using eye tracking technology to collect the subjects’ observation of different types of public spaces in the village and combining the results of the subjective questionnaire. The results of the study showed that the correlations between subjects’ subjective ratings and eye movement data are not as strong, but only moderate for some of these indicators. Moreover, buildings and structures are the most important factors in shaping the richness of public space. Finally, relevant design suggestions and strategies are proposed: in traditional village public spaces, the visual quality of structures and surrounding enclosing buildings should be focused on enhancing, while the focus should be on optimizing the orientation of paths, and also on shaping the unique visual impression of each public space.
1. Introduction
Traditional villages are an important carrier of traditional Chinese culture and show the unique value of traditional Chinese aesthetics. As of 2023, China has published six batches of traditional village lists, of which 1,336 villages have been selected for the sixth batch of traditional village lists (undefined). The layout and structure of traditional villages, the various forms of architectural remains, and the elaborate and delicate construction and decoration all contain strong construction characteristics and show a unique regional culture. These layout structures, architectural remains, and structural decorations together constitute the space of traditional villages, a collection formed by the interaction of natural landscape factors and human landscape factors, which is not only the inheritance of culture, but also the representation of history. In traditional villages, public space, as an important nodal space, including the village entrance square, street nodes and public areas between residential buildings, etc., is usually assigned many important functions and meanings. In this study, public space in traditional villages mainly refers to an open area that can be distinguished from other buildings and environmental elements with the help of boundaries, while forming a clearly identifiable area (Abusaada and Elshater Citation2021). The villagers’ daily gatherings, leisure and entertainment, as well as cultural and ceremonial activities of local characteristics, etc., almost all take place in these public spaces, so public space can be seen as the core space in traditional villages (Zhang, Hong, and Lin Citation2022). In today’s Chinese countryside, there are still a large number of traditional villages with mainly vernacular architecture, and the public spaces in these villages still carry many villagers’ daily lives and activities. Only through an in-depth analysis and evaluation of the public space of traditional villages in terms of both physical form and cognitive mechanism can we truly understand the spatial characteristics of traditional villages, so that we can better carry out a series of work on the protection, renewal and development of these traditional villages in the context of the current strategy of “Rural Revitalization”.
The past research on village space was mainly based on field mapping to obtain basic data, from the initial mapping of a single individual building to the current data collection of villages within a certain geographical area by tilt photography of drones (Zhang, Chen, and Zhou Citation2017). Although the collection means are increasingly advanced, it is still mainly qualitative research, relying on subjective feelings and empirical judgments in most cases, lacking objectivity and scientificity. Research on quantitative cognition of people in village space has been rarely conducted due to the lack of effective technical methods. For example, what are the most attractive places for people to walk in the village? How to analyze the quality of public space in traditional villages from the perspective of “people-centeredness”? Which physical features of traditional village public space are remembered and how are they formed? The answers to these questions depend on the quantitative description and interpretation tools of spatial cognition research.
Eye tracking is a technology that has been widely used in recent years. By tracking the subjects’ gaze points and eye movements, the eye tracker allows for an objective analysis of which factors capture their attention (De Lucio et al. Citation1996). Eye tracking technology was first applied in interaction design, graphic design, industrial design and game design, and was closely related to psychology and behavior such as educational psychology, consumer psychology, cognitive psychology and traffic behavior (Antúnez et al. Citation2019; Dong et al. Citation2018; Gruden, Ištoka Otković, and Šraml Citation2021; Ponce et al. Citation2018). In recent years, eye tracking technology has been gradually adopted by scholars in architecture and landscape, especially in the landscape profession, showing a rapid rise in research, mainly using eye tracking to evaluate urban green spaces, forest landscapes, and landscape aesthetics (Dupont, Antrop, and Van Eetvelde Citation2014; Franěk, Petružálek, and Šefara Citation2019; Khachatryan et al. Citation2020; Liu et al. Citation2022; Liu, Hu, and Zhao Citation2019; Zhang et al. Citation2019). At the architectural level, it is mainly divided into urban street and public space (Hollander et al. Citation2018; Li et al. Citation2021; Weiyi et al. Citation2022); exterior features of single buildings (Berni et al. Citation2022; Cho Citation2016; de la Fuente Suárez Citation2020; Li et al. Citation2022; Lisińska-Kuśnierz and Krupa Citation2020); and visual characterization studies of interior environments (Hamedani et al. Citation2020, Citation2020; Lei, Yuan, and Lau Citation2021; Liu, Kang, and Xie Citation2020). In general, most of the studies are centered on landscape, urban and architectural spaces, and there are few studies using eye tracking techniques for village spaces.
In previous studies of eye tracking based assessment of building monolithic or spatial quality, there are two main categories in terms of research methods, one is a single study using only eye tracking method, and the other is a combination of eye tracking and subjective evaluation, which is usually presented in the form of a questionnaire. In the first type of studies, researchers focus on the analysis and discussion of eye movement indicators (Cho Citation2016; Li et al. Citation2022), but ignore the fact that eye movement analysis can only reflect the subjects’ attention level, but not the cognition and evaluation of the observed objects, for example, images with poor visual quality may also attract special attention from the subjects, so this study combines eye tracking with subjective evaluation in order to make a comprehensive evaluation of traditional village public space. In the second category of studies, although some scholars have used both methods in their studies, they have not linked the two data or compared the correlation (Berni et al. Citation2022). Other scholars have favored comparing eye tracking data with subjective experience to discover the relationship between them and provide more possibilities for conducting attention studies in real-world settings, rather than combining the two aspects to form a more comprehensive evaluation system (de la Fuente Suárez Citation2020). Therefore, this study prefers to combine subjective evaluation and eye-tracking analysis as a valid complement to each other, rather than to seek a correlation between the results of the two analyses. The combination of subjective evaluation, which can obtain the subjects’ ratings of physical space in different dimensions, and eye-tracking data recording, which can describe visual cognitive preferences more finely, is a more comprehensive and reasonable evaluation model.
The results of eye tracking experiments are presented as multidimensional eye movement indicators and graphical representations. Combined with existing studies, eye movement behavior is divided into two main phases: fixation, which is the point at which the subject gazes; and saccade, which is the movement of the eye from one gaze point to another (Blascheck et al. Citation2017; Li et al. Citation2022). The data obtained from eye tracking experiments are usually presented in three graphical representations: focus heat map, gaze plot map, and AOI interest map. In terms of eye movement metrics, the main ones are Total fixation duration (TFD), Average fixation duration (AFD), and Saccade counts (SC) (Holmqvist et al. Citation2022). In this study, these metrics and graphs are also selected accordingly to express the results of the eye tracking experiments.
In terms of the types of stimulus materials for eye-tracking experiments, previous studies have divided into three main categories: photographs, virtual reality, and real environments. Each of these three types of experimental materials has its own advantages and disadvantages. For example, if a photograph is used to conduct the experiment, it can effectively prevent the subject from being disturbed, but the change of the subject’s attention in the real scene is not known. Virtual reality allows for a more realistic assessment, but the experiment is still limited and the quality of the imaging in the virtual reality space cannot be guaranteed. The data obtained from the real environment may be the most relevant to the actual results, but the irrelevant and uncontrollable interference elements are also the highest (Berni et al. Citation2022; de la Fuente Suárez Citation2020). In summary, in this study, photographs were chosen as the stimulus material for the eye-movement experiment in order to ensure the operability and non-interference of the experiment.
Based on the eye tracking technology in human factors engineering, combined with the analysis results of subjective questionnaires and empirical judgments of spatial perception, this paper builds a cognitive and evaluation mechanism about the visual quality of traditional village public space, and tries to consider and study the value elements of traditional village public space through a combination of quantitative and qualitative approaches to explore a scientific and accurate analysis of the visual quality of traditional village public space.
2. Materials and methods
2.1. Technology roadmap
The technical route of this study is divided into two main veins (). First, a subjective questionnaire, with the help of semantic difference method and analytical hierarchy process (AHP), is used to judge and give scores to the value elements of traditional village public space, and then the questionnaire results are counted and scores are calculated through different weights of multi-dimensional evaluation indexes. The second is the eye tracking experiment, including data extraction and data filtering. Through the eye tracking experiment, we can get graphical information such as focus heat map, gaze plot map, AOI interest map, and basic eye movement data such as fixation duration and saccade counts. And these two clues are synthesized through empirical judgments of qualitative research on spatial characteristics of traditional villages, such as spatial layout, environmental elements, functional organization and material attributes, etc. These two paths are integrated to explore a scientific and accurate analysis of the visual quality of public space in traditional villages. And on this basis, design strategies and suggestions concerning the renewal and renovation of traditional village public spaces are put forward experimentally.
Figure 1. Technology roadmap.
2.2. Case selection
This study selects Lixiang Village in Lishui District, Nanjing City, Jiangsu Province, China as a case study. Lixiang Village is 60 km away from the main city of Nanjing, and most of the dwellings in the village were built in the late Qing Dynasty, with well preserved styles and features, and a large number of Red Army cultural sites. The village of Li Xiang was chosen for this study mainly because of its organic and rich overall form, diverse types of public spaces, and public node spaces throughout the village, which are highly representative.
2.3. Subjective questionnaire
The subjective questionnaire is used to obtain the subjects’ feelings and evaluations of the public space in traditional villages. The questions of the subjective questionnaire are set based on the semantic difference method, and the verbal scale is used to psychometrically measure the intuitive feelings of people, and the subjects are asked to score different dimensions (Gou and Wang Citation2011), and five gradients are set, with the scores of −2, −1, 0, 1, and 2 assigned respectively, to establish quantitative data of spatial evaluation from a subjective perspective (Zhuang Citation1996). Previous studies on public space in traditional villages have mostly evaluated and analyzed it from three main aspects: the richness of the historical environment, the properties of the space itself and the spatial carrying behavior (Chen and Chen Citation2019; Qi, Liang, and Xi Citation2019; Zhang, Hong, and Lin Citation2022; Zhang, Zhang, and Li Citation2023). At the same time, the following five dimensions are set in conjunction with the visual characteristics of public space focused on in this study and the questions set in the subjective questionnaire evaluation. In general, these five dimensions’ focus on the portrayal of human perceptions and feelings, reflecting the spatial properties and qualities of public space.
Openness: It refers to the degree of openness of public space to the outside world, which is mainly influenced by the size of open space, the spatial image of the guide entrance and other factors, and is an important index reflecting the degree of vitality of public space.
Sense of tradition: It refers to the degree of atmosphere in the public space of traditional villages, which is constituted by the buildings and structures in the site together with the surrounding landscape elements, etc. It is an important indicator of the historical appearance of traditional villages.
Richness: It refers to the overall visual richness of public space to people, including the order of architectural elements and landscape elements combined together, which is an important indicator reflecting the overall level of public space.
Comfortableness: It refers to the overall visual comfort of the public space, and this indicator is most directly related to human feelings.
Impression: It refers to the degree of impressiveness brought by public space, and is a key indicator of traditional village style shaping.
After completing the subjective questionnaire, through analytical hierarchy process (AHP), the weights of these five evaluation dimensions can be determined, and the comprehensive visual quality score of each public space scene can be calculated and thus ranked. AHP is a multi-objective comprehensive decision-making method that takes into account the advantages of both qualitative and quantitative analysis, making the comprehensive evaluation model of multiple indicators more reasonable and scientific.
The weighting ratio of the analytical hierarchy process method is derived from the comprehensive judgment of experts in the field (Li et al. Citation2020; Zhang, Zhang, and Li Citation2023). In this study, the relevant weight figures are obtained by inviting five experts who are more experienced in traditional village research to assign the corresponding weights to the five dimensions given.
2.4. Eye tracking
Eye tracking technique is used to measure and record the subject’s gaze point and eye movements, and the eye tracker is the device used to measure this process. The eye tracking technique allows objective analysis of which factors attract the subject’s attention, and also allows obtaining rich data about attention and cognitive level.
With Tobii Lab, a platform software related to eye tracking, the acquired experimental data can be transformed into a diversity of images, most notably focus heat map, gaze plot map and AOI interest map. The focus heat map refers to the use of different colors on a picture or scene to present the subject’s visual dwell time in a certain area. The gaze plot map is the sequence and position of gaze points presented on a picture or scene, i.e. the trajectory of gaze points. The AOI (Area of interest) interest map refers to the regional division of the elements of interest for the study, and Tobii Lab allows to derive the relevant gaze data for the region of interest in the eye tracking experiment sample. With Tobii Lab, eye movement data such as fixation duration, fixation frequency, saccade counts, and saccade frequency can also be obtained.
2.5. Statistical data analysis
After the completion of the subjective questionnaire and the eye tracking experiment, the respective data and results are tallied and the intercomparison and discussion of the two are initiated. In addition to the graphical combination analysis, the correlation analysis is performed using the Pearson coefficient in statistics, which is calculated by the CORREL function to derive the correlation coefficient between the variables, denoted by r. when r > 0, it indicates that the two variables are positively correlated; when r < 0, it is negatively correlated. The closer | r | is to 1, the stronger the correlation is. When | r |<0.3, it is a low degree correlation; when 0.3 < | r |<0.8, it is a moderate correlation; when 0.8 < | r |<1, it is a high correlation (Liu, Zhang, and Zhao Citation2019).
2.6. Experimental process
(1) Experimental equipment
The experimental equipment used in this experiment was a Tobii Glasses 2 eye tracker with an eye movement sampling rate of 100 Hz and a scene camera recording angle/viewpoint of 82° horizontal and 52° vertical.
(2) Subjects
Twenty subjects were selected for this study, with a male to female ratio of 1:1, and an age range of 20–25 years old, with normal naked or corrected visual acuity. All 20 subjects were students of the Department of Architecture or the Department of Urban and Rural Planning, and none of them had ever visited Li Xiang Village before.
(3) Experimental materials
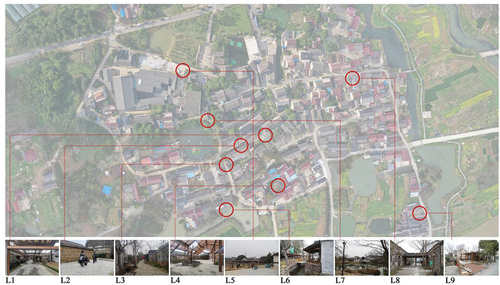
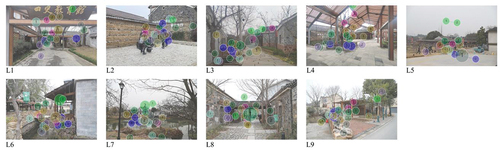
At the beginning of this study, field research was conducted in Li Xiang Village, and preliminary eye movement experiments and live-action filming were completed in the field. Since the video shaking amplitude recorded by eye tracking sampling in the actual environment is large, which is not conducive to the subsequent eye tracking data analysis, a supplementary experiment in the human factors engineering laboratory is set up and used as the basis for the subsequent analysis of eye tracking results. At the beginning of the supplementary experiment, scenes that could reflect the value elements of public space in Li Xiang Village are screened and nine photos are selected as the material for experimental observation. These nine photos could better summarize the more typical public space in Li Xiang Village and are more evenly distributed in the whole village. The scenes in these nine photos also represent four typical types of public spaces: L5 is the village entrance square; L7 is a public landscape space; L2, L4, L6, and L9 represent the public areas between residential buildings; L1, L3, and L8 represent public spaces dominated by transportation nodes and paths. The resolution and aspect ratio of the photos are adjusted to meet the needs of the eye movement experimental observation ().
Figure 2. Experimental materials of typical public space in Lixiang Village.
(4) Experimental steps
①Guide the subject to put on the eye tracker, adjust the angle of the device, and perform eye tracking calibration.
②After successful calibration, have the subject sit at about 2 m in front of the display screen and introduce the purpose, procedure and precautions of the whole experiment to the subject.
③Play nine sample photos of Li Xiang Village on the screen in turn, and set the playback duration of each photo to 7s, while the device starts to track and record the eye movement data.
④After the eye tracking experiment, the subjects are asked to fill in the subjective evaluation questionnaire.
3. Results of subjective questionnaire
3.1. Evaluation index weight
In the process of subjective evaluation, if there are multiple indicator dimensions, the weight each indicator occupies is the key factor affecting the final evaluation results. AHP, as a comprehensive multi-objective decision-making method, takes into account both qualitative and quantitative analysis methods, and can make scientific and uniform judgments on the research object. Therefore, the use of AHP is more reasonable and scientific than the previous method of taking average values.
(1) Construction of judgment matrix
To make judgments using AHP, it is necessary to first construct a hierarchical model, organize the five selected indicator dimensions, assign values to these indicators and compare every two with each other. When the value is 1, it means that the two indicators have the same weight, and the indicator with the larger value has a higher importance than the other one. This level of assignment and comparison is generally derived through the opinions of relevant experts in this field. This study synthesizes the important established literature on public space research in traditional village studies, makes comparisons and judgments, and comes up with the following judgment matrix ().
Table 1. Judgment matrix of evaluation indicators.
(2) Calculation of the relative weights of each layer
The indicators are first normalized by vertical columns:
i=o (openness), s (sense of tradition), r (richness), c (comfortableness), I (impression)
j=o (openness), s (sense of tradition), r (richness), c (comfortableness), I (impression)
Then the normalization of the first column is calculated as:
And so on, the judgment matrix can be obtained as:
The matrices are then summed by row:
The calculations lead to:
From this it is possible to calculate the weight vector:
The calculation yields:
Ultimately it is possible to obtain:
These are the weighting factors for each of the five indicator dimensions.
(3) Consistency test for weighting results
Calculate the maximum characteristic roots of the judgment matrix:
Calculation of the consistency index CR:
The calculations lead to:
Where RI is taken to be 1.12 when using the five-level AHP, as can be seen by checking the table.
Since CR < 0.1, the matrix can be judged to be consistent, i.e., satisfactorily consistent, and therefore the calculated weighting factors meet the requirements.
In summary, the sense of tradition has the greatest weighting at 0.305, followed by impression at 0.229, then richness at 0.162, comfortableness at 0.154, and the lowest is openness at 0.150.
3.2. Subjective evaluation analysis
Combining the subjective questionnaires filled out by 20 subjects, the L1-L9 public spaces in Li Xiang Village are rated according to five dimensions: openness, sense of tradition, richness, comfortableness, and impression, and the average value of each scene in each dimension is calculated and then weighted according to the weights derived above, resulting in , and these results are transformed into line graphs to obtain . From the five indicators, the subjects are most satisfied with the openness of the public space in Li Xiang Village, with a score of 1.119, followed by similar ratings for richness, comfortableness, and sense of tradition, all around 0.7, and the lowest rating for impression, with only 0.349. Among the total 45 individual scores, the only two negative scores also come from the impression rating, one is L3 and the other one is L9.
Figure 3. Line chart of subjective questionnaire results.
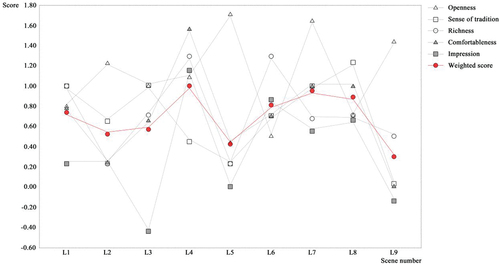
Table 2. Statistics of subjective questionnaire results (point).
After the weighted calculation, the composite score of each scenario is compared, and the subjects’ composite score for L4 is the highest and the only one over 1 among the 9 scenarios. While the composite score of L9 is the lowest, much lower than the other 8 scenes, and the composite score of L5 is also lower. The following information can also be drawn from the line graph: scenarios with high composite scores usually show a more balanced relationship among the five indicators, and 1–2 or even more of them are outstandingly high, in contrast, if 1–2 of the five indicators have abnormally low scores, it will also lower the final composite score of the scenario.
In conclusion, in subjective evaluation, the spatial quality of a scene is influenced and constrained by several factors together, and the score calculated according to the weights is only a preliminary and approximate spatial cognitive impression. Therefore, by combining eye tracking technology to record and measure subjects’ gaze data, visual cognitive preferences can be identified more carefully and objectively, and provide more detailed explanations and supplements for spatial cognitive results.
4. Results of eye tracking
4.1. Focus heat map
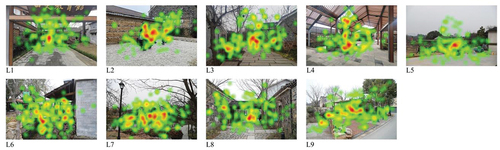
The focus heat map presents the overall distribution of gaze points with the superposition of color gradients. The redder the color, the longer the eye looks at the target or area, so the relationship between gaze duration and color is: red > yellow > green. The focus heat map is one of the most straightforward graphs to quickly present which elements or areas receive more attention (Bojko Citation2009). In this experiment, the photos of each scene were played on the screen for 7s, so the focus heat maps were calculated for the eye movement data during the 7s time. The focus heat map generated from the overlay of all subjects () shows that the subjects’ visual focus was concentrated in the central area of the scene picture, but also reflected different characteristics. L1, L3 and L8 are the three scenes in the center of which the path extending to the front is the most attention-grabbing area in the whole scene picture; L2, L4, L6 and L9 are the landscape sculptures, tree ponds, pedestrian bridges and other structures in the center of the picture that attract the most visual attention; L5 and L7 are the groups of buildings in the picture that attract the most visual attention of the subjects. From the results of the above focus heat map, the following conclusions can be tentatively drawn: the subjects are most concerned about the path-oriented nature of the public space in traditional villages, and they are more concerned about the physical elements such as the structures in the public space and the facades of the building groups on the enclosing surfaces of the public space.
Figure 4. Focus heat map of eye tracking.
4.2. Gaze plot map
The gaze plot map is a visual trajectory map in the form of dots and connecting lines, which can objectively and directly represent the sequential position and jumping trajectory of the subject’s eye movement gaze during observation. Unlike the previously focus heat map, in order to more accurately analyze subjects’ gaze trajectory jumps within the first small period of time of observing each scene, instead of choosing a time length of 7s, the first 0.5s (500 ms) time category was selected as the statistical range based on the actual eye-movement data of all subjects (Blascheck et al. Citation2017). The superimposed gaze trajectories generated for all subjects () showed that subjects’ gaze mostly fell at the center of the picture at first, which was also closely related to the usual eye movements, and then shifted to other regions (Carrasco Citation2011). The second and third gaze points fall mostly on the structures near the center of the picture, such as the sign and wooden structure in L1, the sculpture in L2, the electric pole in L3, the wooden structure and tree pond in L4, the wooden canopy in L6, and the wooden gazebo in L8 and L9. In addition to this, some of the subsequent gaze points in L1 also fall in front of the path leading to it, and some of the subsequent gaze points in L5 and L7 also fall on the buildings in the scene. This leads to the preliminary conclusion that subjects tend to start their attention from the very center of the picture at the very beginning of their observation, and then move mostly to the structures near the central area, and partly to the front area leading to the path and to the buildings in the picture.
Figure 5. Gaze plot map of eye tracking.
4.3. AOI interest map
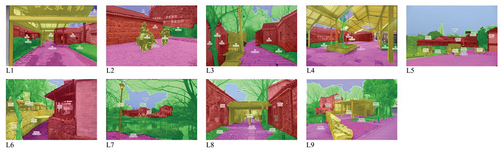
AOI interest analysis is performed by selecting a specific stimulus target area and extracting the corresponding eye-movement metrics within the scope of that area (Holmqvist et al. Citation2022). Although this is not a metric in the strict sense, it can be used to define, to some extent, a standard region for the measurement and calculation of eye movement metrics (De Smet et al. Citation2014; Hessels et al. Citation2016). Based on the multiple photos of public spaces collected on site, the AOI of each public space was divided into five partitions according to the characteristics of typical elements of public spaces: building, structures (including signs, wooden structures, wooden pavilions, rain shelters, sculptural artifacts, tree ponds, utility poles, pedestrian wooden bridges, etc.), floor covering, sky, and vegetation (). Three main metrics were used in the AOI interest analysis: Total fixation duration (TFD, in milliseconds), Average fixation duration (AFD, in milliseconds), and Saccade counts (SC, in times).
Figure 6. AOI element partition diagram.
The TFD is the sum of all gaze times within a single area of interest. A longer TFD not only means that the area attracts the subject’s attention, but also indicates the more difficult the subject’s cognitive processing of the relevant spatial elements within the area (Behe et al. Citation2015). shows the total fixation duration of each area of interest for the nine scenes. The structures had the longest total fixation duration with an average of 1589 ms, followed by buildings and landscape vegetation with 1335 and 904 ms, respectively, then ground pavement, and finally sky. This reflects that the subjects’ fixation duration for different areas of interest was ranked as follows: structures, buildings, vegetation, floor covering, and sky respectfully, while the spatial elements of structures and buildings in the real village environment were more complex, so the subjects’ cognitive processing of them was also slower.
Table 3. Total fixation duration of each AOI (millisecond).
AFD indicates the average time subjects spent gazing within an area of interest, the longer the AFD, the longer the average fixation received by the area of interest, and the more difficult it is for the subject to identify the elements in the area of interest. shows the average fixation duration of each area of interest for the nine scenes, in the following order: structures, buildings, vegetation, floor covering, and sky, which is consistent with the previous order of total fixation duration. This also shows that structures are the most concerned and difficult to be identified in the public space of traditional villages, and it can also be said that structures are the most complex part of the constituent elements in the whole public space. Next in order are buildings, vegetation and floor covering.
Table 4. Average fixation duration of each AOI (millisecond).
The eye movement between two gaze points is called saccade, and it responds to changes in the trajectory of eye movement and whether the gaze position changes. In general, the higher the saccade counts (SC), the greater the recognition effort consumed by the subject for the elements in that area, i.e., the higher the degree to which the eye recognizes and processes this area. Looking at the saccade counts in each area of interest (), it also maintains a high degree of unity with the ranking of the previous two indicators, also structures, buildings, vegetation, floor covering, and sky. However, it should be noted that the difference between the saccade counts for structures and buildings is smaller than the difference between both of the previous two indicators, which indicates, on the other hand, that both structures and buildings in the traditional village public space are very attractive to the subjects’ attention, and the subjects will place the maximum eye recognition effort on these two elemental parts.
Table 5. Saccade counts of each AOI (times).
5. Comparison and discussion
This study combines eye tracking and subjective questionnaires to explore a new evaluation study of public space in traditional villages. Among them, the focus heat map can visually reflect the duration of subjects’ attention to different elements in the public space; the gaze plot map can reflect the changes of subjects’ gaze focus and trajectory on the observed objects; the AOI interest map can be classified according to the types of spatial elements for comparative studies. The results of the subjective questionnaire can reflect the subjects’ impressions and detailed evaluation scores of different public spaces. In general, the focus heat map and gaze plot map express graphical results from the qualitative aspect, while the AOI interest map and subjective questionnaire express more precise results from the quantitative analysis.
A more comprehensive result can be obtained by comparing the three indicators in the AOI interest analysis with the composite score of the subjective evaluation (). Except for individual data, the rest of the results show a more coordinated consistency, and the correlations between these variables are analyzed, using the Pearson correlation coefficient in statistics, which is calculated by the CORREL function to derive the respective correlation coefficients, expressed as r, as shown in .
Figure 7. Comparison between subjective evaluation results and eye movement data.
Table 6. Correlation analysis between subjective evaluation score and eye movement data.
From the results, it can be seen that TFD shows moderate positive correlation with openness, moderate negative correlation with sense of tradition, and low correlation with the other three indices. AFD shows low correlation with these five indices. SC shows moderate positive correlation with openness, moderate negative correlation with comfortableness, and low correlation with the other three indices. In addition, none of these three indicators of eye movement data have a correlation of 0.3 with the composite score.
From the results of the above comparative analysis, it can be found that the correlation between subjects’ subjective evaluations and eye movement data for the same study subjects is not that strong, but only moderate in some of these indicators. The previous more preconceptions that there is a certain correlation between people’s visual attention and their evaluation of physical space, but the experimental results show that this preconception is only a subjective judgment and deviates to some extent from the real comparison results. Therefore, in spatial cognition research incorporating eye tracking technology, subjective evaluation and eye tracking analysis should be combined and regarded as effective complements to each other, rather than seeking a correlation between the two analysis results. The combination of subjective evaluation based on AHP, which can obtain subjects’ ratings of physical space in different dimensions, and eye tracking data recording, which can describe visual cognitive preferences more finely, is a more comprehensive and reasonable evaluation model. The results of this study can provide more comprehensive scientific suggestions and strategies for the enhancement and renovation of public spaces in traditional villages, and assist design professionals in architecture and planning to make better judgments and decisions.
There are still some limitations and shortcomings in our study. The first is the use of experimental materials, the photographs used in the experiment cannot completely replace the actual traditional village public space, and the experimental results will be largely influenced by the effects of the photographs taken. In addition, the differences in the visual perception of traditional village public space under different seasonal conditions are not taken into account. Finally, the selection of subjects, due to the different age, gender, cultural level, and professional background of the subjects, can cause differences in the experimental results, so more different types of test samples are needed to improve the accuracy of the data. In the experiments of this study, the subjects selected are all students from architecture or planning majors, in order to study the evaluation of public space in traditional villages from the perspective of design and planning, and subsequent deeper studies need to include more people with different majors and backgrounds, including management decision makers of traditional villages, local villagers, tourists and others (Xu and Li Citation2014).
6. Conclusion
Based on eye tracking technology, this study explores a new evaluation model of public spaces in traditional villages, and the results of the study are as follows:
In the subjective evaluation, the subjects are most satisfied with the openness of the public space in Li Xiang Village and rated the lowest for the impression. And among the nine selected scenes, the subjects have the highest comprehensive evaluation of L4 and the lowest of L9.
In the eye tracking experiment, subjects pay the most attention to path-orientedness in the public space of traditional villages. At the very beginning of the observation, attention tends to start from the middle of the picture, and then mostly shifts to the structures near the central area. The fixation duration for different areas of interest is ranked as follows: structures, buildings, vegetation, floor covering, sky.
The correlations between subjects’ subjective ratings and eye movement data are not as strong, but only moderate for some of these indicators. For example, TFD has a moderate positive correlation with openness and a moderate negative correlation with sense of tradition, while SC has a moderate positive correlation with openness and a moderate negative correlation with comfortableness. However, the addition of eye tracking technology can more effectively and accurately capture the subjects’ perceptions and evaluations of traditional village public spaces. Therefore, neither type of data can be adopted independently, nor are they contradictory to each other; they are evaluated and perceived from different levels of the research object, and need to be judged in combination.
Buildings and structures are the most important factors in shaping the richness of public space, and vegetation is the more important factor in shaping the comfort of public space.
Based on the findings, we propose the following design strategies for the renewal and transformation of public spaces in traditional villages: ① Focus on maintaining and creating the unique imagery of each traditional village public space, try to transform and update it on the basis of the original inherited historical pattern, and avoid a uniform copy and reproduction; ② Focus on improving the visual quality of public space structures and surrounding enclosed buildings, mainly in the integration, restoration and renovation of facades, especially for doors, windows and other detailed components, which need to be designed with emphasis to maintain the original architectural style and characteristics as much as possible; ③ Pay attention to the design of landscape vegetation in public spaces, which requires attention not only to the location and area of planting, but also to the variety and matching of species, as well as the beauty of the canopy skyline; ④ In public spaces with traffic functions, emphasis should be placed on the path-oriented type, optimizing the image of path entrances and exits to give them distinctive characteristics; ⑤ On the basis of ensuring the openness of public spaces, efforts should be made to create a sense of traditional atmosphere, such as through the use of historical and traditional paving textures, corresponding sculptures and other structures, as well as other public cultural facilities, to collaborate and combine.
In the context of today’s steadily advancing rural revitalization strategy, this study is particularly important for improving the visual quality of public spaces in traditional villages. Combining the results of eye tracking experiments and subjective questionnaire surveys, a new evaluation of traditional village public space can be made from the perspective of human perception of space, exploring which scenes and elements affect people’s visual cognitive experience of traditional village public space. In turn, the quality of traditional village public space can be analyzed, the spatial optimization elements and design points can be summarized, and corresponding design guidelines can be formed to provide scientific design basis for the protection and renewal of traditional villages in a graded and classified manner.
In the follow-up study, the reasons for the inconsistent data between the eye tracking experiment data and the subjective questionnaire results can be further explored, these might be attributed either to the insufficient sample size of the eye tracking experiment or to the setting of the subjective questionnaire questions. In the process of actual evaluation, these two aspects of data can be corrected for each other. Meanwhile, the eye tracking technology can be applied to VR real environment simulation, and more traditional village scenes that need to be evaluated and assessed can be simulated through scene reproduction in the laboratory to improve the efficiency and accuracy of spatial evaluation.
Disclosure statement
No potential conflict of interest was reported by the authors.
Additional information
Funding
Notes on contributors
Yu Xing
Yu Xing PhD candidate of the School of Architecture, Southeast University, the research direction is: research on village space evaluation from the perspective of human factors engineering technology.
Jiawei Leng
Jiawei Leng Professor and doctoral supervisor of the School of Architecture, Southeast University, the research directions are: research on the optimization design of buildings and Built environment, and research on the combination of urban overground and underground space.
References
- Abusaada, H., and A. Elshater. 2021. “Revealing Distinguishing Factors Between Space and Place in Urban Design Literature.” Journal of Urban Design 26 (3): 319–340. https://doi.org/10.1080/13574809.2020.1832887.
- Antúnez, L., L. Machín, G. Ares, and S. R. Jaeger. 2019. “Visual Attention to Rate-All-That-Apply (RATA) Questions: A Case Study with Apple Images as Food Stimuli.” Food Quality and Preference 72:136–142. https://doi.org/10.1016/j.foodqual.2018.10.007.
- Behe, B. K., M. Bae, P. T. Huddleston, and L. Sage. 2015. “The Effect of Involvement on Visual Attention and Product Choice.” Journal of Retailing and Consumer Services 24:10–21. https://doi.org/10.1016/j.jretconser.2015.01.002.
- Berni, A., S. Altavilla, L. Ruiz-Pastor, C. Nezzi, and Y. Borgianni 2022. An Eye-Tracking Study to Identify the Most Observed Features in a Physical Prototype of a Tiny House. Proceedings of the Design Society; Volume 2, Page 841–850; ISSN 2732-527X. https://doi.org/10.1017/pds.2022.86.
- Blascheck, T., K. Kurzhals, M. Raschke, M. Burch, D. Weiskopf, and T. Ertl. 2017. “Visualization of Eye Tracking Data: A Taxonomy and Survey.” Computer Graphics Forum 36 (8): 260–284. https://doi.org/10.1111/cgf.13079.
- Bojko, A. 2009. “Informative or Misleading? Heatmaps Deconstructed.” In Human-Computer Interaction. New Trends. HCI 2009. Lecture Notes in Computer Science, J. A. Jackoedited by, 30–39. Berlin: SpringerVol. 5610. https://doi.org/10.1007/978-3-642-02574-7_4.
- Carrasco, M. 2011. “Visual Attention: The Past 25 Years.” Vision Research 51 (13): 1484–1525. https://doi.org/10.1016/j.visres.2011.04.012.
- Chen, X. H., and Q. Q. Chen. 2019. “Review of the Studies on Public Space of China’s Traditional Villages.” Journal of Anhui Agricultural University (Social Sciences Edition) 28 (6): 25–32+58. In Chinese. https://doi.org/10.19747/j.cnki.1009-2463.2019.06.005.
- Cho, H. 2016. “A Study on the Comparison of the Visual Attention Characteristics on the Facade Image of a Detached House Due to the Features on Windows.” Journal of Asian Architecture and Building Engineering 15 (2): 209–214. https://doi.org/10.3130/jaabe.15.209.
- de la Fuente Suárez, L. A. 2020. “Subjective Experience and Visual Attention to a Historic Building: A Real-World Eye-Tracking Study.” Frontiers of Architectural Research 9 (4): 774–804. https://doi.org/10.1016/j.foar.2020.07.006.
- De Lucio, J. V., M. Mohamadian, J. P. Ruiz, J. Banayas, and F. G. Bernaldez. 1996. “Visual Landscape Exploration as Revealed by Eye Movement Tracking.” Landscape and Urban Planning 34 (2): 135–142. https://search.ebscohost.com/login.aspx?direct=true&db=edscal&AN=edscal.5977991&lang=zh-cn&site=eds-live.
- De Smet, B., L. Lempereur, Z. Sharafi, Y.-G. Guéhéneuc, G. Antoniol, and N. Habra. 2014. “Taupe: Visualizing and Analyzing Eye-Tracking Data.” Science of Computer Programming 79:260–278. https://doi.org/10.1016/j.scico.2012.01.004.
- Dong, W., L. Zheng, B. Liu, and L. Meng. 2018. “Using Eye Tracking to Explore Differences in Map-Based Spatial Ability Between Geographers and Non-Geographers.” Canadian Historical Review 7 (9). https://doi.org/10.3390/ijgi7090337.
- Dupont, L., M. Antrop, and V. Van Eetvelde. 2014. “Eye-Tracking Analysis in Landscape Perception Research: Influence of Photograph Properties and Landscape Characteristics.” Landscape Research 39 (4): 417–432. https://doi.org/10.1080/01426397.2013.773966.
- Franěk, M., J. Petružálek, and D. Šefara. 2019. Eye Movements in Viewing Urban Images and Natural Images in Diverse Vegetation Periods. Vol. 46. Urban Forestry & Urban Greening. https://doi.org/10.1016/j.ufug.2019.126477.
- Gou, A. P., and J. B. Wang. 2011. “SD Method Based Street Space Vitality Evaluation.” Planners 27 (10): 102–106. In Chinese. https://kns.cnki.net/kcms/detail/detail.aspx?dbcode=CJFD&dbname=CJFD2011&filename=GHSI201110021&uniplatform=NZKPT&v=8U7C_UJ-MQowLnmEyjksmjFvS2ScfybACp_T_moTXr1RedUIeeA8sxrTDqN7Maro.
- Gruden, C., I. Ištoka Otković, and M. Šraml. 2021. “Pedestrian Safety at Roundabouts: Their Crossing and Glance Behavior in the Interaction with Vehicular Traffic.” Accident Analysis and Prevention 159. https://doi.org/10.1016/j.aap.2021.106290.
- Hamedani, Z., E. Solgi, T. Hine, and H. Skates. 2020. “Revealing the Relationships Between Luminous Environment Characteristics and Physiological, Ocular and Performance Measures: An Experimental Study.” Building & Environment 172. https://doi.org/10.1016/j.buildenv.2020.106702.
- Hessels, R. S., C. Kemner, C. van den Boomen, and I. T. C. Hooge. 2016. “The Area-Of-Interest Problem in Eyetracking Research: A Noise-Robust Solution for Face and Sparse Stimuli.” Behavior Research Methods 48 (4): 1694–1712. https://doi.org/10.3758/s13428-015-0676-y.
- Hollander, J. B., A. Purdy, A. Wiley, V. Foster, R. J. Jacob, H. A. Taylor, and T. T. Brunyé. 2018. “Seeing the City: Using Eye-Tracking Technology to Explore Cognitive Responses to the Built Environment.” Journal of Urbanism: International Research on Placemaking and Urban Sustainability 12 (2): 156–171. https://doi.org/10.1080/17549175.2018.1531908.
- Holmqvist, K., S. L. Örbom, I. T. C. Hooge, D. C. Niehorster, R. G. Alexander, R. Andersson, J. S. Benjamins, et al. 2022. “Eye Tracking: Empirical Foundations for a Minimal Reporting Guideline.” Behavior Research Methods 55 (1): 364–416. https://doi.org/10.3758/s13428-021-01762-8.
- Khachatryan, H., A. Rihn, G. Hansen, and T. Clem. 2020. “Landscape Aesthetics and Maintenance Perceptions: Assessing the Relationship Between Homeowners’ Visual Attention and Landscape Care Knowledge.” Land Use Policy 95. https://doi.org/10.1016/j.landusepol.2020.104645.
- Lei, Q., C. Yuan, and S. S. Y. Lau. 2021. “A Quantitative Study for Indoor Workplace Biophilic Design to Improve Health and Productivity Performance.” Journal of Cleaner Production 324:324. https://doi.org/10.1016/j.jclepro.2021.129168.
- Li, X., Y. Li, Y. P. Ren, and A. Lusk. 2020. “Research on the Urban Spatial Visual Quality Based on Subjective Evaluation Method and Eye Tracking Analysis.” In Chinese Architectural Journal S2:190–196. https://kns.cnki.net/kcms/detail/detail.aspx?FileName=JZXB2020S2032&DbName=CJFQ2020.
- Lisińska-Kuśnierz, M., and M. Krupa. 2020. “Suitability of Eye Tracking in Assessing the Visual Perception of Architecture—A Case Study Concerning Selected Projects Located in Cologne.” Buildings 10 (2): 20. https://doi.org/10.3390/buildings10020020.
- Li, Z., X. Sun, S. Zhao, and H. Zuo. 2021. “Integrating Eye-Movement Analysis and the Semantic Differential Method to Analyze the Visual Effect of a Traditional Commercial Block in Hefei, China.” Frontiers of Architectural Research 10 (2): 317–331. https://doi.org/10.1016/j.foar.2021.01.002.
- Liu, Y., M. Hu, and B. Zhao. 2019. Audio-Visual Interactive Evaluation of the Forest Landscape Based on Eye-Tracking Experiments. Vol. 46. Urban Forestry & Urban Greening. https://doi.org/10.1016/j.ufug.2019.126476.
- Liu, C., J. Kang, and H. Xie. 2020. “Effect of Sound on Visual Attention in Large Railway Stations: A Case Study of St. Pancras Railway Station in London.” Building & Environment 185. https://doi.org/10.1016/j.buildenv.2020.107177.
- Liu, L., H. Qu, Y. Ma, K. Wang, and H. Qu. 2022. “Restorative Benefits of Urban Green Space: Physiological, Psychological Restoration and Eye Movement Analysis.” Journal of Environmental Management 301. https://doi.org/10.1016/j.jenvman.2021.113930.
- Liu, J., Y. Zhang, and Q. Zhao. 2019. “Adaptive ViBe Algorithm Based on Pearson Correlation Coefficient. 2019 Chinese Automation Congress (CAC.” Chinese Automation Congress (CAC) 2019: 4885–4889. https://doi.org/10.1109/CAC48633.2019.8997209.
- Li, N., S. Zhang, L. Xia, and Y. Wu. 2022. “Investigating the Visual Behavior Characteristics of Architectural Heritage Using Eye-Tracking.” Buildings 12 (7). https://doi.org/10.3390/buildings12071058.
- Ministry of Housing and Urban-Rural Development and Other Departments on the Announcement of the Sixth Batch of the List of Villages Included in the List of Chinese Traditional Villages Notice, 2023. https://www.mohurd.gov.cn/gongkai/zhengce/zhengcefilelib/202303/20230320_770845.html. (Accessed May 15, 2023).
- Ponce, H. R., R. E. Mayer, M. S. Loyola, M. J. López, and E. E. Méndez. 2018. “When Two Computer-Supported Learning Strategies are Better Than One: An Eye-Tracking Study.” Computers & Education 125:376–388. https://doi.org/10.1016/j.compedu.2018.06.024.
- Qi, L., W. Liang, and M. Xi. 2019. “The Public Space Pattern Research of Guangfu Traditional Villages Based on Spatial Syntax: A Case Study of Huangpu Village in Guangzhou City, China.” IOP Conference Series: Earth and Environmental Science 267 (6): 062033. ISSN 1755-1307 1755-1315. https://doi.org/10.1088/1755-1315/267/6/062033.
- Weiyi, C., L. Zao, X. Xuan, L. Qingtao, L. Shi, X. Sun, K. Zhu, and Y. Shi. 2022. “Influence of Hospital Outdoor Rest Space on the Eye Movement Measures and Self-Rating Restoration of Staff Frontiers in Public Health.” Frontiers in Public Health 10. https://doi.org/10.3389/fpubh.2022.855857.
- Xu, D. W., and Y. J. Li. 2014. “Experts and Public Aesthetic Differences Based on SD-SBE Method.” In Chinese Chinese Landscape Architecture 7:52–56. https://kns.cnki.net/kcms/detail/detail.aspx?FileName=ZGYL201407014&DbName=CJFQ2014.
- Zhang, H. L., J. Chen, and C. S. Zhou. 2017. “Research Review and Prospects of Traditional Villages in China.” City Planning Review 41 (4): 74–80. In Chinese. https://doi.org/10.11819/cpr20170413a.
- Zhang, Y. J., Y. Hong, and L. Lin. 2022. “Study on Influencing Factors of Public Space Vitality of Mountainous Traditional Villages in Southern Zhejiang.” Development of Small Cities And Towns 40 (10): 84–92. In Chinese. https://doi.org/10.3969/j.issn.1009-1483.2022.10.011.
- Zhang, L. M., R. X. Zhang, T. S. Jeng, and Z. Y. Zeng. 2019. “Cityscape Protection Using VR and Eye Tracking Technology.” Journal of Visual Communication and Image Representation 64:102639. https://doi.org/10.1016/j.jvcir.2019.102639.
- Zhang, H. R., D. Y. Zhang, and W. S. Li. 2023. “Research on the Public Space Potential Evaluation and Improvement Countermeasures of Linggong Village Based on Convex Space Model.” Development of Small Cities & Towns 41 (4): 67–74+94. In Chinese. https://doi.org/10.3969/j.issn.1009-1483.2023.04.010.
- Zhuang, W. M. 1996. “SD Method Related to Evaluation of Architectural Space Objectives.” Journal of Tsinghua University (Science and technology) 4:42–47. In Chinese. https://doi.org/10.3969/j.issn.10091483.2022.10.011.