
ABSTRACT
Few empirical studies have examined the simultaneous effects of window opening and indoor plants on air characteristics. This study compared the effects of four variables, day/night, window status, plant distance, and number of plants, on air characteristics in a room at a basement via experiments. This was because plants perform photosynthesis during the day, which produces O2 and absorbs CO2, whereas they usually produce only CO2 at night. Moreover, a higher number of potted plants and a shorter distance to the plants are expected to generate greater air purification outcomes. Results included: (1) during the day and at night, the ventilation created by opening a window outperformed the transpiration from indoor plants in temperature reduction and humidity enhancement; (2) placing either three or eight potted plants indoor exhibited greater performance in reducing particulate matter (PM2.5 and PM10) and TVOC levels than opening a window; (3) a shorter distance (1.5 m) to the plant proved more effective in temperature reduction, humidity enhancement, and TVOC purification, whereas a longer distance (3.0 m) was discovered to have more effect on PM2.5 and PM10 reduction; and (4) eight potted plants significantly outperformed three in reducing temperature and increasing humidity.
1. Introduction
Approximately 30% of new buildings worldwide suffer from indoor air pollution problems (Kuo Citation2009). It was reported that household air pollution causes 3.7 million premature deaths every year (Gordon et al. Citation2014). Moreover, 4.1% of deaths worldwide are attributed to indoor air pollution (Ritchie and Roser Citation2013). The sources of indoor air pollution range from smoke emitted from fuel combustion to complex mixtures of volatile and semi-volatile organic compounds in modern buildings (Zhang and Smith Citation2003). The causes of indoor air pollution include outdoor air pollution, indoor combustion, building materials, paints and coatings, office machine, cleaning products, biological pollutants, and human activities and others (Indoor Air Quality Citationn.d.). Indoor air pollution is generally two to five times worse (sometimes up to 100 times worse) than outdoor air pollution (Environment Australia Citation2003; IAQ Citationn.d.), although there are some regions with serious outdoor air pollution.
In addition, people in contemporary society spend more time indoors, approximately more than 80% of their time every day (American Lung Association Citation2001), compared with their counterparts in the past, which highlights the importance of indoor air quality management for human health and well-being. There are three basic methods for improving indoor air quality: source control, improved ventilation, and air cleaners (Wolverton, Johnson, and Bounds Citation1989). Source control is usually the most effective way to improve indoor air quality (Wolverton, Johnson, and Bounds Citation1989), though it is sometimes difficult to implement as demonstrated by the fact that 30% of new buildings have indoor air pollution problems (Kuo Citation2009). By increasing the amount of outdoor air coming indoors, occupants can reduce the indoor air pollution and air temperature, when the outdoor is less polluted and the air temperature is lower than indoors. While natural ventilation such as opening windows does not cost energy, mechanical ventilation does cost energy (Wolverton, Johnson, and Bounds Citation1989). Similarly, air cleaners also cost energy.
Studies have demonstrated that indoor plants can significantly reduce the majority of urban air pollution (Coward et al. Citation1996; Irga, Torpy, and Burchett Citation2013; Kim et al. Citation2008; Orwell et al. Citation2004; Wood et al. Citation2006; Yoo et al. Citation2006). A recent systematic review also showed that the primary effects of indoor plants on air quality were pollution reduction (particularly formaldehyde, benzene, and toluene removal), followed by increases in relative humidity and decreases in air temperature. Nevertheless, most studies have been conducted in laboratories using small glass chambers rather than in actual settings (Han and Ruan Citation2020). Since indoor plants do not cost energy, opening windows and placing plants indoors appears to be the most energy-saving, environmental-friendly, and sustainable approach to improving the indoor air quality and moderate indoor microclimate. However, few empirical studies have investigated the effects of window opening and indoor plants on air quality, relative humidity, and air temperature.
To date, only two studies have focused on these related issues. One study revealed that the concentration of formaldehyde (HCHO) indoors did not decrease when windows were opened or plants were placed after evaluating the offices in six new and six old buildings (Kim et al. Citation2011). By contrast, the HCHO concentration decreased when these two methods were simultaneously applied. Further, in an office with high concentrations of benzene, toluene, ethylbenzene, and xylene, the simple act of opening windows helped reduce the presence of these pollutants, whereas simply placing plants indoors hardly reduced their concentrations. Additionally, analysis of a newly built elementary school classroom showed that the indoor air temperature and HCHO concentration from June to September significantly declined when the doors and windows were closed during the measurement, regardless of the presence of indoor plants (Kim et al. Citation2013). In the presence of indoor plants, the concentrations of benzene and ethylbenzene significantly declined, whereas they did not exhibit any significant difference when indoor plants were absent. However, the toluene concentration significantly decreased with the presence of indoor plants and significantly increased in their absence. Regardless of the presence of indoor plants, no significant difference in the relative humidity level was observed.
Although the aforementioned two field studies were closer to the real situation, they did not adopt an experimental approach, in which the window status (i.e. opened or closed) was controlled by the occupants at their will rather than controlled by the researchers as an experimental manipulation. This inhibited an accurate comparison between the effect of natural ventilation (by opening windows) and that of indoor plants on pollutant reduction and microclimate modification. Observational or cross sectional studies cannot conclude a cause-effect relationship (Frankfort-Nachmias and Nachmias Citation1996). Some impacts of outdoor/ambient air quality and/or identifiable indoor pollution sources appeared in these two field studies. One field study showed that the HCHO concentration decreased with windows opened and plants present, while the concentrations of benzene, toluene, ethylbenzene, and xylene were reduced simply with windows opened (Kim et al. Citation2013). Another field study found that indoor plants could reduce the concentrations of benzene, ethylbenzene, and toluene (Kim et al. Citation2013). Moreover, the aforementioned studies neglected to take into account the effects of time (day and night), the number of potted plants, and distance to the plants on air purification and microclimate regulation results in the presence of indoor plants. Because plants concurrently perform photosynthesis, produce oxygen (O2), and absorb carbon dioxide (CO2) during the day, they can considerably improve the air quality when placed indoors. Conversely, most plants produce only CO2 at night (C3 photosynthetic pathway), which renders them less helpful in the indoor air purification and microclimate modification.
Furthermore, recent empirical studies showed that more indoor plants resulted in higher relative humidity and lower PM2.5, PM10, and air temperature (Han Citation2019) and that HCHO and total volatile organic compound (TVOC) levels and air temperature were higher when the indoor plants were at 3.0 m than at 1.5 m (Han Citation2021).That is, with more plants and/or proximity to plants, better air purification and microclimate regulation effects could be achieved (Han Citation2019, Citation2021). This is because air purification and microclimate regulation depends on plant photosynthesis, adsorption, respiration, transpiration (Han Citation1998), and soil microbes (Kim et al. Citation2008; Orwell et al. Citation2004) and thus has an effective range. Therefore, the major purpose of this experimental study was to investigate the effects of the window being opened or closed and the presence of indoor plants on the indoor air characteristics. We treated window status (open vs. close), time (day vs. night), plant distance (near vs. far), and the number of potted plants (less vs. more) as variables and compared their respective effects on air quality, air temperature, and relative humidity to address this gap in the literature. The importance of this study is that it is the first experiment which manipulated four variables to examine their effects on air characteristics.
2. Materials and methods
The experiment of this study was conducted in a small rectangular room in the basement of a building at a Technology University in Taiwan, which was surrounded by other rooms and an interior corridor. This choice was deliberate, to prevent the influences of outdoor environment on indoor air temperature, relative humidity, and air quality. The room was used to simulate a real studying or working indoor setting with artificial light, although it may not be representative of all indoor environments. The dimensions of the room were 4.0 m × 3.0 m × 3.85 m, with a floor area of 12.0 m2. A door and an overhead window were on the side of the wall (area of 11.55 m2) facing the interior corridor. The dimensions of the door were 1.9 m × 0.96 m, and of the horizontal sliding window, 1.55 m × 1.25 m. The window was set 1.63 m above the floor. During the experiment, the door in the room was kept shut, the air conditioner in the room was switched off, but the air conditioning vents were not blocked. Except for the research assistant, no one entered or exited the room. When the research assistant entered and exited the room, the measurement data were not included for analysis until the next day.
The indoor plant used was Radermachera hainanensis Merr., which is a type of evergreen, shade-bearing tree with brightly colored leaves and a rapid growth rate (Lin and Li Citation2014). The experiment thus used an increasingly popular plant in Taiwan, though it may not be representative of all kinds of plants. Moreover, it is not known that this specific species is a natural source of any pollutant, such as VOC or HCHO. The plants (height = 1.4–1.5 m; canopy diameter = 0.7–0.77 m) were placed in plastic pots (diameter at top = 0.37 m; height = 0.28 m; diameter at bottom = 0.36 m). The medium used was typical potting compost. We considered the plant, potting compost, and plastic pot as an entire unit, namely the potted plant. Therefore, we did not distinguish between the effects of the plant, the potting compost, and the plastic pot on the air quality, air temperature, and relative humidity, respectively.
2.1. Experimental manipulation
In this study, four manipulations were administered: number of indoor plants, distance from the indoor plants, window status, and time. First, either three or eight pots of Radermachera hainanensis Merr. were placed in the experimental room (). The South Korean Rural Development Administration recommends installing one large potted plant and one small potted plant per 6-m2 floor area in a room to purify the indoor air (Kim et al. Citation2013). The room in which the experiment was conducted had a floor area of 12 m2. Therefore, at least two large potted plants (diameter of 24 or 30 cm) and two small potted plants (diameter of 18 cm) had to be installed. For simplicity’s sake, this study selected three large potted plants. Moreover, eight large potted plants were placed to create a room with numerous plants. The experimental manipulation for plant layout involved placing the potted plants against the wall farthest from the door from the midpoint to both sides of the wall. The tree canopies of all plants were touching. The experiment of eight potted plants was first, as randomly determined by the Excel random number generator, followed by the experiment with three potted plants. The eight-pot manipulation was conducted between April 16 and 26 April 2019, whereas the three-pot manipulation took place from May 28 to 6 June 2019.
Figure 1. Experimental manipulation.
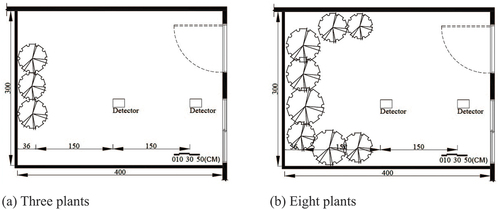
The distance from the indoor plants followed that of a previous study, which remains the only empirical and experimental study comparing the effects of indoor plants at specific distances (1.5 m vs. 3.0 m) (Han and Ruan Citation2020), though the determination of the distance may be arbitrary. Therefore, an air quality detector was placed at 1.5 m and 3.0 m from the bottom of the potted plants, respectively. Because the length of the room was only 4.0 m, the position at 1.5 m from the potted plants corresponded roughly to the center of the room, whereas the position at 3.0 m amounted to the position farthest from the other side of the room. The height of the air quality detector was 1.1 m from the ground, approximately corresponding to the height of the eye of a seated person (Gong Citation2000).
The window manipulation was randomly decided based on the Excel random number generator by separately measuring the indoor air characteristics when the window was opened and when the window was closed. The window glazing was 1.55 m × 0.62 m in dimension. Further, the manipulation for daylight duration was performed by keeping the light on from 6 a.m. to 6 p.m. (12 h), defined as daytime, and the mean illuminance at the top of the plants was about 559.5 lux. Conversely, the period between 6 p.m. and 6 a.m. of the next day was regarded as nighttime, during which the light was turned off. Given that the experimental room was in the basement, the illumination inside the room was minimally affected by the skylight. The major difference of illuminance between day time and night time was the light in the room.
2.2. Experimental instrument
The indoor air quality detectors adopted in this study (iAeris 14, Kaoten Scientific Co., Ltd., Kaohsiung, ROC) measured the changes in eight aspects of the air characteristics, namely air temperature, relative humidity, carbon monoxide (CO), CO2, particulate matter (PM10), fine particulate matter (PM2.5), TVOC, and HCHO levels (see for specifications). The air quality detectors were switched on throughout the experiment and the measurement data were uploaded to the cloud every six minutes. Before the experiment was conducted, the air quality detectors were sent back to the manufacturer for calibration. Therefore, the accuracy, validity, and reliability of the indoor air quality detectors were presumed to be satisfactory.
Table 1. Specifications of the indoor air quality detector (iAeris 14).
2.3. Statistical analysis
This study used IBM SPSS 22.0 Windows (IBM, Armonk, NY, USA) to perform statistical analyses. In the manipulation with eight potted plants, the hourly data of three randomly selected days when the window was opened were extracted, which served as the measurement data. Subsequently, the hourly data of three randomly selected days when the window was closed were extracted and treated as the measurement data. The same data extraction method was applied to the manipulation with three potted plants (window opened and closed). Because the measured data all failed to pass the tests of normality (), they were analyzed through nonparametric statistical tests. Because all manipulations adopted Radermachera hainanensis Merr. to compare the effects of window status, plant – instrument distance, and time of day on air quality, air temperature, and relative humidity, Wilcoxon tests were conducted on dependent samples. However, because different numbers of Radermachera hainanensis Merr. were used when examining the effect of the number of plants on air quality, the Mann – Whitney U test designed for independent samples was performed. When the tested differences of the means such as air quality, air temperature, and relative humidity between the factors in terms of open vs. closed, near vs. far, day vs. night, and less vs. more do not reach significance, it means that the differences in the means have no statistical meaning (Wu Citation2010).
Table 2. Results of the normality test of air characteristics: number of plants.
Table 3. Results of the normality test of air characteristics: window status.
Table 4. Results of the normality test of air characteristics: distance from the plants.
Table 5. Results of the normality test of air characteristics: time of day.
3. Results
3.1. Window opened or closed
Supplementary materials 1 and 2 present the results of opening and closing the window during daytime in the manipulation with three potted plants with plant – instrument distances of 1.5 m and 3.0 m, whereas Supplementary materials 3 and 4 list the results during nighttime. Supplementary materials 5 and 6 exhibit the results measured during daytime in the manipulation with eight potted plants, whereas the results during nighttime are depicted in Supplementary materials 7 and 8. Based on the results gathered in the abovementioned Supplementary materials, summarizes the statistically significant differences resulting from opening or closing the window regardless of the time of day, number of potted plants, and plant – instrument distance, as follows. (1) The air temperature measured when the window was closed was significantly higher than when the window was opened. (2) The relative humidity level measured when the window was opened was significantly higher than when the window was closed. (3) The PM10 concentration detected in the room with the window being opened was 87.5% more likely to be significantly higher than with the window being closed. (4) The TVOC level in the room with the window opened was 75% more likely to be significantly higher than with the window closed. (5) The PM2.5 concentration detected in the room with the window being opened was 75% more likely to be significantly higher than with the window being closed. (6) The CO2 levels detected when the window was closed were significantly higher than when the window was opened. Regardless of the plant – instrument distance, only the CO2 level detected in the room with eight potted plants and with the window closed was significantly higher than with the window opened.
Table 6. Results of significant differences in air characteristics between window open and closed: time of day, number of plants, and the plant – instrument distance.
3.2. Plant-instrument distance
Supplementary materials 9 and 10 show the results of a comparison of daytime manipulation with three potted plants at different distances from the detector with the window being opened and closed, respectively, whereas Supplementary materials 11 and 12 show the results for the identical situation at night. The corresponding results of the eight-pot manipulation during daytime are listed in Supplementary materials 13 and 14, and the nighttime results are listed in Supplementary materials 15 and 16. summarizes aforementioned results based on plant – instrument distance that achieved a statistical significance level, regardless of the time of day, number of potted plants, and window status as follows. (1) The air temperature measured when the plant – instrument distance was set at 3.0 m was significantly higher than at 1.5 m. (2) The relative humidity measured when the plant – instrument distance was set at 1.5 m was significantly higher than at 3.0 m. (3) The concentration levels of PM10 and PM2.5 measured when the plant – instrument distance was set at 1.5 m were significantly higher than at 3.0 m. (4) The TVOC level measured when the plant – instrument distance was set at 3.0 m was significantly higher than at 1.5 m.
Table 7. Results of significant differences in air characteristics between the plant – instrument distance 1.5 m and 3.0 m: time of day, number of plants, and window status.
3.3. Daytime and nighttime
Supplementary materials 17 and 18 compare the values measured during daytime and nighttime in the manipulation with three potted plants at 1.5 m from the detector when the window was opened and closed, respectively, whereas Supplementary materials 19 and 20 present the results when plants were placed at 3.0 m from the detector with the window opened and closed, respectively. The corresponding results of the manipulation with eight potted plants placed at 1.5 m from the detector are listed in Supplementary materials 21 and 22, whereas results for a distance of 3.0 m from the detectors are presented in Supplementary materials 23 and 24. summarizes the statistically significant results according to daytime and nighttime when the window was opened and closed. Regardless of the number of potted plants, plant – instrument distance, and window status, we found that (1) the air temperature during the daytime was significantly higher than at night, and (2) the TVOC level at night was significantly higher than during the day.
Table 8. Results of significant differences in air characteristics between day and night: window status, number of plants, and plant – instrument distances.
3.4. Number of potted plants
Supplementary materials 25 and 26 compare the three-pot manipulation with the eight-pot manipulation during daytime at a distance of 1.5 m from the detector when the window was opened and closed, respectively, whereas Supplementary materials 27 and 28 show the results of plants placed 3.0 m from the detector. Comparison of the results of the two manipulations at a distance of 1.5 m from the detector during nighttime when the window was opened and closed are detailed in Supplementary materials 29 and 30, respectively, whereas the corresponding results for a distance of 3.0 m from the detector are listed in Supplementary materials 31 and 32, respectively. The aforementioned results exhibiting statistically significant differences are presented in . Regardless of time of day, window status, and plant – instrument distance, (1) the air temperature detected with the three-pot manipulation was significantly higher than with the eight-pot manipulation; (2) the relative humidity level in the room with three potted plants significantly exceeded the relative humidity in the room with eight potted plants; (3) the eight-pot manipulation had a significantly higher concentration of PM10 than its three-pot counterpart; and (4) when the window was kept open and the distance was set at 3.0 m, the eight-pot manipulation had a significantly higher concentration of PM2.5 than its three-pot counterpart during the day and at night. During the day and at night, the PM2.5 concentration of the eight-pot manipulation significantly exceeded the PM2.5 concentration of the three-pot manipulation when the window was kept closed and the distance to the detector was set to 1.5 m.
Table 9. Results of significant differences in air characteristics between 3 plants and 8 plants: plant – instrument distances, window status, and time of day.
3.5. Numerical values of the air characteristics
Because large quantities of data were collected and numerous comparisons were conducted, these details are presented in the Supplementary Materials to prevent the article from being too lengthy. provides an overview of the numerical values of the eight aspects of the air characteristics. As can be seen in , the levels of PM2.5, PM10, and relative humidity exhibited large fluctuations, while the levels of CO2, HCHO, CO, TVOC, and air temperature showed only small fluctuations. In addition, the levels of PM2.5, CO2, PM10, HCHO, CO, and TVOC were much lower than the Indoor Air Quality Act Standards in Taiwan. The CO concentration levels were all zero.
Table 10. Numerical values of the air characteristics and the Indoor Air Quality Act Standards.
4. Discussion
4.1. Window opened or closed
Regardless of the time of day, plant number, and plant – instrument distance, this study had the following findings. (1) The air temperature when the window was closed was significantly higher than the air temperature measured with the window opened, suggesting that the ventilation created by window opening was more effective in reducing air temperature than the transpiration from Radermachera hainanensis Merr. (2) Because of the significantly higher relative humidity measured in the room when the window was opened than when the window was closed, the humidity-enhancing effect created by window opening was deemed greater than the humidity-enhancing effect of the presence of Radermachera hainanensis Merr. (3) By contrast, the concentration levels of PM10, PM2.5, and TVOC were significantly higher when the window was opened, demonstrating that placing either three or eight pots of Radermachera hainanensis Merr. was more effective in air purification than opening the window. (4) Window closing was shown to be effective in blocking exterior PM10 and PM2.5. (5) The CO2 level was significantly higher when three potted plants were placed in the room than when the window was simply opened. This indicated that window opening reduced the amount of CO2 produced by the plants. Regardless of the plant – instrument distance, the CO2 level in the eight-pot manipulation with the window being closed was significantly higher than with the window being opened only at night. This was possibly because the volume of CO2 consumed by the eight potted plants during photosynthesis was higher than that emitted by the plants through respiration. However, the volume of CO2 consumed by three potted plants during photosynthesis may be lower than that emitted by the plants through respiration. Future research should conduct experiments on the physiological characteristics of Radermachera hainanensis Merr. to compare the CO2 levels consumed and produced during the day and at night by the plants, respectively. Moreover, whether the photosynthesis of the skylight and the artificial light are the same for Radermachera hainanensis Merr. should be examined.
4.2. Plant-instrument distance
Regardless of the time of day, plant number, and window status, this study found the following. (1) The air temperature and TVOC level with the detector being 3.0 m from the potted plants were significantly higher than when it was 1.5 m from the plants, indicating that placing Radermachera hainanensis Merr. at close range was more effective in reducing air temperature and TVOC levels. These finding were consistent with the previous study (Han Citation2021). (2) The relative humidity and the levels of PM2.5, and PM10 when the detector was placed 1.5 m from the potted plants were significantly higher than at 3.0 m, demonstrating that placing Radermachera hainanensis Merr. at close range helped enhance the relative humidity. However, the purifying effect on PM2.5 and PM10 was weak at close range. These findings were also consistent with the previous study (Han Citation2021). These results indicated that the effectiveness of the transpiration of Radermachera hainanensis Merr. in air temperature reduction and relative humidity enhancement was limited by a maximum distance. When the plants were placed at a position greater than this distance, transpiration lost its effectiveness. Similarly, plant effectiveness in TVOC reduction due to absorption and transpiration may be subject to a maximum distance. By the same token, plants may also be limited by a minimum distance when reducing the concentration levels of PM2.5 and PM10. The specific factors influencing maximum distance limit of TVOC reduction and minimum distance limit of PM2.5 and PM10 reduction merits further investigation.
4.3. Daytime and nighttime
Indeed, the daytime air temperature was significantly higher than the nighttime air temperature regardless of the number of plants, plant-instrument distance, and window status. Irrespective of the number of plants and plant-instrument distance, the TVOC level at night (lower temperature) was significantly higher than during the day (higher temperature) when the window was closed. This result is unexpected and requires further examination because TVOC emission is likely to be higher during days with higher temperatures (Lee and Kim Citation2012).
4.4. Number of potted plants
Irrespective of time of day, window status, and plant – instrument distance, the air temperature in the room with three potted plants was significantly higher than in the room with eight potted plants, suggesting that a greater number of Radermachera hainanensis Merr. created a greater air temperature reduction effect. This finding was consistent with Han (Citation2019). Without considering the time of day, window status, and plant – instrument distance, relative humidity in the room with eight potted plants was also significantly higher than in the room with three potted plants, demonstrating a greater humidity enhancement performance with a greater number of plants. This finding was also consistent with Han (Citation2019). Regardless of the time of day and plant – instrument distance, the CO2 level in the room with eight plants was significantly higher than in the room with three plants, verifying that a greater number of plants produce higher CO2 emissions. This finding was consistent with Han (Citation2019). However, the reason why the CO2 level in the eight-pot manipulation did not exceed the CO2 level in the three-pot manipulation with the window closed requires further investigation. In addition, the PM10 level detected in the eight-pot manipulation was significantly higher than in the three-pot manipulation, irrespective of window status and plant – instrument distance. During the day and at night, the PM2.5 level measured in the room with eight potted plants placed at 3.0 m from the detector significantly exceeded that of the room with three potted plants placed at the same distance. The PM2.5 level at 1.5 m from the detector under the same circumstances was also higher in the eight-pot manipulation than in its three-pot counterpart. These results indicated that a greater number of Radermachera hainanensis Merr. had less favorable performance in dissolving particulate matter than a low number of the same plant. This finding was inconsistent with Han (Citation2019). Nevertheless, since plant performance in particle purification varies depending on leaf size, surface coarseness, stomatal density, and villi length (Li, Wang, and Chen Citation2019), further research is required to determine the leaf micromorphology of Radermachera hainanensis Merr. and its particle purification performance.
4.5. Statistical considerations
Because the collected data for measurement did not pass the normality and homogeneity of variance tests, we conducted nonparametric statistical tests. Therefore, only the differences within each factor were analyzed, namely window opening and window closing, two plant – instrument distances (i.e., 1.5 m and 3.0 m), daytime and nighttime, and two sets of plants (three and eight potted plants). Unlike an analysis of variance, which is a type of parametric statistical test, nonparametric statistical tests do not allow a simultaneous comparison between factors. In this study, a total of 256 pair-wise comparisons were performed on the collected data, for which the significance level was determined according to conservative standards such as the family-wise error rate or the Bonferroni post hoc test (α = 0.05/256 = 0.0002) to reduce type I errors (Wu and Chang Citation2011). After α was adjusted from 0.05 to 0.0002, 126 differences still reached the significance level (p = 0.000), thereby offering strong evidence of the accuracy of the findings in this study.
4.6. Effects of window status and indoor plants
The levels of the pollutants (PM2.5, CO2, PM10, HCHO, CO, and TVOC) in the experimental room were much less than the Indoor Air Quality Act Standards in Taiwan. However, the window status and indoor plants could still significantly affect the pollution levels. In addition, the window status and indoor plants could affect the levels of air temperature and relative humidity. These results demonstrated that the combination of window status and indoor plants was an effective way to regulate the indoor air characteristics for human health and well-being. More importantly, opening or closing windows and indoor plants costs almost no energy. Research on green wall and air quality has expanded recently, showing that there can be more plants if green walls are used. Hopefully, future research can develop a mathematical approach to model the effect of the windows and indoor plants/green walls in the environment.
4.7. Limitations
This study was conducted specifically in a room in a basement not directly adjacent to the outdoor environment to reduce the outdoor influences on indoor air temperature, relative humidity, and air quality. The experimental room may not be representative of all types of indoor environments. In addition, given that the window of the experimental room was connected to the interior corridor, its ventilation effect was presumed to be small. It was also presumed that the variations of the indoor air characteristics surrounding the experimental room in the basement were less than those of outdoors. Further, ventilation provided by opening a window only on one side was deemed less desirable than ventilation provided by opening windows on two sides, three sides, or even four sides. Moreover, natural ventilation is highly dependent on the outdoor climate. Because of the practical difficulties and funding limitations, we did not surround the experimental room with air quality detectors. To overcome the abovementioned shortcomings, future research should further examine the effects of the number of windows opened, the position of windows, ventilation rate, plant species, and number of plants on air quality, air temperature, and relative humidity, while the outdoor or outside air characteristics are monitored and taken into consideration. That will enable detailed comparisons of the residence time of and the deposition rate for air pollutants between the effects of windows and indoor plants. It is also suggested that the experiment should be repeated more than three times, thought this study measured three days for window opened and closed, respectively. If the collected data on the air characteristics such as air temperature, relative humidity, and air quality remain unable to pass the normality and homogeneity of variance tests, it will be difficult for nonparametric statistical tests to include the outside air characteristics as covariates.
5. Conclusion
By comparing the effects of opening a window and placing plants indoors on air quality and microclimate, this study found that the ventilation created through opening a horizontal sliding window outperformed the transpiration effect of Radermachera hainanensis Merr. in both air temperature reduction and relative humidity enhancement both in daytime and night-time, though the natural ventilation of the window may not be strong. However, placing either three or eight pots of Radermachera hainanensis Merr. was more effective in purifying the PM2.5, PM10, and TVOCs than opening a window. In addition, placing the potted plants at a closer position is more effective in air temperature reduction, relative humidity enhancement, and TVOC purification. However, the potted plants placed farther away outperformed closer plants in PM2.5 and PM10 purification. Furthermore, the effectiveness of eight potted plants was greater than that of the three potted plants in reducing air temperature and enhancing relative humidity. However, locations with high relative humidity may not need indoor plants to increase their relative humidity. Occupants can either use window opening, indoor plants, or both to optimally moderating indoor air quality and microclimate for their health and well-being. The preliminary findings provided by the conservative statistical analyses of this pilot study may shed light on the effects of windows and indoor plants on air quality, air temperature, and relative humidity to address this gap in the literature.
Supplemental Material
Download MS Word (97.5 KB)Acknowledgements
The author thanks L.-W. Ruan and Y.-T. Chang for their help with data collection and analyses.
Disclosure statement
No potential conflict of interest was reported by the author.
Data availability statement
Data are available upon reasonable request.
Supplemental data
Supplemental data for this article can be accessed online at https://doi.org/10.1080/13467581.2023.2238027.
Additional information
Funding
References
- American Lung Association. 2001. “When You Can’t Breathe, Nothing Else Matters. Air Quality.” Accessed September 27, 2017. www.lungusa.org/air/.
- Coward, M., D. Ross, S. Coward, S. Cayless, and G. Raw 1996. “Pilot Study to Assess the Impact of Green Plants on NO2 Levels in Homes.” Building Research Establishment Note N154/96. Watford, UK.
- Environment Australia. 2003. “BTEX Personal Exposure Monitoring in Four Australian Cities.” Technical Paper No. 6. Environment Australia: Canberra.
- Frankfort-Nachmias, C., and D. Nachmias. 1996. Research Methods in the Social Sciences. New York, NY: St. Martin's Press.
- Gong, J. 2000. Human Scale and Indoor Space. Taipei, TW: Bo-Yuan Publishing.
- Gordon, B. S., N. G. Bruce, J. Grigg, P. L. Hibberd, O. P. Kurmi, K. B. H. Lam, Mortimer K, Asante KP, Balakrishnan K, Balmes J, Bar-Zeev N. 2014. “Respiratory Risks from Household Air Pollution in Low and Middle Income Countries.” The Lancet Respiratory Medicine 2 (10): 823–860. https://doi.org/10.1016/S2213-2600(14)70168-7.
- Han, K.-T. 1998. Urban Forestry: Theories and Applications. Taipei, Taiwan: Lamper.
- Han, K.-T. 2019. “Effects of Indoor Plants on the Physical Environment with Respect to Distance and Green Coverage Ratio.” Sustainability 11 (13): 3679. https://doi.org/10.3390/su11133679.
- Han, K.-T. 2021. “Effects of Visible Greenness, Quantity, and Distance of Indoor Plants on Human Perceptions and Physical Parameters.” Indoor and Build Environment 30 (9): 1353–1372. https://doi.org/10.1177/1420326X20939595.
- Han, K.-T., and L.-W. Ruan. 2020. “Effects of Indoor Plants on Air Quality: A Systematic Review.” Environmental Science and Pollution Research 27 (14): 16019–16051. https://doi.org/10.1007/s11356-020-08174-9.
- IAQ (Indoor Air Quality). n.d. “Indoor Air Quality (IAQ).” United State Environmental Protection Agency. Accessed April 28, 2023. https://www.epa.gov/indoor-air-quality-iaq.
- Indoor Air Quality. n.d. “Major Sources of Indoor Air Pollutants.” Air Quality and Noise Control Office. Accessed April 28, 2023. https://iaq.epa.gov.tw/indoorair/introduction_mainSource.aspx.
- Irga, P. J., F. R. Torpy, and M. D. Burchett. 2013. “Can Hydroculture Be Used to Enhance the Performance of Indoor Plants for the Removal of Air Pollutants?” Atmospheric Environment 77:267–271. https://doi.org/10.1016/j.atmosenv.2013.04.078.
- Kim, K. J., M. J. Kil, J. S. Song, E. H. Yoo, K. C. Son, and S. J. Kays. 2008. “Efficiency of Volatile Formaldehyde Removal by Indoor Plants: Contribution of Aerial Plant Parts versus the Root-Zone.” Journal of the American Society for Horticultural Science 133 (4): 521–526. https://doi.org/10.21273/JASHS.133.4.521.
- Kim, H. H., J. Y. Lee, H. J. Kim, Y. W. Lee, K. J. Kim, J. H. Park, D. C. Shin, and Y. W. Lim. 2013. “Impact of Foliage Plant Interventions in Classrooms on Actual Air Quality and Subjective Health Complaints.” Journal of the Japanese Society for Horticultural Science 82 (3): 255–262. https://doi.org/10.2503/jjshs1.82.255.
- Kim, H. H., J. Y. Lee, J. Y. Yang, K. J. Kim, Y. J. Lee, D. C. Shin, and Y. W. Lim. 2011. “Evaluation of Indoor Air Quality and Health Related Parameters in Office Buildings with or without Indoor Plants.” Journal of the Japanese Society for Horticultural Science 80 (1): 96–102. https://doi.org/10.2503/jjshs1.80.96.
- Kuo, P.-W. 2009. “A Research on the Carbon Dioxide Distribution in the Indoor Environment and Uses Plants to Improve the Indoor Air Quality.” Journal of Ecology and Environmental Sciences 2 (1): 53–64.
- Lee, Y. K., and H. J. Kim. 2012. “The Effect of Temperature on VOCs and Carbonyl Compounds Emission from Wooden Flooring by Thermal Extractor Test Method.” Building and Environment 53:95–99. https://doi.org/10.1016/j.buildenv.2011.10.016.
- Lin, F. X., and Z. T. Li. 2014. “Breeding, Cultivation and Application of Hainan Bean Tree in Landscape.” Anhui Agricultural Science Bulletin 20:109–110.
- Li, Y., S. Wang, and Q. Chen. 2019. “Potential of Thirteen Urban Greening Plants to Capture Particulate Matter on Leaf Surfaces Across Three Levels of Ambient Atmospheric Pollution.” International Journal of Environmental Research and Public Health 16 (3): 402. https://doi.org/10.3390/ijerph16030402.
- Orwell, R. L., R. A. Wood, J. Tarran, F. Torpy, and M. D. Burchett. 2004. “Removal of Benzene by the Indoorplant/Substrate Microcosm and Implications for Air Quality.” Water, Air, and Soil Pollution 157 (1–4): 193–207. https://doi.org/10.1023/B:WATE.0000038896.55713.5b.
- Ritchie, H., and M. Roser 2013. “Indoor Air Pollution.” Published Online at Our World in Data.Org. https://ourworldindata.org/indoor-air-pollution.
- Wolverton, B. C., A. Johnson, and K. Bounds. 1989. Interior Landscape Plants for Indoor Air Pollution Abatement. Davidsonville, MD, USA: National Aeronautics and Space Administration.
- Wood, R. A., M. D. Burchett, R. Alquezar, R. L. Orwell, J. Tarran, and F. Torpy. 2006. “The Potted-Plant Microcosm Substantially Reduces Indoor Air VOC Pollution. I. Office Field-Study.” Water, Air, and Soil Pollution 175 (1–4): 163–180. https://doi.org/10.1007/s11270-006-9124-z.
- Wu, M.-L. 2010. SPSS Operation and Application—Practice & Analysis of Variance. Taipei, Taiwan: Wunan Press.
- Wu, M.-L., and Y.-R. Chang. 2011. SPSS and Statistical Analysis Application. Taipei, Taiwan: Wunan Press.
- Yoo, M. H., Y. J. Kwon, K. C. Son, and S. J. Kays. 2006. “Efficacy of Indoor Plants for the Removal of Single and Mixed Volatile Organic Pollutants and the Physiological Effects of the Volatiles on the Plants.” Journal of the American Society for Horticultural Science 131 (4): 452–458. https://doi.org/10.21273/JASHS.131.4.452.
- Zhang, J., and K. R. Smith. 2003. “Indoor Air Pollution: A Global Health Concern.” British Medical Bulletin 68 (1): 209–225. https://doi.org/10.1093/bmb/ldg029.