
ABSTRACT
The waterfront trail is a crucial outdoor activity area for urban residents, but the increasing high temperature in summer has negatively affected the quality of outdoor activities. To address this issue, this article examines the relationship between the spatial form of the waterfront trails and thermal comfort, using the West Lake Hangzhou trails as an example. Seven waterfront trail spaces were selected for the study, and six spatial structure parameters and three climatic parameters were measured on three representative summer days. The Rayman model was then used to calculate the Physiological Equivalent Temperature (PET) value of each sample plot based on five climate parameters, human body parameters, and Sky View Factor (SVF). The results indicate that the primary spatial form factors affecting the microclimate and thermal comfort of the waterfront trails in summer are the average tree height, the average tree spacing, and the ratio of shadow-generating side tree height to the trail width. The average tree height significantly impacts thermal comfort, followed by the tree spacing and the shadow-generating side tree height ratio to the trail width. These parameters primarily affect the thermal comfort of the waterfront trails through air temperature and wind speed. The study’s findings can guide the design of waterfront trail spaces and help create waterfront trails that combine climate comfort and landscape.
1. Introduction
With the continuous advancement of Hangzhou’s urbanization, urban construction warms the city’s surface and air. It changes the local wind direction and speed, negatively impacting residents’ indoor and outdoor environments and quality of life (Wu and Chen Citation2016). For example, high temperatures in summer caused by UHI (Urban Heat Island) will increase the incidence of heart disease and high fever (Mei and Xu Citation2022; Tan et al. Citation2006). According to the time and weather data website timeanddate, the average summer temperature in Hangzhou has risen from 29°C in 2002 to 32°C in 2021. Waterfront trail planning and design is an important part of urban waterfront planning and design (Liu et al. Citation2021; Mei, Xu, and Li Citation2023). Creating waterfront trails with suitable microclimate and thermal comfort conditions is imminent in this difficult situation.
Thermal comfort is defined as the degree of psychological satisfaction of the human body in a thermal environment. Assessment of thermal comfort today is based on a more objective review of physiological comfort (Fanger Citation1972). The human body cannot accurately perceive climatic parameters, so physiological thermal comfort assessment often involves the conversion of climatic parameters into thermal indices and a combination of other human and environmental factors. At present, a large number of studies have been carried out on the microclimate and thermal comfort of the trail space. For example, Zhao Xiaolong, Zhou Ye, and others conducted a correlation analysis on the microclimate factors and the measured landscape form of the typical roads of the Harbin Zhaolin Park Fitness Trail in spring. They selected parameters such as slope aspect, shrub height-to-width ratio, water body orientation, and pavement properties. It is concluded that vegetation, mountains, and water bodies are the leading landscape elements affecting the microclimate of the park’s fitness trails, and the specific impact mechanism of landscape elements on the microclimate needs to be further explored (Zhao et al. Citation2018). Taking Fudao in Fuzhou as an example, Gao Yangchi, Yu Kunyong, and others divided the three types of spaces, including linear plank road, viewing platform, and rest platform, into five spaces combined with the orientation of trees and conducted microclimate measurements, and finally concluded that the Fudao in autumn has a space type and use time with better thermal comfort, and the impact mechanism of the internal components of the trail space on the microclimate needs to be further explored (Gao et al. Citation2021). Xi Tianyu and others selected two types of tree-shaded trails and sunny trails and analyzed the difference in thermal comfort between the two trails in summer. The study focused on the single element of shade in residential areas and concluded that the thermal comfort of tree-shaded trails is better than that of sunny trails. The conclusions provide an idea for an in-depth exploration of the types of trail landscape elements (Xi et al. Citation2021). Alawadhi et al. explored the effects of path direction and tree shading on the thermal comfort of jogging trails. They concluded that there is a proper path direction for thermal comfort in the local area, which showed that, except for spring, tree shading impacts the thermal comfort of the trail in other seasons. In this study, the planar shape of the path direction was introduced, and more reliable trail shapes can be added as research objects in follow-up research (Alawadhi Citation2022). Lin, Zeng, et al. divided the trails of the Baishui River National Nature Reserve in Sichuan Province into three types of trail spaces and the thermal comfort of the corresponding spaces according to different vertical structures. The research focused on the vertical composition types of vegetation in the nature reserve (Lin et al. Citation2022).
From the current research results, it can be found that at the site level, the research on the microclimate of the trail space is mainly carried out in residential areas, parks, and nature reserves, and there is a gap in the study on the waterfront trail space. Moreover, the relationship between space type and thermal comfort is mainly analyzed. Therefore, the relationship between internal elements of space type and thermal comfort needs to be explored urgently. In the common trail space, buildings, trees, and asphalt ground are relatively common landscape elements. At the same time, the waterfront trails are quite different from common trails in that it is more composed of water bodies, trees, and hard ground. Therefore, this study will focus on the impact of the spatial form of the leading landscape elements in the trail space on thermal comfort.
Some scholars pointed out that the spatial form determines the overall effect of the outdoor space environment and plays a vital role in regulating various thermal environment parameters and the overall thermal environment level (Davtalab et al. Citation2020; Sanaieian et al. Citation2014). Based on the current research results of spatial form in the field of microclimate and thermal comfort, this article puts forward two questions that need to be answered according to the research objectives:
1. How to determine the quantitative method for the spatial form of waterfront trails and the spatial form factors?
2. What are the key spatial form factors that affect the microclimate and thermal comfort of the waterfront trails?
3. How do these spatial form factors affect the thermal comfort of the waterfront trail space?
2. Research Methods
2.1. Research plan
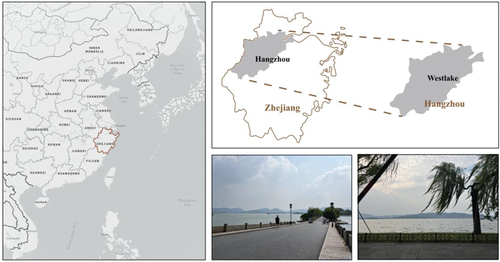
The research site is in the West Lake Scenic Area of Hangzhou City, Zhejiang Province, China (). Hangzhou, as the capital city of Zhejiang Province, is situated within the geographical coordinates of 29° 11' to 30° 34' north latitude and 118° 20' to 120° 37' east longitude. The city boasts an average altitude of 19 meters above sea level and sustains a substantial population of approximately 12.204 million residents. The region has a humid subtropical climate characterized by cold winters and hot summers, with temperatures ranging from 15 to 23°C most of the time. The average temperature of the coldest month is 5.0°C, and the average temperature of the hottest month is 30.0°C. The annual average relative humidity is 74%. The rainy season starts in June and ends in July. The average annual rainfall is about 859.2 mm. The prevailing wind direction in the area is northeasterly (NE). The maximum wind speed during the study period was 3.14 m/s, and the average wind speed was 1.3 m/s. The experiment was conducted on a sunny day without rainfall or abnormal weather conditions.
Figure 1. Geographical location and landscape of West Lake in Hangzhou.
The research was carried out for the high temperature in summer; seven points along the West Lake were selected in the experimental research area. shows the location of the measuring points, and contains a description of the landscape elements of each study site. The selected seven points for this study are highly representative, exhibiting unique characteristics. Firstly, they embody the typical spatial features of Hangzhou waterfront trails, predominantly comprising trees, hard surfaces, and grass. Secondly, these points are in close proximity to the renowned “Ten Scenes of West Lake” scenic area, boasting exceptional landscape quality that attracts numerous visitors, especially during the summer. However, the high daytime temperatures result in fewer visitors compared to nighttime, which is unfortunate. Lastly, the landscape composition at each study site demonstrates notable similarities, with minimal presence of street furniture within the overall landscape elements.
Figure 2. Location of measuring points.
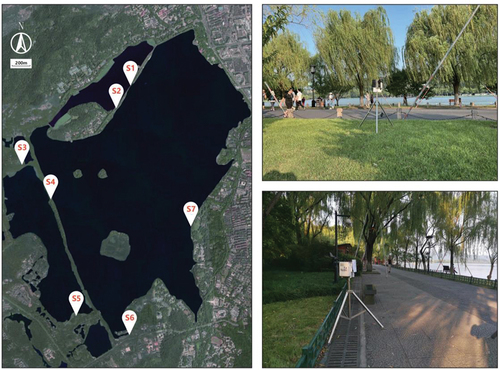
Table 1. Parameters appearing in the paper.
Table 2. Overview of landscape elements at the study site.
Table 3. Parameters of weather stations.
The test period was set from July 28th to July 31st, conducted during daytime hours. The research timing was carefully determined and justified.
This study examines the impact of waterfront trails’ spatial form factors on the thermal comfort of waterfront trails under high-temperature weather events. To support our research, we analyzed maximum summer temperatures between 2012 and 2021 using the timeanddate meteorological website. We found that the highest temperatures occurred between July 24th and July 31st in six of those years. Based on favorable weather conditions without rainfall or cloud cover, we selected the measurement period of July 28th to July 31st for our study.
The study focuses on daytime analysis due to several reasons. Firstly, West Lake is a popular scenic spot in China that attracts numerous tourists even during high-temperature periods, with daytime being the most challenging in terms of thermal comfort. Therefore, we aim to understand better the impact of waterfront trail form factors on thermal comfort under high-temperature conditions and guide design improvements. Secondly, we observed a significantly higher number of tourists at West Lake during nighttime, suggesting potentially better thermal comfort compared to daytime. By concentrating our research on daytime measurements, we can draw more targeted conclusions. Through field investigation and discussion, we determined the daily measurement time as 06:30 to 19:00. Our field survey captured the temporal variation in visitor numbers, starting with groups gathering around the West Lake area as early as 6:30 am and steadily increasing throughout the day. We also took into account the timing of sunrise and sunset in Hangzhou during late July (around 5:15 and 19:05, respectively). This allowed us to align the measurement period with crowd activity and the natural daylight cycle, ensuring comprehensive coverage of visitor patterns and considering ambient lighting conditions.
These considerations enable a robust analysis of the impact of waterfront trail form factors on thermal comfort during the selected measurement period.
2.2. Determination of meteorological parameters and calculation of Physiological Equivalent Temperature (PET)
The meteorological data in this study was collected using the WatchDog 2700 portable weather station (the measurement range and accuracy of each parameter are shown in ). All measurements were carried out at the center of each research site, and the measurement height of each parameter was 1.3 m. The weather station records data every 15 minutes. The measured climate parameters include “air temperature, Ta (°C), “relative humidity, RH (%), and “wind speed, v (m/s).
Thermal comfort evaluation is usually carried out by calculating the thermal index. The commonly used thermal comfort evaluation indexes in current research include PMV (Predicted Mean Vote), PET (Physiological Equivalent Temperature), SET* (Standard Effective Temperature), and UTCI (Universal Thermal Climate Index). PMV and SET* are primarily used in indoor thermal comfort research. Some scholars once believed that the indoor thermal comfort evaluation index could be applied outdoors. However, this point of view was later proved to be erroneous (Spagnolo and De Dear Citation2003) because the thermal environment outdoors is more complex than indoors.
UTCI and PET are currently two widely used thermal comfort evaluation indicators with high accuracy.in the comparison of outdoor applicability between UTCI and PET, some studies pointed out that PET may be a more suitable indicator for outdoor thermal comfort assessment. There are many studies that believe that the UTCI scale varies greatly in different climate zones, which contradicts the statement that UTCI is generally applicable to a variety of climates. For example, Jin Hong et al. investigated the thermal comfort of two urban pedestrian streets in Harbin and found that the original UTCI threshold was not suitable for Harbin (Jin, Liu, and Kang Citation2019). Nie et al. (Citation2022) found through experiments and data analysis that the probability of correct interpretation of outdoor thermal comfort in cold regions by UTCI and PET was 74.2% and 75.1%, respectively, and PET won by a slight advantage.
In summary, the thermal index selected in this study is PET (physiological equivalent temperature), which is an outdoor thermal environment comfort evaluation index proposed by Höppe (Citation1999) based on the MEMI model (Munich Energy Model for Individuals) (Höppe Citation1999). It can be specially used for outdoor thermal environment comfort evaluation. It is defined as the air temperature at which the human skin temperature and body temperature reach a thermal state equivalent to that of a typical indoor environment under certain environmental conditions (Wu and Chen Citation2016). The PET index was first applied to thermal perception and sensation in 2003 (Potchter et al. Citation2018), and since 2012, PET has dominated research in related fields (Brown Citation2011; Ribeiro et al. Citation2022). The PET thermal comfort index is widely used to determine the outdoor thermal comfort conditions in different climate zones, among which Liu et al. used PET to evaluate the subtropical climate (Liu, Zhang, and Deng Citation2016), Erick et al. used PET to explore human comfort in the warm and humid city of Guayaquil, Ecuador (Erik et al. Citation2017).
After the data sorting is completed, the data is imported into the Rayman model for PET calculation. Combining the views of previous literature, v and Ta are extremely important in affecting PET (Charalampopoulos et al. Citation2013), and RH ranks second (Chen and Matzarakis Citation2014). Therefore, this study provides three climate parameters: air temperature, Ta (°C), relative humidity, RH (%), and wind speed, v (m/s). Body parameters were set at conventional levels, including sex, age, height, weight, clothing, activity (metabolic heat), and status (male, 35 years old, 1.75 m, 75 kg, 0.5clo, 80 W, and standing). At the same time, the pre-measured SVF was imported into the Rayman model for calculation. The entire experimental process and result analysis process are shown in . shows the hourly average PET values of each sample point during the study period. shows the measured data of microclimate factors at each point and the daily average PET values. We refer to the study by Chen et al. They found that the neutral PET temperature in winter in Shanghai ranged from 15 -29°C (Chen et al. Citation2015). Shanghai and Hangzhou are in the same climate zone and are very close to each other. Therefore, we also assessed the thermal comfort of the study site according to the neutral PET range.
Figure 3. Data measurement and integration process.

Table 4. Hourly average PET values at various points.
Table 5. Meteorological parameters and corresponding PET values measured at each measuring point.
2.3. Determination and calculation of various spatial form parameters
In this study, six parameters were selected for measurement and analysis based on the review of related literature on microclimate effects and spatial form quantification, combined with the unique characteristics of waterfront trails. In urban open spaces, the top and bottom of green spaces are critical factors affecting the microclimate (Zhou, Wang, and Cadenasso Citation2017). This article will introduce the top, facade, and bottom referenced in the previous text and conduct a quantitative analysis of the spatial form factors of the proposed spaces from the perspective of three surfaces. The parameter names and their abbreviations appearing in this study are shown in , and the classification, unit, meaning, calculation method, and references of the parameters are shown in .
Table 6. Research on quantitative parameters of waterfront landscape trails.
The parameter selected for top surface quantification is PSVF (Park Sky View Factor), which describes the openness of the sky at a specific point in the park environment. PSVF combines TVF (Tree View Factor) for calculation and is an application of SVF (Sky View Factor) in the park environment. SVF refers to the ratio of the sky that can be seen at a specific location (Johansson and Emmanuel Citation2006). Its value ranges from 0 to 1. The larger the value, the greater the openness of the sky. It is an important indicator for studying urban microclimate and thermal comfort and can be calculated by taking fisheye photos at a certain point. It is widely used in studies on microclimate effects and thermal comfort in street canyon environments. Oke et al. found that SVF is negatively correlated with heat island intensity in the largest cities and positively correlated with diurnal temperature fluctuations. SVF indicates the ability of short-wave heating during the day and long-wave cooling at night at the surface plane (Oke Citation2010). TVF is similar to SVF, which means the area ratio of trees in the fisheye photo. Since in the park environment, the main occlusion of the sky landscape comes from the canopy, Zhang et al. further proposed PSVF to evaluate the openness of the park environment on this basis and found that a low PSVF can form a more active thermal environment(Zhang et al., Citation2019). In addition, PSVF is only suitable for the case where there are only sky and trees in the fisheye view. The calculation formula is PSVF = 1-TVF. The sample points selected in this study are all in line with its application range. Therefore, PSVF is selected as the factor to quantify the spatial top surface in this study.
The parameters selected for facade quantification are the height of trees, the height-to-width ratio of trees and trails, and the distance between trees. The height/width ratio is commonly used in the microclimate research of the street canyon environment. The street canyon height-to-width ratio directly affects the angle coefficient between various interfaces in the street canyon (Zhao and Liu Citation2007). It affects the street canyon’s thermal environment by affecting the solar radiation area in the street canyon and ultimately affects the comfort of the street valley. Yahia et al. concluded that in street design, aspect ratio, street orientation, and tree layout have a significant impact on ground temperature and thermal comfort (Yahia, and Johansson Citation2012). In the space enclosed by plants, the height-to-width ratio still has an impact on the microclimate and thermal comfort of the site (Cui et al. Citation2023; Karimimoshaver and Shahrak Citation2022). Thus, in this study, the ratio of vegetation height to road width was selected as the facade quantification factor of the trail space (Zhao et al. Citation2018). In addition, in a warm and humid climate, the correct choice of tree layout is critical, which is conducive to creating a more positive wind environment to ensure the thermal comfort of pedestrians (Yahia et al. Citation2017). Therefore, this study considered the form variables related to tree planting layout. Tree spacing refers to the distance between two adjacent trees at 1.3 m. Some studies have found that the distance between trees is positively correlated with the PET of a pure forest environment. A larger distance between trees can make it easier for pure forest space to acquire heat (Lin et al. Citation2021), which may be because a larger distance represents a smaller shading density, affecting the solar radiation and wind environment in the site. This study selects the tree spacing ADw on the windward side and the overall tree spacing ADt as facade quantification factors to analyze further the relationship between tree spacing and microclimate and thermal comfort. Tree height refers to the distance from the bottom of the trunk to the top of the canopy, which is widely used in the study of microclimate and thermal comfort in urban green spaces (Kong et al. Citation2017; Vidrih and Medved Citation2013; Zhang, Zhan, and Lan Citation2018). This study also considers the special shape of the trail space and selects the overall tree height Ht as the shape factor of the facade for analysis.
The parameter selected for bottom surface quantification is the permeable surface coverage rate. Permeable surface coverage refers to the ratio of permeable surface to the total area of the site. Permeable surfaces can reduce surface temperature through evaporation, while impermeable surfaces are one of the leading causes of urban heat islands (Chen et al. Citation2021; Cheung and Jim Citation2018). Tang Fei et al. found that there was a significant exponential correlation between urban impermeable surface area and surface temperature, and the increase of surface water permeability could significantly improve the microclimate effect (Fei and Xu Citation2013). further illustrates the meaning of these parameters in this study. Data measurement was carried out using ranging tools such as infrared range finders and tape measures. Subsequently, specific parameter values for each sample point were obtained through model and calculation software. The numerical results are shown in .
Figure 4. Schematic diagram of quantification of landscape elements.
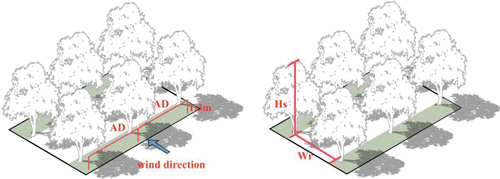
Table 7. Measurement results of the spatial form of each measurement point.
3. Results and analysis
3.1. Calculation results of meteorological factors and thermal comfort
The air temperature values at each measuring point in the three test days in summer range from 26.58°C to 37.21°C, as shown in . The average daily variation trend of the air temperature at each measuring point is generally consistent, starting at 6:30 in the morning, gradually increasing over time, reaching the maximum value at 13:30–15:30, and then gradually falling back. However, the peak temperature of each measuring point is not apparent, and the increase and decrease are relatively small. Among them, the maximum value of the maximum temperature occurs during 14:30 ~ 15:30 of the control point S1, and the value is 37.21°C. According to the preliminary judgment, this result was caused by the fact that the control point did not have any shade conditions, so the air temperature at this point was relatively high, and the PET value of this point was also in a higher position among all the points. The minimum value of the highest air temperature occurred during 13:30 ~ 14:30 at measuring point 4, with a value of 35.53°C, which may be because point S4 has the highest tree facade enclosure height among the seven points and a smaller PSVF, which ensures that the S4 has a considerable shaded area. The air temperature reaches the peak inflection point at around 14:30, and the air temperature distribution of each measuring point at 14:30 is as follows:
Figure 5. Analysis chart of Ta(air temperature) average at each measuring point.
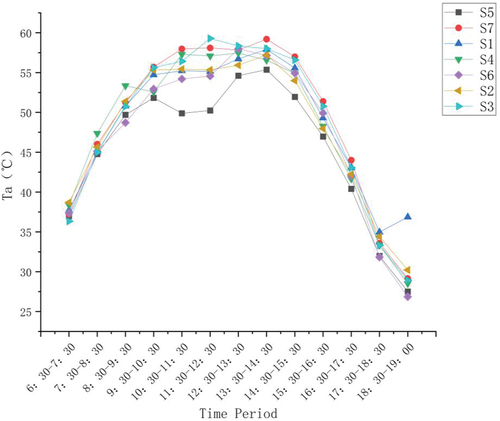
S1(37.21°C) > S7(36.81°C) > S3(36.60°C) > S6(36.24°C) > S2(36.20°C) > S5(35.70°C) > S4(35.53°C).
The relative humidity of each measuring point in the three test days in summer ranges from 44.45% to 80.45%, as shown in . The average daily variation trend of the air humidity at each measuring point is generally consistent, starting at 6:30 in the morning, gradually decreasing over time, reaching the minimum value between 11:30 and 15:30, and then gradually increasing. Among them, the maximum value of the average humidity appeared in S4, with a value of 66.18%. It is preliminarily inferred that this is due to the prominent vegetation environment in S4, and the large amount of water vapor produced by transpiration led to this result; The minimum value of the average humidity occurred at S6, with a value of 58.27%. This may be due to the fact that the site is located in the south of the West Lake, and the north side is near the water, so it is less receptive to the wind carrying a lot of water vapor in the West Lake. In addition, the relative humidity reached the minimum inflection point around 15:30, and the relative humidity of the measuring points at 15:30 was arranged as follows:
Figure 6. Analysis chart of RH(relative humidity) mean value at each measuring point.
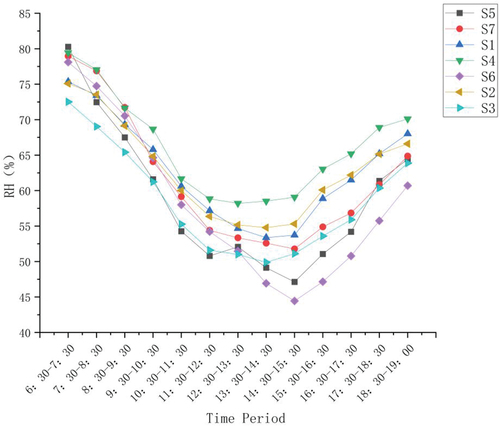
S4(59.07%) > S2(55.31%) > S1(53.73%) > S7(51.78%) > S3(51.12%) > S5(47.13%) > S6(44.45%).
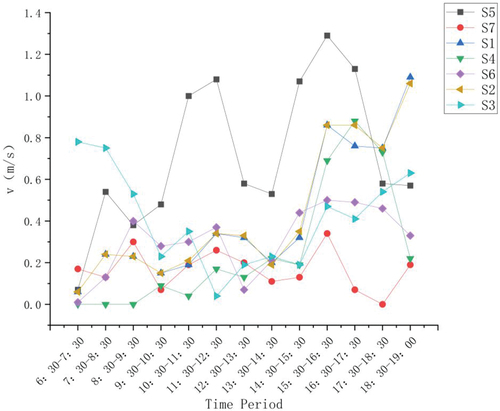
As shown in , the wind speed measurement results show that there are obvious differences in the wind environment at each measuring point, and there is no relatively uniform trend of change. This is due to the fact that wind speed is the most variable and most complex factor in the microclimate environment, and it has the characteristics of being changeable, difficult to capture, and unpredictable. The range of air wind speed at each measuring point in the three test days in summer is 0–1.29 m/s, and there are significant differences in the daily variation trend of the average wind speed at each measuring point. Among them, the wind speed of control point S1 is less than point 5 and greater than points 2, 3, 4, 6, 3, and 7. It may be due to the absence of any enclosed spatial form so that the wind will not attenuate due to obstacles here. Overall, the strong sense of wind is at point 5, and the weaker sense of wind is at point 7. The wind environment is a complex and unpredictable meteorological factor in the urban environment, and further analysis is needed to study the relationship between it and the spatial form of the waterfront trails.
Figure 7. Analysis of the mean value of v(wind speed) at each measuring point.
3.2. Relationship between spatial form factor and microclimate
In order to verify the possible relationship between microclimate factors and spatial form factors, this section first conducts Spearman correlation analysis on spatial form factors and meteorological factors and initially explores the correlation of various factors and tests the correlation coefficients. The analysis software used in this study is IBM SPSS Statistics26. Spearman correlation analysis was employed to assess the nonparametric association between variables. It is a rank-based statistical test that measures the strength and direction of the monotonic relationship between two variables.
The Spearman correlation analysis results of various meteorological parameters and spatial form factors () show that after preliminary analysis, it can be concluded that the correlation between PSVF, Hs/Wr, and PSR, and Ta is significant, and PSVF and Ta were positively correlated. Hs/Wr and PSR were negatively correlated with Ta, which indicated that PSVF, Hs/Wr, and PSR had a good regulating effect on air temperature. Ht, Hs, ADt, and ADw had no significant correlation with Ta. In addition, PSVF, Ht, ADt, and ADw were positively correlated with relative humidity, while Hs/Wr was negatively correlated with relative humidity, and Hs and PSR were not significantly correlated with relative humidity, indicating that PSVF, ADt, ADw, and Hs/Wr could regulate humidity well. Finally, the results show that all parameters are significantly correlated with wind speed, in which PSVF is positively correlated with wind speed, and other parameters are negatively correlated.
Table 8. Correlation analysis of spatial form factors and meteorological factors.
Spearman correlation analysis initially provides insights into the correlation between variables. However, it has a limitation in that it does not account for collinearity or mutual influence among variables. In order to further investigate the predictive capabilities of the variables, we employed stepwise regression analysis. Stepwise regression is a statistical technique that systematically selects the most significant predictors to construct a regression model. This iterative process aids in identifying the variables that exert the greatest impact on the observed variation in the dependent variable. For the stepwise regression analysis, we employed the backward method to assess the meteorological factors and spatial form factors of the seven spaces. This approach allowed us to determine the parameters that had the most significant impact on the meteorological factors while minimizing the presence of multicollinearity. By examining the standardized coefficients within the model, we were able to determine the relative importance of the parameters influencing the thermal comfort of the waterfront trails in each season. The thermal comfort of the waterfront trails in each season was determined.
Meteorological factors select the meteorological data from 11:00 - 14:00 on the measurement day to further reduce the interference of time changes on the data. The standardized coefficient is often used to describe the relative importance of independent variables. The greater the absolute value of the standardized coefficient Beta, the greater the influence of spatial form factors on meteorological factors. The stepwise regression results of meteorological and spatial form factors are shown in , and the relationship model is shown in . According to the standardized coefficient of the model, combined with the significance level of each variable, the importance of independent variables can be arranged in the following order high to low: Ta: Ht, ADw, PSVF, ADt; v: Ht, Hs/Wr, AD; RH: PSVF, ADw, PSR.
Table 9. Stepwise regression analysis of meteorological factors and spatial form factors s.
Table 10. Correlation analysis between spatial form factors and PET.
Table 11. Stepwise regression analysis of spatial form factors and PET.
Table 12. Relationship model between spatial form factors, meteorological factors, and PET.
3.3. Relationship between spatial form factor and PET
The Spearman correlation coefficient shows () that Ht, Hs, PSR, and ADw are significantly correlated with PET. Among them, Ht and Hs are positively correlated with PET, and PSR and ADw are negatively correlated with PET. Preliminary analysis shows that Ht, Hs, PSR, and ADw had an excellent regulatory effect on PET. However, the relationship between spatial form factors and PET still needs to be further studied by stepwise regression (backward).
shows the stepwise regression results of spatial form factors and PET, and for the relationship model. Similarly, we can observe the standardized coefficient and significance level. The order of importance of spatial form parameters in this model is Ht, ADt, Hs/Wr.
4. Discussion
The difference in the spatial form of waterfront space will cause the difference in local climate parameters and then affect the PET value. This article first selects the spatial form factors from the top surface form, facade form, and bottom surface form of the space and then discusses the influence of space form on microclimate and thermal comfort. For the research purpose of this study, it is primary to analyze the relationship between thermal comfort and spatial form factors. The regression analysis between meteorological and spatial form factors can be used to explain which meteorological factors are affected by the spatial form factors highly correlated with PET and thus affect thermal comfort.
From the point of view of the regression coefficient’s importance, in the summer waterfront trail space, the facade form factor significantly regulates thermal comfort and microclimate conditions. The analysis results show that the critical spatial form factors affecting thermal comfort are Ht, Hs/Wr, and ADt. Ht is the form factor that has the most significant impact on PET and is positively correlated with PET. In other words, lower Ht can create more positive thermal comfort conditions. Referring to the influence of Ht on meteorological factors, it can be found that Ht is positively correlated with Ta and negatively correlated with v. v, and Ta is critical in influencing PET. Lower Ht can reduce the temperature of the site and significantly improve the wind environment of the waterfront trails in summer, thus improving the thermal comfort of the site. Morakinyoa et al. found that increasing the trunk height from 2 m to 4 m will reduce the wind speed at the site by about 5% (Morakinyo and Lam Citation2016). This study supports the conclusion that the increase in tree height will reduce the wind speed at the site.
Secondly, ADt also has a significant impact on PET, which is negatively correlated with PET. A higher ADt can significantly improve the thermal comfort of the site. Also, combined with the analysis of the relationship between ADt and meteorological factors, it is found that ADt is positively correlated with Ta and v, which means that the larger the ADt, the higher the temperature of the site and the greater the wind speed. Lin et al. found that the larger spacing between trees can make the pure forest space easier to obtain heat (Lin et al. Citation2021). The findings of this study support this notion. Unlike the findings of Lin et al., ADt was negatively correlated with PET, which may be due to the fact that tree planting in the waterfront trail space is different from the pure forest environment. The tree planting density of the waterfront trail space is much lower than that of the pure forest space. Lower density planting allows greater ADt to reduce facade shading and increase wind speed in the site, thereby reducing PET. Remarkably, the facade form factor ADw examined in this study exhibited no substantial impact on the wind speed at the site, which appears to be at odds with the efficacy of ADt in wind speed regulation. We think this is because the orientation of each space is not completely consistent. We assume that the direction of the wind at each point of the West Lake is the same, and the different orientations of the trail space will cause deviations between the windward side of the trail space in the actual environment and the ideal state. The orientation of linear space has been widely discussed in the field of thermal comfort, especially in the street canyon environment, which is considered to have a significant ability to adjust wind speed and thermal comfort (Ali-Toudert and Mayer Citation2006; Narimani, Karimi, and Brown Citation2022). We believe that orientation also has an impact on the waterfront trail space and the specific impact mechanism. Further studies are needed to further explore.
Finally, Hs/Wr was negatively correlated with PET, which means that the larger the Hs/Wr, the better the thermal comfort of the waterfront trails. In short, the larger the Hs and the smaller the Wr, the smaller the PET. Combined with the regression analysis results of Hs/Wr and meteorological factors, it can be found that Hs/Wr is negatively correlated with Ta and positively correlated with v. In other words, high Hs/Wr is accompanied by lower air temperature and a more positive summer monsoon environment, and Hs/Wr affects PET in a similar manner to Ht. Emmanuel et al. conducted a study in a street canyon environment and observed that increasing the height-to-width ratio (H/W) for enhanced shading reduced the physiological equivalent temperature (PET) and thus improved outdoor thermal comfort. However, a higher H/W had a negative impact on wind flow at the street level (Emmanuel, Rosenlund, and Johansson Citation2010). Similarly, in our study, we also found that a higher height-to-width ratio (Hs/Wr) contributes to improved thermal comfort in the trail space, which we believe is due to its enhanced shading properties. However, regarding its effect on the wind environment, our study yielded the opposite conclusion. It has been suggested that the decrease in wind speed is attributed to the accumulation of drag forces caused by the plant canopy (Fahmy, Sharples, and Yahiya Citation2010). A lower plant canopy exacerbates this effect, resulting in more severe pedestrian-level wind speed at the site. Based on the research results of this article, and further thinking, one possible explanation is that a higher Hs/Wr implies a larger height-to-tree (Ht) ratio and taller canopies, which help maintain higher pedestrian-level wind speed within the site. This inference echoes that of Narimani et al., who found that high trunks and wide, overlapping crowns were the most suitable form of greenery for reducing daytime PET levels in street canyon environments (Narimani, Karimi, and Brown Citation2022).
In addition, the study found that the form factors with a solid ability to regulate PET are all significantly correlated with Ta and v but not with RH. This result supports the research results of Matzarakis et al (Charalampopoulos et al. Citation2013; Chen and Matzarakis Citation2014; Fröhlich and Matzarakis Citation2016; Herrmann and Matzarakis Citation2012; Zhao et al. Citation2017). That is, Ta and v have a more robust ability to regulate PET than RH.
5. Conclusion
This study explored the relationship between spatial form, microclimate, and thermal comfort and measured microclimate parameters and spatial form parameters on representative days in summer. It calculated the comprehensive thermal index PET by using the Rayman model. This study divides the space into the top, facade, and bottom. Combining the typical characteristics of the waterfront trail to quantify the three sides of the space and then importing the spatial shape parameters, microclimate parameters, and thermal comfort parameters into SPSS for analysis. Stepwise regression found that the facade form is the main spatial form that affects PET and determines the main spatial form factors that affect the microclimate and thermal comfort of the waterfront trails in summer. The influence of these parameters is arranged in descending order: The average height of trees, the average distance between overall trees, and the ratio of shadow-generating side tree height to the trail width. Ht was positively correlated with PET, while ADt, and Hs/Wr were negatively correlated with PET. These parameters mainly affect the thermal comfort of the waterfront trail space by affecting Ta, and v. Ht was positively correlated with Ta and negatively correlated with v; ADt was positively correlated with both Ta and v; Hs/Wr was negatively correlated with Ta and positively correlated with v. We can artificially adjust the spatial form, microclimate and thermal comfort of the waterfront trail space by using form parameters such as the overall average height of trees, the average overall tree spacing, and the ratio of shadow-generating side tree height to trails width. Combined with the research conclusions of this study, it can be found that in order to achieve a more suitable thermal comfort condition in summer, the width of the waterfront trails should not be too broad, and tall trees can be planted on both sides and the average spacing between trees can be set wider.
Limitations and Prospects
Limitations of the period of the study: In order to obtain a more targeted research conclusion, this article focuses on the summer daytime when the thermal comfort of the waterfront trail is relatively negative, as the research time period, but this conclusion may not apply to the nighttime waterfront trail. Given the completeness of the findings, this needs to be discussed in follow-up studies.
Limitations of the research method: This study quantifies the three cross-sections of the top, facade, and bottom of the waterfront trail space into six spatial form parameters and explores the relationship between these parameters and thermal comfort at a micro scale. The findings of this study have certain general applicability in similar climate environments. However, it is important to note that there is currently a lack of classified research on the impact of the external spatial pattern of the waterfront trail on thermal comfort, including factors such as the geographical orientation and direction of the waterfront trail. These aspects need to be comprehensively considered in future research endeavors.
Recommend for future works or implementations: This study can provide guidance for the landscape design of the waterfront trail space and help the design optimize the thermal comfort of the waterfront trail space in a feasible, low-energy, and green way, as stated in the conclusion of the manuscript: The study suggests that in order to achieve more suitable thermal comfort conditions in summer, the width of the waterfront trails should not be too wide, and trees can be planted on both sides if it is too high, and the average distance between trees can be set wider.
Ethics approval
This study involved human/animal subjects but did not require ethical approval. We followed strict ethical guidelines and principles to protect the rights of the participants, including privacy and confidentiality, informed consent, and data protection. We obtained the consent of the participants and ensured the confidentiality and privacy of all data.
Availability of data and material
The datasets used and/or analyzed during the current study are available from the corresponding author upon reasonable request.
Note: The pictures in this article are all drawn by the authors.
Disclosure statement
No potential conflict of interest was reported by the author(s).
Additional information
Funding
References
- Alawadhi, E. M. 2022. “Thermal Comfort Analyses on Jogging Trails: The Effect of Trail Direction and Tree Shading on Trial Surface and Physiological Equivalent Temperatures.” Journal of Thermal Biology 110:103358. https://doi.org/10.1016/j.jtherbio.2022.103358.
- Ali-Toudert, F. and Mayer, H. 2006. “Numerical Study on the Effects of Aspect Ratio and Orientation of an Urban Street Canyon on Outdoor Thermal Comfort in Hot and Dry Climate.” Building & Environment, 41(2), 94–108. https://doi.org/10.1016/j.buildenv.2005.01.013.
- Brown, R. D. 2011. “Ameliorating the Effects of Climate Change: Modifying Microclimates Through Design.” Landscape and Urban Planning 100 (4): 372–374. https://doi.org/10.1016/j.landurbplan.2011.01.010.
- Charalampopoulos, I., I. Tsiros, A. Chronopoulou-Sereli, and A. Matzarakis. 2013. “Analysis of Thermal Bioclimate in Various Urban Configurations in Athens, Greece.” Urban Ecosystems 16 (2): 217–233. https://doi.org/10.1007/s11252-012-0252-5.
- Chen, Y. C., and A. Matzarakis. 2014. “Modification of Physiologically Equivalent Temperature.“ Journal of Heat Island Institute International, 9, 26–32.
- Chen, L., Y. Wen, L. Zhang, and W. N. Xiang. 2015. “Studies of Thermal Comfort and Space Use in an Urban Park Square in Cool and Cold Seasons in Shanghai.” Building & Environment 94 (DEC.PT.2): 644–653. https://doi.org/10.1016/j.buildenv.2015.10.020.
- Chen, L., Y. Zhang, J. Han, and X. Li. 2021. “An Investigation of the Influence of Ground Surface Properties and Shading on Outdoor Thermal Comfort in a High-Altitude Residential Area.” Frontiers of Architectural Research 10 (2): 432–446. https://doi.org/10.1016/j.foar.2020.12.005.
- Cheung, P. K., and C. Y. Jim. 2018. “Subjective Outdoor Thermal Comfort and Urban Green Space Usage in Humid-Subtropical Hong Kong.” Energy & Buildings 173:150–162. https://doi.org/10.1016/j.enbuild.2018.05.029.
- Cui, P., J. Jiang, J. Zhang, and L. Wang. 2023. “Effect of Street Design on UHI and Energy Consumption Based on Vegetation and Street Aspect Ratio: Taking Harbin as an Example.” Sustainable Cities and Society 92:92. https://doi.org/10.1016/j.scs.2023.104484.
- Davtalab, J., S. P. Deyhimi, V. Dessi, M. R. Hafezi, and M. Adib. 2020. “The Impact of Green Space Structure on Physiological Equivalent Temperature Index in Open Space.” Urban Climate 31:100574. https://doi.org/10.1016/j.uclim.2019.100574.
- Emmanuel, R., H. Rosenlund, and E. Johansson. 2010. “Urban Shading—A Design Option for the Tropics? A Study in Colombo, Sri Lanka.” International Journal of Climatology 27 (14): 1995–2004. https://doi.org/10.1002/joc.1609.
- Erik, J., W. Moohammed, I. Yahia, C. Arroyo, and Bengs. 2017. “Outdoor Thermal Comfort in Public Space in Warm-Humid Guayaquil, Ecuador.” International Journal of Biometeorology 62 (3): 387–399. https://doi.org/10.1007/s00484-017-1329-x.
- Fahmy, M., S. Sharples, and M. Yahiya. 2010. “LAI Based Trees Selection for Mid Latitude Urban Developments: A Microclimatic Study in Cairo, Egypt.” Building & Environment 45 (2): 345–357. https://doi.org/10.1016/j.buildenv.2009.06.014.
- Fanger, P. O. 1972. Thermal Comfort. New York: McGraw-Hill.
- Fei, T., and H. Xu. 2013. “Remote Sensing Analysis of Quantitative Relationship Between Urban Impervious Surface and Land Surface Temperature.” Journal of Jilin University (Earth Science Edition) 43 (6): 1987–1996+2017. https://doi.org/10.13278/j.cnki.jjuese.2013.06.030.
- Fröhlich, D., and A. Matzarakis. 2016. “A Quantitative Sensitivity Analysis on the Behaviour of Common Thermal Indices Under Hot and Windy Conditions in Doha, Qatar.” Theoretical and Applied Climatology 124 (1–2): 179–187. https://doi.org/10.1007/s00704-015-1410.5.
- Gao, Y., K. Yu, Y. Liu, L. Yang, F. Chen, and J. Liu. 2021. “Study on Microclimate Effect of Crowned Footpath in Autumn–A Case Study of Fudao in Fuzhou.” Journal of Northwest Forestry University 36 (1): 266–272. https://kns.cnki.net/kcms/detail/61.1202.S.20210113.0945.002.html.
- Herrmann, J., and A. Matzarakis. 2012. “Mean Radiant Temperature in Idealised Urban Canyons—Examples from Freiburg, Germany.” International Journal of Biometeorology 56 (1): 199–203. https://doi.org/10.1007/s00484-010-0394-1.
- Höppe, P. R. 1999. “The Physiological Equivalent Temperature - a Universal Index for the Biometeorological Assessment of the Thermal Environment.” International Journal of Biometeorology 43 (2): 71–75. https://doi.org/10.1007/s004840050118.
- Jin, H., S. Liu, and J. Kang. 2019. “Thermal Comfort Range and Influence Factor of Urban Pedestrian Streets in Severe Cold Regions.” Energy & Buildings 198:197–206. https://doi.org/10.1016/j.enbuild.2019.05.054.
- Johansson, E., and R. Emmanuel. 2006. “The Influence of Urban Design on Outdoor Thermal Comfort in the Hot, Humid City of Colombo, Sri Lanka.” International Journal of Biometeorology 51 (2): 119–133. https://doi.org/10.1007/s00484-006-0047-6.
- Karimimoshaver, M., and M. S. Shahrak. 2022. “The Effect of Height and Orientation of Buildings on Thermal Comfort.” Sustainable Cities and Society 79:103720. https://doi.org/10.1016/j.scs.2022.103720.
- Kong, L., K. K.-L. Lau, C. Yuan, Y. Chen, Y. Xu, C. Ren, and E. Ng. 2017a. “Regulation of Outdoor Thermal Comfort by Trees in Hong Kong.” Sustainable Cities and Society 31:12–25. https://doi.org/10.1016/j.scs.2017.01.018.
- Lin, W., C. Zeng, N. Lam, Z. Liu, J. Tao, X. Zhang, B. Lyu, N. Li, D. Li, and Q. Chen. 2021. “Study of the Relationship Between the Spatial Structure and Thermal Comfort of a Pure Forest with Four Distinct Seasons at the Microscale Level.” Urban Forestry & Urban Greening 62:127168. https://doi.org/10.1016/j.ufug.2021.127168.
- Lin, W., C. Zeng, W. Nie, X. Nan, S. Shen, Y. Shi, H. Yan, F. Yang, R. Wu, and Z. Bao. 2022. “Study of the Vertical Structures, Thermal Comfort, Negative Air Ions, and Human Physiological Stress of Forest Walking Spaces in Summer.” Forests 13 (2): 335. https://doi.org/10.3390/f13020335.
- Liu, S., S.-Q. Lai, C. Liu, and L. Jiang. 2021. “What Influenced the Vitality of the Waterfront Open Space? A Case Study of Huangpu River in Shanghai, China.” Cities 114 (10): 103197. https://doi.org/10.1016/j.cities.2021.103197.
- Liu, W., Y. Zhang, and Q. Deng. 2016. “The Effects of Urban Microclimate on Outdoor Thermal Sensation and Neutral Temperature in Hot-Summer and Cold-Winter Climate.” Energy & Buildings 128:190–197. https://doi.org/10.1016/j.enbuild.2016.06.086.
- Mei, Y., and L. Xu. 2022. “Research on Seasonal Thermal Neutral Temperature in West Lake Scenic Area of Hangzhou, China.” International Journal of Environmental Research and Public Health 19 (22): 14677. https://doi.org/10.3390/ijerph192214677.
- Mei, Y., L. Xu, and Z. Li. 2023. “Study on Emotional Perception of Hangzhou West Lake Scenic Area in Spring Under the Influence of Meteorological Environment.” International Journal of Environmental Research and Public Health 20 (3): 1905. https://doi.org/10.3390/ijerph20031905.
- Morakinyo, T. E., and Y. F. Lam. 2016. “Simulation Study on the Impact of Tree-Configuration, Planting Pattern and Wind Condition on Street-Canyon’s Micro-Climate and Thermal Comfort.” Building & Environment 103:262–275. https://doi.org/10.1016/j.buildenv.2016.04.025.
- Narimani, N., A. Karimi, and R. D. Brown. 2022. “Effects of Street Orientation and Tree Species Thermal Comfort within Urban Canyons in a Hot, Dry Climate.” Ecological Informatics 69:101671. https://doi.org/10.1016/j.ecoinf.2022.101671.
- Nie, T., D. Lai, K. Liu, Z. Lian, Y. Yuan, and L. Sun. 2022. “Discussion on Inapplicability of Universal Thermal Climate Index (UTCI) for Outdoor Thermal Comfort in Cold Region.” Urban Climate 46:101304. https://doi.org/10.1016/j.uclim.2022.101304.
- Oke, T. R. 2010. “Canyon Geometry and the Nocturnal Urban Heat Island: Comparison of Scale Model and Field Observations.” International Journal of Climatology 1 (3): 237–254. https://doi.org/10.1002/joc.3370010304.
- Potchter, O., P. Cohen, T.-P. Lin, and A. Matzarakis. 2018. “Outdoor Human Thermal Perception in Various Climates: A Comprehensive Review of Approaches, Methods and Quantification.” The Science of the Total Environment 631-632:390–406. https://doi.org/10.1016/j.scitotenv.2018.02.276.
- Ribeiro, K. F. A., A. C. A. Justi, J. W. Z. Novais, F. M. D. M. Santos, M. C. D. J. Nogueira, S. A. Miranda, and J. B. Marques. 2022. “Calibration of the Physiological Equivalent Temperature (PET) Index Range for Outside Spaces in a Tropical Climate City.” Urban Climate 44:101196. https://doi.org/10.1016/j.uclim.2022.101196.
- Sanaieian, H., M. Tenpierik, K. V. D. Linden, F. Mehdizadeh Seraj, and S. M. Mofidi Shemrani. 2014. “Review of the Impact of Urban Block Form on Thermal Performance, Solar Access and Ventilation.” Renewable and Sustainable Energy Reviews 38:551–560. https://doi.org/10.1016/j.rser.2014.06.007.
- Spagnolo, J., and R. De Dear. 2003. “A Field Study of Thermal Comfort in Outdoor and Semi-Outdoor Environments in Subtropical Sydney Australia.” Building & Environment 38 (5): 721–738. https://doi.org/10.1016/S0360-1323(02)00209-3.
- Tang, F., and Q. Xu. 2013. “Remote Sensing Analysis of Quantitative Relationship Between Urban Impervious Surface and Land Surface Temperature.” Journal of Jilin University (Earth Science Edition) 43 (6): 1987–1996+2017. https://doi.org/10.13278/j.cnki.jjuese.2013.06.030.
- Tan, J., Y. Zheng, G. Song, L. S. Kalkstein, A. J. Kalkstein, and X. Tang. 2006. “Heat Wave Impacts on Mortality in Shanghai, 1998 and 2003.” International Journal of Biometeorology 51 (3): 193–200. https://doi.org/10.1007/s00484-006-0058-3.
- Vidrih, B., and S. Medved. 2013. “Multiparametric Model of Urban Park Cooling Island.” Urban Forestry & Urban Greening 12 (2): 220–229. https://doi.org/10.1016/j.ufug.2013.01.002.
- Wu, Z., and L. Chen. 2016. “Thermal Comfort Evaluation and Urban Thermal Environment Research: Present Situation, Characteristics and Prospect.” Chinese Journal of Ecology 35 (5): 1364–1371. https://doi.org/10.13292/j.1000-4890.201605.036.
- Xi, T., H. Qin, H. Wang, and H. JIn. 2021. “Study on Dynamic Thermal Comfort of Walking Crowd in Stalin Park Along the Yangtze River in Summer.” Building Science 37 (8): 93–103. https://doi.org/10.13614/j.cnki.11-1962/tu.2021.08.12.
- Yahia, M. W. and E. Johansson. 2012. “Influence of Urban Planning Regulations on the Microclimate in a Hot, Dry Climate: The Example of Damascus, Syria.” Journal of Housing and the Built Environment, 28(1), 51–65. https://doi.org/10.1007/s10901-012-9280-y.
- Yahia, M. W., E. Johansson, S. Thorsson, F. Lindberg, and M. I. Rasmussen. 2017. “Effect of Urban Design on Microclimate and Thermal Comfort Outdoors in Warm-Humid Dar Es Salaam, Tanzania.” International Journal of Biometeorology.
- Zhang, J., Z. Gou, Y. Lu, and P. Lin. 2019. “The Impact of Sky View Factor on Thermal Environments in Urban Parks in a Subtropical Coastal City of Australia.” Urban Forestry & Urban Greening 44:126422. https://doi.org/10.1016/j.ufug.2019.126422.
- Zhang, L., Q. Zhan, and Y. Lan. 2018. “Effects of the Tree Distribution and Species on Outdoor Environment Conditions in a Hot Summer and Cold Winter Zone: A Case Study in Wuhan Residential Quarters.” Building & Environment 130:27–39. https://doi.org/10.1016/j.buildenv.2017.12.014.
- Zhao, J., and J. Liu. 2007. “Numerical Simulation of Thermal Environment in Urban Street Canyon and Its Planning and Design Countermeasures.” Journal of Architecture 53 (3): 37–39.
- Zhao, X.-L., D.-Q. Zhao, Y. Zhou, and J.-J. Lv. 2017. “The Microclimate Effect of Urban Park Fitness Trail in Spring —- a Case Study of Harbin Zhao Lin Park.” Energy Procedia 134:266–275. https://doi.org/10.1016/j.egypro.2017.09.616.
- Zhao, X., Y. Zhou, D. Zhao, and J. Lu. 2018. “Study on Microclimate Characteristics of Fitness Trail in Harbin Zhaolin Park in Spring Based on Mobile Measurement Method.” Chinese Landscape Architecture 34 (9): 58–62.
- Zhou, W., J. Wang, and M. L. Cadenasso. 2017. “Effects of the Spatial Configuration of Trees on Urban Heat Mitigation: A Comparative Study.” Remote Sensing of Environment 195:1–12. https://doi.org/10.1016/j.rse.2017.03.043.