
 ?Mathematical formulae have been encoded as MathML and are displayed in this HTML version using MathJax in order to improve their display. Uncheck the box to turn MathJax off. This feature requires Javascript. Click on a formula to zoom.
ABSTRACT
To reasonably evaluate the robustness of RC frame structures, the ability to resist continuous collapse is improved. In this paper, the members’ contribution to the bearing capacity of the structure and the impact of the member’s failure are comprehensively considered, and the calculation method of the importance coefficient of the member is improved. At the same time, the structural vulnerability coefficient based on the change of the strain energy of the structure is combined with the reasonable assessment of the structural robustness through the two aspects of the member and the structure finishing. The redundancy analysis of the peripheral components of the failed components is carried out, and the low redundancy components are strengthened to improve the robustness of the structure to achieve the purpose of “strengthening the part and improving the whole”. On this basis, this paper evaluates the robustness of a four-story RC frame structure. It strengthens the low redundancy components under the influence of failure components to meet the requirements of improving the robustness of the structure, which verifies the rationality of the robustness evaluation method of the RC frame structure in this paper and the feasibility of improving the robustness of the structure.
In the 1970s, the term “Robustness” became popular in statistics, but with the deepening of research in the engineering industry, “Robustness” has been repeatedly mentioned in continuous collapse studies. In 1994, the Standing Committee on Structural Safety (SCOSS) defined “robustness” as “the ability to resist disproportionate collapse” (The Standing Committee on Structural Safety (SCOSS), Citation1994). In the Unified Standard for the Design of Reliability of Engineering Structures (GB 50,153–2018) issued in 2008, the robustness of structures is defined as “the overall stability. When accidental events such as fire, explosion, impact, or human error occur, the overall structure can maintain stability and does not cause disproportionate damage consequences (Citation2009)”. Lv Dagang et al. defined structure robustness as “the ability of the structural system to avoid damage disproportionate to the overall failure consequence and the local damage caused under the condition that accidental events cause local damage to the structure (Dagang et al. Citation2011)”. Therefore, the robustness of a structure can reflects the ability of the structure to resist continuous collapse. The stronger the ability of a structure with good robustness to resist the risk of continuous collapse, the smaller the overall damage of the structure caused by the continuous collapse.
It is currently one of the commonly used methods to evaluate the continuous collapse resistance of building structures through the robustness of structures. In recent years, there have been many studies on the robustness evaluation methods of structures. Fang et al. (Zhangxin and Huiqiang Citation2007) used structures’ energy change as the structural robustness evaluation index. Husain proposed the redundant strength index of the structure based on Pushover analysis (Husain and Tsopelas Citation2004), and blade equality (Lieping et al. Citation2010) characterized the robustness of the structure by considering the stiffness matrix of the structural load path. Ren Weixin et al. (Ren and Jin Citation2018) proposed an evaluation index based on strain energy by summarizing the essential meanings of structural robustness, redundancy, and vulnerability. Feng et al. (De-Cheng et al. Citation2023) proposed a non-parametric seismic vulnerability assessment framework based on PDEM and found an analytical method satisfying both computational efficiency and computational accuracy in the vulnerability analysis of RC structures. Feng et al. (De-Cheng, Xu-Yang, and Michael Citation2022) further studied the strengthening mechanism of the PDEM framework and considered multiple limit states and failure modes of structures, providing a more comprehensive decision-making reference for structural robustness in practical engineering. Through the intelligent structure of STMD and SASD, Wang et al. (Liangkun et al. Citation2023; Liangkun, Ying, and Weixing Citation2023) effectively reduced the structural response under earthquake excitation and improved the seismic performance of passive base isolation structures. Regarding soil structure interaction, APEC-PTMD and SAVP-TMD are developed for high-rise buildings. Considering artificial vibration, APVS-TMD is proposed for man-shaped flyovers. In order to protect the life cycle of the structure, SAEC-PTMD is proposed, and the above method has a better anti-seismic protection effect on the structure (Liangkun et al. Citation2019, Citation2019, Citation2020, Citation2022; Liangkun, Weixing, and Ying Citation2022; Wang et al. Citation2020, Citation2020). Cao et al. (Citation2022) studied the influence of slabs on the bearing capacity of prestressed reinforced concrete frame structures, and the research structure reflected that ignoring the impact of slabs would overestimate the bearing capacity of systems. Cao, De-Cheng, and Yue (Citation2023) studied four probability-based seismic vulnerability analysis principles and analyzed their applicability under different conditions. At the same time, he proposed a vulnerability framework based on probability-density evolution (Cao, De Cheng, and Michael Citation2023) and considered the combination of volumetric and demand uncertainties, providing a new scheme for the vulnerability assessment of structures.
Some scholars use different methods to evaluate the performance of a single component or the overall structure from different angles. Some scholars have proposed many methods to improve the structure’s performance given the existing problems of the current structure. In continuous collapse, the failure of a single component causes different degrees of damage to the surrounding components and finally destroys the whole structure. Most of the robustness evaluations from the perspective of importance, redundancy and other components focus on a single component and ignore the impact of failure on other components. The study of vulnerability based on strain energy and probability density evolution provides a new idea for the robustness of the structure. However, due to the study of the whole structure, it is challenging to enhance the performance of a particular component or some components to improve the overall robustness of the structure, and it cannot provide a performance improvement method that meets the financial requirements. This paper evaluates the overall robustness of the system by combining the component importance coefficient at the component level and the structural vulnerability at the general level, reflecting the impact of a single component failure on the surrounding components as well as the impact of a single component failure on the overall structure. At the same time, the structural robustness enhancement method of “strengthening the part and improving the whole” is proposed.
The structural robustness evaluation method is reasonable and can be applied in practice. It is necessary to have a robustness index that is simple to calculate and can evaluate the robustness. After the robustness evaluation of the structure, a method can be given to improve the overall robustness of the structure, which should not only meet the overall performance improvement of the structure but also meet the economic requirements in practical engineering. In this paper, the component importance coefficient calculation method is improved by the change of structural bearing capacity and the factors affecting the area after column failure. Combined with the structural vulnerability coefficient based on the structural strain energy after column failure. The overall robustness of an RC frame structure is evaluated. The redundancy of the affected beams after column failure is analyzed, and the beams with low redundancy after column failure are found. The strengthening of local beams can improve the overall performance of the structure, thus achieving the purpose of improving the robustness of the structure.
1. Evaluation of structural robustness
1.1. Component importance factor
The component’s importance mainly reflects the component’s influence on the overall performance of the structure when the accidental load damages it. Gao Yang et al. (Yang and Xila Citation2008) proposed a calculation method for a member’s importance coefficient based on the member’s geometric topological relationship, member stiffness and external load. Huang Liang (Liang and Long Citation2012) expressed the importance coefficient of member based on the bearing capacity ratio before and after the plane truss and plane frame structure. The former considers the influence of various factors on the component. At the same time, the latter takes two kinds of plane structures as an example to quantify the importance coefficient of the component through the bearing capacity. In actual structures, when a member is damaged by accidental load or fails, it will affect the local bearing capacity of the structure on the supporting area of the member, resulting in continuous collapse. In this paper, a new calculation method for the importance coefficient of the member is proposed by comprehensively considering the change in the overall bearing capacity of the structure after column failure and the affected sash area (Chengmao and Xila Citation2004).
The ratio of structural bearing capacity change before and after column failure to structural ultimate bearing capacity after column failure is used to represent the influence of components on the overall bearing capacity of the structure. The calculation formula is as follows:
Where γi is the bearing capacity coefficient of the member; Ri is the structural bearing capacity after the failure of member i, and Rlim is the ultimate bearing capacity of the structure.
The affected bay area after column failure is shown in the shadow part of , whose length and width are 1/2 of the depth of a single bay. As can be seen from the diagram, the larger the supporting area affected by the failure of the component column, the more other components affected by the failure, and the higher the risk of continuous collapse. The calculation formula of affected area Si is shown in EquationEquation (2)(2)
(2) , and the impact degree of component area failure is S, shown in EquationEquation (3)
(3)
(3) :
Figure 1. Diagram of area affected by failure of component column.
Where M is the number of total floors of the structure, m is the number of floors where component i is located, Si0 is the area affected by component i failure, and S0 is the total area of the whole building floor. The smaller the S value, the more limited the area that can be affected after the component’s failure. It can be seen from Formula (3) that the higher the floor, the smaller the room area.
The importance of a component is a vital component attribute to the whole structure. To reflect the impact of component i failure on the bearing capacity and supporting area of the structure, the importance coefficient of component CIi is proposed in this paper to represent the importance degree of component i in the structure.
In the equation, γ reflects the degree of influence of component i failure on the structure’s bearing capacity based on the structural bearing capacity. The larger the value, the greater the influence of the component on the overall bearing capacity of the structure. S represents the open space area affected by the failure of component i. The larger the value, the more components in the supporting area will be affected by the component’s failure. The CIi obtained by combining the two is the new component importance coefficient. A more significant value indicates that component i has a greater impact on the bearing capacity of the structure and a more significant impact area after failure, indicating that component i is more important to the structure.
1.2. Structural vulnerability coefficient
Structural vulnerability mainly reflects the ability of a structure to withstand loads without damage or destruction. The smaller the structural resistance to loads, the weaker the structural resistance to load damage. That is, the more vulnerable the structure is. Structural vulnerability is related to load, and its damage to failure is a change process. “Energy” reflects physical and mechanical indexes such as component deformation and bearing capacity (Zhao Xin and Huiqiang Citation2007) to effectively avoid complex mechanical calculations from the perspective of overall structural energy. The more energy a structure can absorb after component failure, the greater the load the structure can bear and the less vulnerable the structure. When the component column fails, part of the supported structure will deform downward. The energy dissipation of the structure mainly depends on the energy dissipation capacity of the beam through the bending deformation. Currently, the energy dissipation level of the structure largely depends on the energy dissipation capacity of the beam (Zhaoxin Citation2008).
Figure 2. In , Point a represents the structural strain energy when the middle beam of the structure reaches the yield state after the failure of member i, and point B represents the structural strain energy when the middle beam of the structure fails after the failure of member i.
Figure 3. Diagram of beam affected by column failure.
Based on the energy dissipation capability of the structure, this paper proposes the Component vulnerability coefficient (CVi). The smaller the value, the weaker the energy dissipation capability of the structure; that is, the smaller the load the structure can withstand after the failure of component i, and the structure is more vulnerable.
In Formula (4), Eyield represents the structural strain energy when the beam reaches the yield state after the failure of member i. Edamage represents the structural strain energy when the beam in the structure fails after the failure of member i.
1.3. Structural robustness analysis
The component importance coefficient represents the overall importance of the component to the structure, and the structural vulnerability coefficient represents the overall ability of the structure to resist load damage. The structural robustness coefficient proposed by Chen Yongliang (Yongliang et al. Citation2014) judges the robustness of the structure from the importance of the component to the structure and its vulnerability. Li Deng (Deng Citation2011) quantifies the structural robustness based on the key and vulnerability of the component. Without considering the change in the overall structure performance after component failure, this paper proposes the robustness index Ci from the component level and the overall structure level to represent the importance of component i to the structure and the vulnerability of the structure when component i fails, to evaluate the overall robustness of the structure.
In Formula (5), when both the component importance coefficient and the structural vulnerability coefficient are more prominent, the more critical the component is, and the more vulnerable the whole structure is after its failure. The component has a more significant impact on the overall robustness of the structure. Suppose there are multiple such components in the structure. In that case, it means that when such components fail, the overall ability of the structure to resist external load is poor, and the structural robustness is insufficient.
2. Structural performance improvement
2.1. Component redundancy analysis
The redundancy at the component level reflects the safety degree of components under working load, and the redundancy at the system level reflects the importance degree of components in the system (Weiqing et al. Citation2018). Wang et al [30] an adaptive passive eddy current pendulum TMD (APEC-PTMD) is proposed to improve robustness by changing the length of the pendulum to adjust the frequency and adjusting the air gap between the permanent magnet and the conductive plate to adjust the damping ratio. Zhu Nanhai et al. (Gang Citation2009) proposed to measure structural redundancy based on structural strain sensitivity, which was defined as the derivative of structural strain to the elastic modulus. Yu-Gang (Citation2012) took the relationship between the strain energy when the structural system is intact and the strain energy after the structural system’s failure as the structure’s redundancy index. The research of redundancy mainly focuses on the study of a single component, which is used to characterize the vulnerability and importance of the component or focuses on the overall impact on the structure when a component is damaged. In the continuous collapse of a structure, when the damage of a component leads to the collapse of the whole structure, the damage will first affect the surrounding components. When it has a sufficient force transmission path, the structure’s whole or local continuous collapse will not be triggered. The performance index DCR (Nanhai and Jieming Citation2021) is used in the GSA guidelines to evaluate the damage situation of each framework, which is defined as follows:
QUD is the combination of the bending moment, axial force, shear force or internal force of a member or node; QCE is the expected ultimate bending moment, axial force, shear force or combination of internal forces of a member or node. For a typical regular structure, when DCR >2, it is judged as a component failure. For the atypical complex structure, DCR >1.5 is judged as a component failure. Based on this, this paper uses the beam bending moment change within the influence range after component failure to represent the redundancy of component i after a component failure. The calculation formula is as follows:
In Formula (4), Uj refers to the redundancy of component j within a specific area after component i; Mjlim represents the ultimate bending moment of component j when the plastic failure occurs after component i failure. Mj0 represents the bending moment of member j after the failure of member i. The larger the Uj value is, the higher the redundancy of member j after the failure of member i can bear the excess load borne by member i after the failure of member I. When Uj≤0, it indicates that component j reaches its limit value after the failure of component i, and component j fails, it indicates that the redundancy of the component is low, and the structure has the risk of continuous collapse after the failure of component i.
Formula (8) is used to calculate the structural redundancy Ui after the failure of component i. If Ui ≤0, it indicates that the failure of component i will cause the failure of components within its influence range, and the structure has the risk of partial or overall continuous collapse. When Ui > 0 and the value is more significant, it indicates that after the failure of component i, the redundancy of other components is better, and the structure will not collapse continuously.
There are three kinds of column failure in continuous collapse: inner column failure, side column failure and corner column failure, in which the side column is divided into a long side column and a short side column. According to the space area affected by a component failure in , the same floor affects the Angle column failure in the space; two bearing beams (n = 2, the same as below) jointly bear the force borne by the Angle column. The main affected beams have two beams represented by shadows in . When the side column fails, the beams represented by the shadow part in are the three main affected beams. When the side column fails, the three bearing beams represented by the figure’s shadow part jointly bear the structure’s vertical force instead of the side column. Similarly, when the inner column fails, the space area affected is more prominent, so more components are mainly affected when the failure occurs. There are four beams, as shown in .
Figure 4. Model size and beam and column number.
2.2. Structural performance improvement
Jizhuo and Zhan (Citation2012) enhanced the structural performance by strengthening the high-vulnerableness and low-redundancy components. In contrast, Huang Jizhuo (Citation2006) enhanced the structural robustness performance by designing the sections of components with high-importance coefficients. In this paper, after finding the component that is important to the structure and more vulnerable after failure through the robustness index, the redundancy of the remaining components within the influence range of the component is calculated. When Ui < 1 and the value is enormous, it indicates that the component dramatically influences the surrounding components. However, the structural redundancy is good, and the structure will not collapse locally. Therefore, only the component can be strengthened. Reduce its influence on the overall robustness of the structure. Suppose the robustness coefficient is significant and the structural redundancy value Ui is greater than or equal to 1. In that case, it indicates that the component has a more significant influence on the surrounding components, while the structural redundancy is poor, which will cause partial collapse of the structure. The component and component i with Uj ≥ 1 are locally strengthened, which improves the redundancy of component j and reduces the influence of component i on the structural robustness performance.
Through the method presented in this paper, column members with significant robustness coefficients are found, and the beam members within the influence range are analyzed for redundancy. Beam members with poor redundancy are found to performance strengthening, and the overall robustness after the failure of member i is enhanced. Avoid analyzing components one by one, strengthen local components to improve the structure’s overall robustness, improve the structure’s performance in practical engineering and meet the economic requirements in practical engineering.
3. Example
3.1. Reinforced concrete frame model design
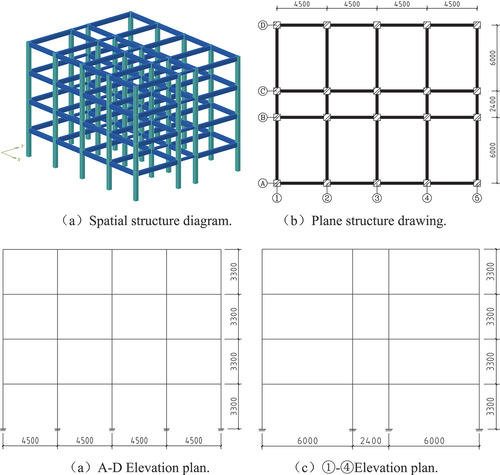
The structure takes the reinforced concrete frame in the 4-storey space as an example. The model plane, elevation dimensions and reinforced concrete structure model are shown in . The number of beams and columns is represented by the number of layers – vertical axis – horizontal axis line. For example, 1A–1 represents the corner column at the intersection of axis A and axis 1 of the first layer; 1B–12 represents the beam on axis 12 on axis B of the first layer; 1BC–1 represents the beam on the BC axis of axis 1 of the first layer. The column size in the structure is 400mm ×400mm, the beam section size between the BC axis is 250mm ×250mm, and the other beam section size is 250mm ×500mm. The concrete strength is C30, the longitudinal reinforcement is HRB335, and the hoop is HPB300. The standard value of the constant load is 5kN/m2, and the standard value of the live load is 2kN/m2. Through calculation, it is applied on the beam equivalent, and the wind load is not considered due to the low number of layers. PKPM is used to calculate the internal force and reinforcement of the structure. Because of the simple structure, considering the merging of reinforcement and simple operation, the reinforcement of each layer of beams and columns has the same bottom layer. Import the model into SAP2000 (Beijing Golden Civil Engineering Software Technology Co., Ltd, China Architectural Standards Design and Research Institute Citation2006) after meeting the specification requirements.
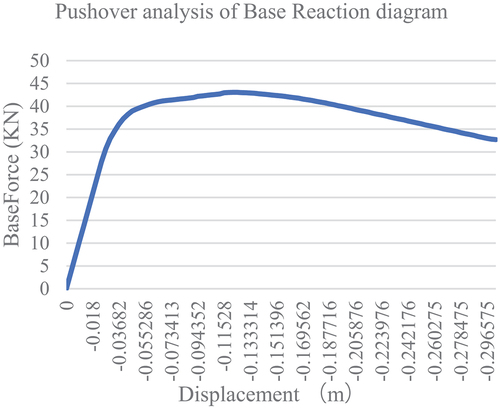
Figure 5. Change diagram of base reaction analyzed by Pushover.
3.2. Component importance factor
In SAP2000, the structural bearing capacity after the failure of component is obtained by removing the component method, and Pushover analysis is performed on the structure. Taking the one-layer corner column as , when the structure is destroyed, the base reaction of the structure rapidly drops to 0, and the base reaction during the failure of the structure is taken as the ultimate bearing capacity after the failure of component i. That is the figure’s maximum value of the corresponding base reaction pair.
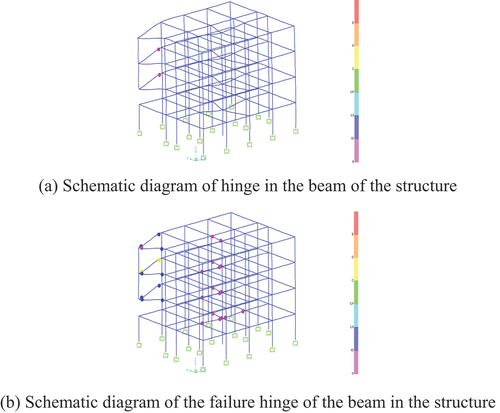
Figure 6. Schematic diagram of beam hinge results in the structure.
This paper removes one corner column, one short-side middle column, one long-side middle column and one inner column from each floor, respectively. The bearing capacity coefficient and the influence degree of the area of the component are obtained through EquationEquations (1)(1)
(1) and (Equation2
(2)
(2) ). The first and fourth floors are taken as an example. The specific calculation results are shown in Table.
By analyzing the bearing capacity coefficients of the components in , the bearing capacity coefficients of the middle bottom corner column, short side middle column, long side middle column and inner column in the same layer increase successively, so the corner column has a more significant influence on the bearing capacity of the structure. For columns in the same vertical direction, the bearing capacity coefficient increases successively, indicating that the higher the floor, the less the impact of removing columns on the structure’s bearing capacity, which is obviously in line with common sense.
Table 1. Component importance factor.
According to the influence degree of area, the influence area of columns on the overall structure decreases with the number of floors increase. According to the component importance coefficient obtained from the comprehensive bearing capacity coefficient and the influence degree of area, the bottom corner column is not the most important to the structure. The vertical load shared by the inner and side columns is greater than that of the corner columns. The load borne by the inner column and the side column also decreases with the increase in the number of floors. When the inner column of the bottom layer shares the vertical load, its failure area is the largest, so its importance is more significant. Considering the bearing capacity and the area affected by the failure, the importance of different floor columns at the exact location decreases with the increased number of floors.
3.3. Structural vulnerability coefficient
After the removal of member i, the beam in the structure is damaged with the increase in load. In SAP2000, the hinge is set for the beam in the structure. After pushover analysis, the beam will yield when the state of the plastic hinge on the beam is B to ≤C. When C to ≤D, the component is damaged. Taking the removal of the two-storey corner column as an example, after the member’s removal, the structure has a plastic hinge, as shown in .
After the removal of member i, the pushover method is used to obtaining the strain energy of the structure when the plastic hinge appears and the strain energy of the structure Eyield when the beam reaches the yield state after the failure of member i. The strain energy Edamage of the structure is taken as the strain energy damage of the structure when the plastic failure occurs, and the beam fails after the failure of member i. The results of the calculation are as follows:
3.4. Structural robustness analysis
The component robustness index Ci was calculated according to Formula (5), and the calculated results were as follows:
According to the structural vulnerability coefficients in , columns on the exact position of different floors have less influence on the overall vulnerability of the structure as the number of floors increases. On the same floor, the failure of the inner column will affect more surrounding components, which will have a more significant impact on the structural vulnerability.
Table 2. Structural vulnerability coefficient after removing one layer of column.
Table 3. Structural vulnerability.
Based on the robustness coefficient in , the columns that have a more significant influence on the overall robustness of the structure are identified based on the importance of components and structural vulnerability. In this example, the inner column 1B–3 of the bottom layer, 2B–3 of the second layer and 3B–3 of the third layer are much more critical to the structure than other columns, followed by the short side middle column 1C–1 of the bottom layer and the long side middle column 1A–4 of the bottom layer.
Table 4. Robustness index.
3.5. Component redundancy
This paper selects columns 1B–3, 2B–3, 3B–3,1C–1,1A–4 with high robustness index to analyze the beams affected by their failure, respectively. The bending moment value of member j after the removal of member i is taken as the initial bending moment Mj0 of member j. When the structure failure occurs, the bending moment value of member j is taken as the ultimate bending moment Mjlim. The structural redundancy is calculated by Formula (7), shows the calculation results
The beam member with low redundancy in the affected member after failure is strengthened. By adding a longitudinal bar to 1BC–3 and 2BC–3 to strengthen the flexural performance of the member, for example, the redundancy of the member after performance strengthening is as follows:
According to , the redundancy analysis is carried out on the influencing beams after finding important components whose failure structures are more vulnerable through the robustness index. After strengthening the performance of beams with low redundancy, the redundancy of components is improved, and the robustness index is reduced to a certain extent, thus strengthening the overall robustness of the structure.
Table 5. Removal of 1B–3 affects beam redundancy.
Table 6. Removal of 2B–3 affects beam redundancy.
Table 7. Removal of 3B–3 affects beam redundancy.
Table 8. Removal of 1C–1 affects beam redundancy.
Table 9. Removal of 1A–4 affects beam redundancy.
Table 10. Strengthen 1BC–3 beam redundancy and robustness index.
Table 11. Strengthen 2BC–3 beam redundancy and robustness index.
4. Conclusion
Continuous collapse occurs because the failure of a component in the structure affects the damage of its local components until it is destroyed, and then the whole system collapses. Most robustness evaluation focuses on a part or structure as a whole and ignores the process of local component failure in the middle. In addition, in improving the structure’s robustness, because the accidental load is uncontrollable, it cannot be guaranteed that the load will only cause damage to a single member. If the whole structure is strengthened, the workload will be significant and cannot meet the financial requirements.
Therefore, based on the bearing capacity and the affected area after failure, this paper proposes the importance coefficient of components and structural vulnerability based on strain energy after the collapse of components, finds the column in a four-storey reinforced concrete frame structure that has a more significant impact on the overall robustness of the structure, and then analyzes the redundancy of the beam within a specific range of influence after the column is removed, and strengthens the performance of the low redundancy beam. To achieve the purpose of improving the overall robustness of the structure.
Its main conclusions are as follows:
The component importance index proposed in this paper is combined with the impact of component failure on the bearing capacity and supporting area of the structure, and Pushover analysis is carried out on the structure using the method of removing components. Through the final data analysis, it is concluded that corner columns have a more significant impact on the structure’s bearing capacity on the same floor, but because of the small vertical load, they bear, their importance to the overall structure is low. Although the inner column has less influence on the structure’s bearing capacity than other columns, it is more critical to the whole member because of its more enormous vertical load.
The structural vulnerability coefficient reflected by the change of structural strain energy can effectively avoid complex structural and mechanical changes and is more straightforward in physical meaning and calculation methods. Remove columns on different floors at the exact location; and the larger the number of floors, the less vulnerable the structure is. The removal of columns at different positions on the same floor makes the whole system more vulnerable because more local components are affected by the inner columns.
When a component with greater importance fails, its overall structure is not necessarily more vulnerable. For example, column 1B-3 in the layer has a more significant component importance coefficient but a lower structural vulnerability coefficient when it fails. Therefore, the structural vulnerability coefficient is combined with the component importance coefficient to evaluate the system’s robustness. From the two dimensions of the component and the whole structure, the robustness of the structure can be more accurately evaluated after the failure of the component.
Analyze the redundancy of beams affected by the failure column, find out the beams with low redundancy and strengthen them, improve the overall robustness of the structure, and reduce the importance of components that have a more significant impact on the robustness of the structure to a certain extent. It is more economical, which provides a particular reference for the robust design of the structure.
It should be noted that the robustness evaluation and promotion method of RC frame structure used in this paper does not consider the impact of non-load-bearing components such as plates on the overall robustness of the structure, and the applicability of other frame structures needs to be verified. Therefore, this paper will consider the following points to carry out further research:
Considering non-load-bearing structures such as plates and walls in RC frame structures, this paper proposes research on robustness evaluation and lifting methods.
Apply the method proposed in this paper to a higher-level reinforced concrete frame structure.
The robustness evaluation and performance improvement method proposed in this paper mainly aims at the reinforced concrete frame structure and verifies the applicability of other structures.
Disclosure statement
No potential conflict of interest was reported by the author(s).
References
- Beijing Golden Civil Engineering Software Technology Co., Ltd, China Architectural Standards Design and Research Institute. 2006. SAP2000 Chinese Version User Guide [M]. Beijing: China Communications Press, 460–464.
- Cao, X. Y., F. De Cheng, and B. Michael. 2023. “Consistent Seismic Hazard and Fragility Analysis Considering Combined Capacity-Demand Uncertainties via Probability Density Evolution Method.” Structural Safety 103:103. https://doi.org/10.1016/j.strusafe.2023.102330.
- Cao, X. Y., F. De-Cheng, and L. Yue. 2023. “Assessment of Various Seismic Fragility Analysis Approaches for Structures Excited by Non-Stationary Stochastic Ground Motions.” Mechanical Systems and Signal Processing 186:186. https://doi.org/10.1016/j.ymssp.2022.109838.
- Cao, X. Y., X. C. Zhuo, F. De Cheng, and W. Gang. 2022. “Dynamic and Probabilistic Seismic Performance Assessment of Precast Prestressed Reinforced Concrete Frames Incorporating Slab Influence Through Three-Dimensional Spatial Model.” Bulletin of Earthquake Engineering 20 (12): 6705–6739. https://doi.org/10.1007/s10518-022-01455-3.
- Chengmao, L., and L. Xila. 2004. “Research on Comprehensive Evaluation Method of Structural Safety.” Sichuan Building Science, (4): 46–48+58.
- Dagang, L., S. Pengyan, C. Shuangshuang, and Minxiong, W. 2011. “Structural Robustness, and Its Assessment Indicators.” Journal of Building Structures 32 (11): 44.
- De-Cheng, F., C. Xu-Yang, W. Ding, and W. Gang. 2023. “A PDEM-Based Non-Parametric Seismic Fragility Assessment Method for RC Structures Under Non-Stationary Ground Motions.” Journal of Building Engineering 63:63(PA. https://doi.org/10.1016/j.jobe.2022.105465.
- De-Cheng, F., C. Xu-Yang, and B. Michael. 2022. “An Enhanced PDEM-Based Framework for Reliability Analysis of Structures Considering Multiple Failure Modes and Limit States.” Probabilistic Engineering Mechanics 70:103367. https://doi.org/10.1016/j.probengmech.2022.103367.
- Deng, L. 2011. Mechanical Performance Analysis of School Buildings in the View of Robustness [D]. Hunan Province, China: Hunan University.
- Gang, Y. 2009. Structural Vulnerability Analysis and Its Application on Bridge Health Monitoring[d]. Shanghai Municipality,China: Shanghai Tongji University.
- GB 50153-2008 Unified Standard for Reliability Design of Engineering Structures [S]. 2009. Beijing: China Architecture & Building Press.
- Husain, M., and P. Tsopelas. 2004. “Measures of Structural Redundancy in Reinforced Concrete Buildings. I: Redundancy Indices.” Journal of Structural Engineering 130 (11): 1651–1658. https://doi.org/10.1061/(ASCE)0733-9445(2004)130:11(1651).
- Jizhuo, H., and W. Zhan. 2012. “An Approach for Evaluation of the Structural Robustness of Steel Frames.” China Civil Engineering Journal 45 (9): 46–54.
- Liangkun, W., N. Satish, S. Weixing, and Y. Zhou. 2022. “Seismic Performance Improvement of Base-Isolated Structures Using a Semi-Active Tuned Mass Damper.” Engineering Structures 271:271. https://doi.org/10.1016/j.engstruct.2022.114963.
- Liangkun, W., N. Satish, Z. Ying, and W. Shi. 2023. “Experimental Study on Adaptive-Passive Tuned Mass Damper with Variable Stiffness for Vertical Human-Induced Vibration Control.” Engineering Structures 280:280. https://doi.org/10.1016/j.engstruct.2023.115714.
- Liangkun, W., S. Weixing, L. Xiaowei, Q. Zhang, and Y. Zhou. 2019. “An Adaptive‐Passive Retuning Device for a Pendulum Tuned Mass Damper Considering Mass Uncertainty and Optimum Frequency.” Structural Control and Health Monitoring 26 (7): e2377. https://doi.org/10.1002/stc.2377.
- Liangkun, W., S. Weixing Ying, Z. 2019. “Study on Self‐Adjustable Variable Pendulum Tuned Mass Damper.” The Structural Design of Tall & Special Buildings 28 (1): e1561. https://doi.org/10.1002/tal.1561
- Liangkun, W., S. Weixing, and Z. Ying. 2022. “Adaptive-Passive Tuned Mass Damper for Structural Aseismic Protection Including Soil–Structure Interaction.” Soil Dynamics and Earthquake Engineering 158:158. https://doi.org/10.1016/j.soildyn.2022.107298.
- Liangkun, W., S. Weixing Zhou, Y., and Zhang, Q. 2020. “Semi-Active Eddy Current Pendulum Tuned Mass Damper with Variable Frequency and Damping.” Smart Structures and Systems 25 (1).
- Liangkun, W., Z. Ying, and S. Weixing. 2023. “Seismic Control of a Smart Structure with Semiactive Tuned Mass Damper and Adaptive Stiffness Property.” Earthquake Engineering and Resilience 2 (1): 74–93. https://doi.org/10.1002/eer2.38.
- Liang, H., and L. Long. 2012. “A Quantification Method of Structural Robustness.” Engineering Mechanics 29 (8): 213–219.
- Lieping, Y., L. Xuchuan, Q. Zhe., Qu, C., Lu, Z., and Pan, P. 2010. “Evaluation Method of Element Importance of Structural System Based on Generalized Structural Stiffness.” Journal of Architecture and Civil Engineering 27 (1): 1–6.
- Nanhai, Z., and L. Jieming. 2021. “A Method for the Enhancement Structural Seismic Capability Based on Redundancy and Vulnerability.” Chinese Journal of Computational Mechanics 5:604–611.
- Progressive Collapse Analysis and Design Guidelines for New Federal Office Buildings and Major Modernization Projects [S]. 2012. Washington: General Service Administration.
- Ren, W. X., and Q. W. Jin. 2018. “Structural Robustness, Redundancy, and Vulnerability.” Journal of Harbin Institute of Technology 50 (9): 1–10.
- The Standing Committee on Structural Safety (SCOSS). 1994. 10th Report of SCOSS [R]. London: SETO Ltd.
- Wang, L., S. Nagarajaiah, W. Shi, and Y. Zhou. 2020. “Study on Adaptive-Passive Eddy Current Pendulum Tuned Mass Damper for Wind-Induced Vibration Control.” The Structural Design of Tall & Special Buildings 29 (15): e1793. https://doi.org/10.1002/tal.1793.
- Wang, L., W. Shi, Q. Zhang, and Y. Zhou. 2020. “Study on Adaptive-Passive Multiple Tuned Mass Damper with Variable Mass for a Large-Span Floor Structure.” Engineering Structures 209:209. https://doi.org/10.1016/j.engstruct.2019.110010.
- Weiqing, L., S. Lilai, and Jun, C. 2018. “Structure Redundancy Analysis Based on Strain Energy.” Earthquake Resistant Engineering and Retrofitting 40 (6): 107–112+118.
- Yang, G., and L. Xila. 2008. “Importance Coefficients of Components in Evaluation of Structure Robustness.” Chinese Journal of Rock Mechanics & Engineering 27 (12): 2575–2584.
- Yongliang, C., H. Liang, Y. Hongwei, and Dongsheng, H. 2014. “Robustness Analysis of RC Frame with Latticed-Frame Column.” Engineering Mechanics 31 (7): 129–136,155.
- Zhangxin, F., and L. Huiqiang. 2007. “Energy-Based Approach to Structural Robustness.” Journal of Southwest Jiaotong University 15 (4): 319.
- Zhaoxin, F. 2008. Analysis and Realization of Structural Robustness in the Light of Energy-Absorption of Structures [D]. Wuhan, Hubei Province, China: Wuhan, Huazhong University of Science and Technology.
- Zhao Xin, F., and L. Huiqiang. 2007. “Structural Robustness, and Risk Mitigation.” Engineering Mechanics 24 (I): 79–082.