
 ?Mathematical formulae have been encoded as MathML and are displayed in this HTML version using MathJax in order to improve their display. Uncheck the box to turn MathJax off. This feature requires Javascript. Click on a formula to zoom.
ABSTRACT
Most of the electrical equipment responsible for the control within a power plant is configured in cabinet form and fixed using post-installed anchors. Shaking table testing to evaluate the seismic performance of cabinets does not simulate the same installation conditions as on-site, but simply welds the bottom of the cabinet to the top surface of the shake table to assess the structural integrity. The seismic performance evaluation of post-installed anchors is typically conducted indirectly through material testing, making it necessary to compare the performance under on-site conditions to ensure reasonable measurement. This study fabricated a structure as a replacement for the cabinet, fixed it using post-installed anchors, and applied static loads to measure the pull-out load transmitted to the anchors. The measured results were then compared with those obtained from material testing. Consequentially, the pull-out load in the test reflecting on-site conditions was approximately 10% higher than in the material test. So the current way of indirectly evaluating the performance of post-installed anchors is deemed reasonable based on the derived results. To validate the reliability of the experimental study, a numerical study was conducted, and the results showed an error range of around 1%, indicating reasonable and consistent findings.
1. Introduction
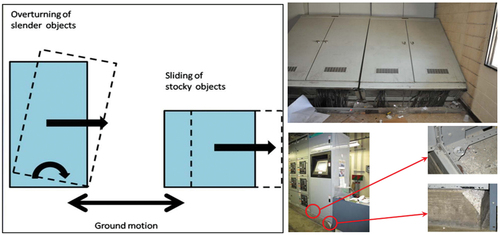
An electrical cabinet is a metal box with various devices that convert high-pressure electricity generated by a power plant into the power within other facilities, many of which are one of the key elements in the facility operated by electrical devices (Eem et al. Citation2019). In general, in the case of electric cabinets installed in most facilities except for nuclear power facilities, a channel fixed to a concrete slab with post-installed anchors and a bottom plate of the cabinet are fixing the connecting bolts (Lee and Jung Citation2022). In this method, when an earthquake occurs, the inertial force of the earthquake motion can have a great effect on the lower anchor due to factors such as weight, height, and shape of the cabinet. According to FEMA E-74 (FEMA E-74 Citation2019), which provides guidelines for reducing the risks of nonstructural earthquake damage, the most commonly reported type of damage to nonstructural elements such as cabinets is the overturning and sliding damage shown in . This type of damage occurs as a result of anchor breakage or failure during seismic motion (Wang et al. Citation2023). The importance of post-installed anchors used in support systems can be recognized as a crucial element in constructing cabinets.
Figure 1. Overturning and sliding of the cabinet due to inertial forces.
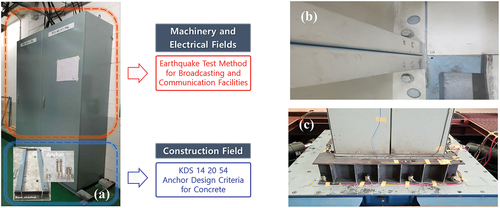
Meanwhile, the only seismic performance evaluation method for electrical cabinets in Korea is the shaking table test method according to the “Earthquake Test Method for Broadcasting and Communication Facilities” enacted in 2009, shown in (So Citation2020). In the case of installing cabinets in actual field conditions, it is common to use post-installed anchors to secure the underside of the cabinets to a concrete foundation, as shown in . However, in the mechanical and electrical field, only the structural and functional integrity of the cabinet body is evaluated, so as shown in , the lower installation conditions are not considered the same as those in the field, but welded to the upper part of the bench and integrated (Di Sarno et al. Citation2019). When conducting seismic performance evaluations for post-installed anchors due to specific requirements, the performance of the post-installed anchors installed in actual structures cannot be accurately determined (Wang et al. Citation2022). This is because it is indirectly evaluated through general material tests.
Figure 2. (a) seismic performance criteria for cabinets by field, (b) view of actual site installation, and (c) lower welded appearance in seismic performance evaluation.
In the current construction field, the typical material testing for anchors is limited to uniaxial monotonic tests for shear and pull-out loads. Therefore, the load transfer characteristics of an electrical cabinet fixed with anchors may not be adequately reflected in these tests (Kim and Jung Citation2019; Kim et al. Citation2013). Therefore, it is necessary to compare the load transferred to the anchors in their installed state in actual structures with the anchor loads obtained from typical material tests. In this study, based on a review of existing research and literature, the focus was placed on investigating M12 post-installed anchors commonly used in cabinet anchorage systems. Post-installed anchors are used to connect various components to concrete structures, and during seismic events, periodic cracking occurs (Wang, Zhou, and Shi Citation2023). When it comes to anchor performance in concrete, it is crucial to consider the presence of nominal cracking. Cracks in concrete can have a significant impact on the behavior and load-carrying capacity of anchors (Eligehausen, Mallée, and Silva Citation2006; Fuchs, Eligehausen, and Breen Citation1995). Some key points to keep in mind include:
·Reduction in load capacity: Cracks in concrete can lead to stress concentration around the anchor, which reduces the load-carrying capacity. The crack width and pattern are critical factors in assessing the degree of reduction in the anchor’s capacity.
·Anchoring depth: The presence of cracks affects the effective anchoring depth, meaning the anchor may not develop its full resistance over the reduced embedment length. As a result, the pull-out and shear resistance of the anchor might be compromised.
·Anchor type and design considerations: The choice of anchor type and design should take into account the potential for nominal cracking in the concrete. In some cases, resin-based or mechanical anchors specifically designed for cracked concrete might be necessary.
Post-installed anchors play a critical role in connecting various components to concrete structures. However, during seismic events, the occurrence of periodic cracking in concrete can significantly influence anchor performance. Experimental methods for post-installed anchors in cracked concrete must necessarily consider the aspects mentioned above (Wang et al. Citation2023).
In this study, an innovative experimental approach was devised to validate the performance of the post-installed anchors (Trautner et al. Citation2017). Instead of directly applying axial loads to the anchors, this method involves simulating on-site conditions by subjecting axial loads to the upper part of the structure connected to the anchors. With this approach, it is possible to reproduce the actual load-carrying behavior and efficiently measure the anchor’s response under operating loads (Faraone et al. Citation2019, Citation2022; Trautner et al. Citation2016). The main objective of this research is to compare the load transmitted to the anchors under the devised test conditions with the load measured using standard material tests. By conducting this comparison, which aim to identify any performance differences among the anchors and gain insights into their failure modes and load behavior. The findings from this study will contribute to meaningful research in understanding anchor performance variations and provide valuable guidance for practical applications.
2. Test program
2.1. Preceding material testing
The seismic regulations for electrical cabinet facilities for power generation in Korea are based on the Korean Building Code (KBC), a building design standard enacted in 2009 with reference to ASCE 7–10. The KBC serves as a commonly applied architectural design standard for achieving seismic performance targets in various facilities (Hwang, Lee, and Kim Citation2015). However, the current review of the seismic performance of post-installed anchors for on-site installation is deemed insufficient, necessitating the partial adoption of foreign standards such as ACI (American Concrete Institute) or EOTA (European Organization for Technical Approvals).
In the case of the seismic performance evaluation of post-installed anchors of the criteria mentioned in the previous sentence, a dynamic load protocol is calculated and a seismic qualification test is performed to repeatedly apply the load using it. A reference load is required to calculate the dynamic load protocol, and this reference load is determined through a preceding material testing. It is difficult to evaluate the seismic performance of post-installed anchors when they are installed in the actual structure. Therefore, in order to assess the seismic performance, static performance experiments are necessary, where the reference load is compared and verified in the experimental study conducted in this paper.
2.1.1. Test method and contents
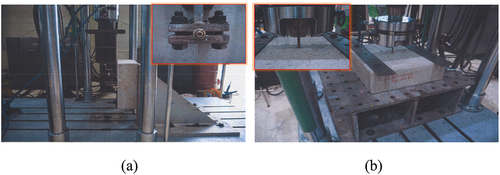
In the case of concrete specimens into which anchors are inserted, the design standard strength (fck) was set to 21 MPa with reference to construction documents and blueprints held with the cooperation of Daecheong Hydroelectric Power Plant. The concrete specimen size was determined to be 500 × 500 × 200 mm3 considering the effective radius of cone destruction (R150) due to anchor embedding and UTM installation conditions. The purpose of the experimental study, it is to measure the reference load of the dynamic load protocol used for the seismic performance evaluation of post-installed anchors. Accordingly, the embedding conditions of anchors to consider the failure due to cracks in concrete during an earthquake specified in the ACI and EOTA standards must be considered. Therefore 10 specimens with a crack width of 0.5 mm required by the standards were manufactured. As a static performance test to find out reference load, a method of applying a displacement load directly to the anchor was used as shown in using 1,000 kN UTM according to the ASTM standard (ASTM E Citation2003). The continuous load method (T-01) was used to obtain load-displacement data for the entire behavior of the anchor until it failed (Seo Citation2018).
Figure 3. Setup for performance evaluation of static loading: (a) shear and (b) pull-out.
2.1.2. Preceding material testing results
The failure mode of the static shear performance test is as shown in , the failure of the concrete-anchor bond rather than the failure of the steel of the anchor was shown. The failure mode of the static pull-out performance test showed concrete cone failure due to the adhesive force between concrete and anchor. As shown in , the maximum shear load for each specimen measured through the static performance test was measured within the range of 23 ~ 25 kN, and the average value was calculated as 24.07 KN by averaging the remaining three values except for the maximum and minimum values. The nominal strength of the anchor under the shear load shall be calculated according to the following equation based on the material properties and dimensions of the anchor.
Figure 4. Static performance test failure mode: (a) shear and (b) pull-out.
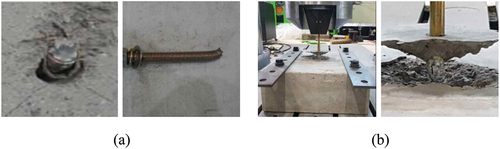
Figure 5. Typical load-displacement curves and maximum loads for each test: (a) shear and (b) pull-out.
Where, n is the number of anchors in the anchor group, is the effective cross-sectional area of a single anchor for the shear, and
should take the smaller value of 1.9
or 860MPa.
The maximum pull-out load was measured within the range of 26 ~ 30 kN, and the average value to be compared with the experimental results reflecting the on-site installation conditions was calculated as 28.09 kN. In the failure mode of the tensile test, concrete failure occurred, and the concrete failure strength of anchor bolts under tension load in cracked concrete is decided the value of the following equation.
Where, in the case of the pre-installed anchor, the factor is 10, and the post-installed anchor is applied with 7. For the
value of the post-installed anchor, a value of 7 or more can be used based on the product characteristic test according to ACI 355.2, but it cannot exceed 10.
2.2. Experimental study reflective of on-site installation conditions
In general, most of the mechanical and electrical equipment required for power plant operation is in the form of a cabinet, and is installed in a bolt connection method between the slab and the fixed channel with the cabinet floor and post-installed anchors. Since the seismic performance assessment of the anchorage system mentioned in this paper is evaluated for the anchor’s original mechanical performance, there may be insufficient parts reflecting the actual site conditions. It is reasonable to conduct a performance test of the post-installed anchor reflecting the on-site installation conditions mentioned in the previous sentence using an actual cabinet. However, it was difficult to conduct the test due to economic and spatial constraints, so a static performance test was performed by replacing the specimen consist of a steel column and support as shown in .
Figure 6. Specifications and composition of alternative test specimen.
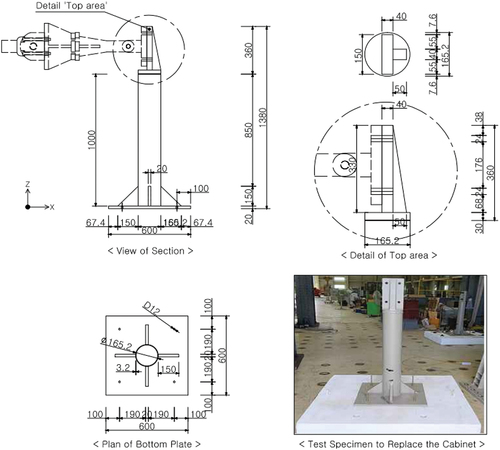
2.2.1. Specimen specifications and test method
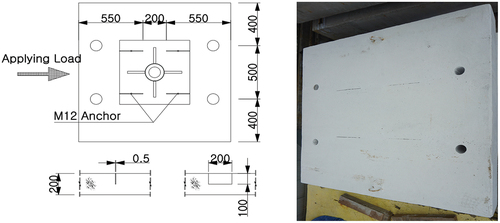
Using general structural steel (SS400), a steel column with a thickness of 3.2t and a test jig were manufactured based on the design drawing in . In the case of the concrete slab, it was manufactured with the same design standard strength as in the pre-material testing. The size of the specimen was 1,300 × 1,300 × 200 mm3 based on the design drawing in in consideration of the effective radius of cone fracture and UTM installation conditions presented in the ASTM standard. For comparison with the preceding material test, the same crack was created by inserting a steel plate with a length of 200 mm, a depth of 100 mm, and a width of 0.5 mm at the top during casting. It was applied at a load speed of 2 mm per minute using a UTM with a capacity of 200 kN (Yoo et al. Citation2006).
Figure 7. Design drawings of cracked concrete specimens.
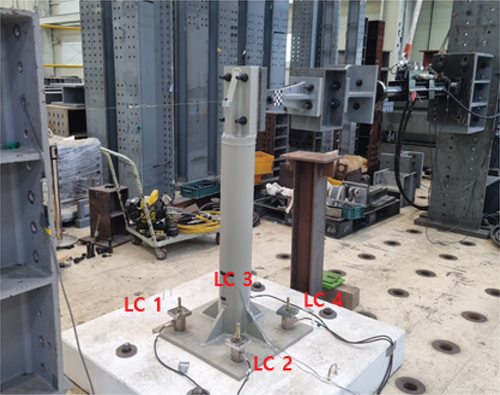
A LVDT displacement meter was installed parallel to the upper part of the specimen to measure the displacement generated by the applied load. In order to check whether plastic deformation of the column occurs, uniaxial strain gages were attached to the lower part of the steel column before and after the load application direction. And, in order to compare with the preceding material test results, a ring type load cell capable of measuring a transfer load of 100 kN was installed on each of the post-installed 4 anchors set up on the concrete slab. The pulling strength of the anchor was measured using a hydraulic pulling jack and a server capable of controlling the load, and the measured data were recorded and stored using a data logger. illustrates the overall installation and configuration of the test specimen, providing an easy-to-understand comparison of the tensile and compressive loads transmitted to the post-installed anchors based on the applied load capacities. To enhance clarity, load cell numbering has been incorporated in the figure.
Figure 8. Overall installation view of the test specimen.
2.2.2. Analysis of test results
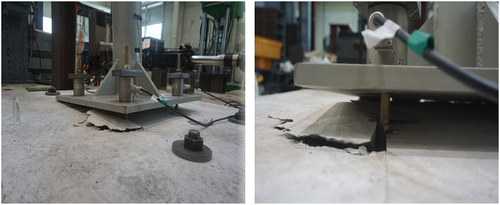
After reflecting the site installation conditions, the failure mode of the static load test of the post-installed anchor showed concrete cone failure due to the concrete-anchor coupling, not the steel failure of the anchor, as shown in . The observed mode of failure is not the pull-out failure, which occurs when the anchor and concrete interface lacks sufficient bonding, but rather a mode where the anchor and concrete are adequately bonded, allowing the anchor’s bearing capacity to be realized.
Figure 9. Failure type after the static loading test end.
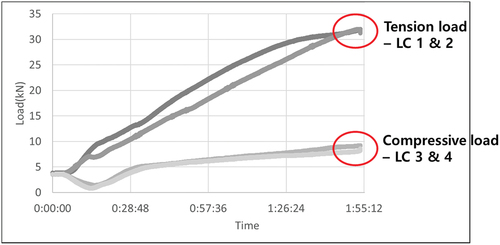
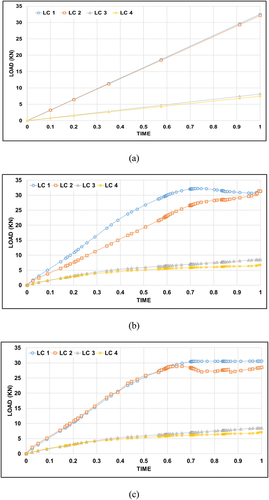
The maximum pull-out load for each test was measured within the range of 29 to 32 kN, and the average load was 30.90 kN as shown in , which was about 10% different from the results of Preceding material testing. These results are expected to improve pull-out performance due to the fastening force between the anchor and the bolt. As shown in , the load trend for the pull-out test in the preceding test shows that the anchor’s maximum performance is initially expressed and decreases over time. On the other hand, in the case of the pull-out test reflecting the on-site installation conditions, the stiffness initially increased linearly as shown in , and the maximum performance was expressed at the time of concrete failure.
Figure 10. Simulated static loading test results and typical load-displacement curves.
Figure 11. The tendency of tension and compressive load of post-installed anchor reflecting on-site installation conditions.
In the case of the shear load generated in the anchor, it was investigated that there is no equipment in Korea that can measure the transfer load for the anchor installed in the structure, as in the experimental method of this study, so it could not be measured inevitably (Yun et al. Citation2019). Currently, the approach through analytical research is the only one, and it is considered that additional research on experimental methods that can measure shear load will be needed in the future.
3. Analytical methods for numerical model development
3.1. FEA model configuration
To verify the reliability of the experimental method devised in this study, an analytical study using ABAQUS, a general-purpose structural analysis program, was approached. The primary purpose of using the ABAQUS analysis program is due to its powerful capabilities in providing more clear and reliable calculations of the interactions between different materials’ interfaces compared to other analysis programs. It offers advanced tools and functionalities that enable accurate simulations of complex behaviors at material interfaces, ensuring more robust and accurate results for various engineering applications.
The configuration of FE modeling consists of steel columns, upper jig, lower stiffener, and base plate as solid elements (8-node solid element, C3D8R) using three-degree 8 points and minimum integration points, as shown in . In addition, the post-installed anchor that fixes the specimen and concrete was also implemented as a 3D solid element. The contact surface between the lower steel plate and the upper surface of the concrete was set to the interface under the same conditions as the test by using the interaction module (Hur Citation2012), which is a function that can interact with the analysis program, to generate a sliding effect between materials with different properties as shown in . The contact surface between the
Figure 12. Various perspectives of specimen FE model.
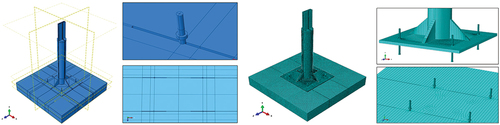
Figure 13. Numerical simulation boundary conditions for interfaces of different materials.
anchor and concrete was modeled as a rigid contact (hard contact), and the tangential direction was modeled by considering the friction coefficient. The column was modeled by referring to the design drawing in , and the concrete slab was modeled by referring to the cracked concrete specifications in . In order to verify the reliability of the experimental results through an analytical method, it was modeled with a post-installed anchor of the same diameter and compared with the pull-out load of the static performance test.
3.2. Nonlinear material model
In the static performance test, anchor failure did not occur until concrete failure, but it is difficult to determine whether concrete failure occurred within the elastic region because a separate instrument for measuring the yield point could not be directly installed on the anchor due to the test conditions. Therefore, through the graph in for the M12 post-installed anchor prepared through previous studies, the elastic and plastic sections were considered and applied to the analysis (Kim et al. Citation2013). Using stress-strain curve material properties allows for accurate modeling of the anchor’s behavior in simulations, considering nonlinear responses and plastic deformation under various loads and loading histories. By incorporating these material properties, the simulation can capture the anchor’s realistic mechanical response, accounting for yielding and strain hardening effects accurately. This level of modeling precision enables a more comprehensive understanding of how the anchor will behave under different loading conditions and helps ensure a reliable and realistic representation of its performance in the analysis.
Figure 14. Stress-strain curve material properties for the anchor.
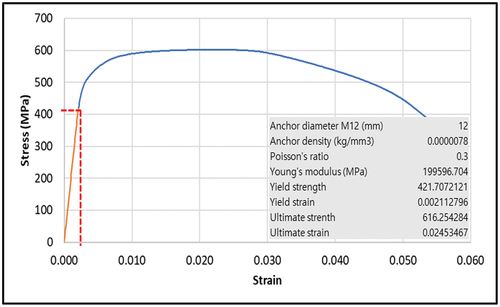
Since the cross-sectional area of the specimen decreases as the anchor specimen stretches when the zero load is applied, it is most accurate to determine the elastic and plastic sections through the strain curve with the true stress, which is the stress obtained by reflecting the actual cross-sectional shrinkage (Kim Citation2001). However, it was not possible to measure the reduced cross section due to experimental limitations, so a nonlinear configuration model for the anchor was determined through the nominal stress considering the initial cross section. Accordingly, the modulus of elasticity applied to the anchor was determined to be 199,596.7 MPa, and the yield strength and strain were determined to be 412.7 MPa and 0.0021, respectively, and a nonlinear constitutive model was performed.
Concrete is a composite material that exhibits anisotropic and nonlinear behavior, requiring the application of material models to capture these characteristics. For concrete properties, the concrete damaged plasticity (CDP) was used, which is commonly used in the ABAQUS analysis. This model can simultaneously consider compression failure and tensile cracking as shown in , and it is available in ABAQUS Ver. 6.20. The CDP model presented by ABAQUS can describe concrete behavior in uniaxial tensile and compressive stress, and was first presented by Lubliner et al. (Citation1989) and introduced into the program by modifying the model formula by Lee and Fevans (1998) (Lubliner et al. Citation1989). In the case of concrete deformation, many
Figure 15. Response of concrete to a uniaxial loading condition: (a) compression behavior and (b) tension behavior.
studies and papers have proposed many stress-strain relationships from compressive strength. In this study, the stress-strain relationship of concrete was defined using the EC2 model.
3.3. Linear material model and loading conditions
shows the commonly used properties of steel for steel columns, considered by elastic behaviour, and the properties of concrete materials in the elastic section. The modulus of elasticity of concrete used in the analysis was calculated and applied according to the following Equation (3) – (6), since it was manufactured using normal aggregate during casting.
Table 1. Steel and concrete properties in the elastic region.
Where, when the specified design strength (fck) is included in the ranges of EquationEquations (3)(3)
(3) and (Equation4
(4)
(4) ), linear interpolation is used. In the case of load conditions, the maximum displacement value of 50.0 mm measured in the pull-out test of M12 anchor cracked concrete in the static performance test was applied as a displacement load to the plane corresponding to the X direction of the upper jig under the same conditions as in the test.
3.4. Boundary condition parameter study
In a previous study on the seismic performance evaluation of electric cabinets using the shaking table test, it was found that the impact load was generated in the lower part due to the seismic motion, and the load transmitted to the post-installed anchor was not accurately measured (Chung, Hong, and Cho Citation2020). Therefore, the reliability of the static performance test method devised in this paper was reviewed through an analytical method, and parameter analysis of boundary conditions was performed to predict the load transmitted to the anchor through a shaking table test. The focus of the parameter study conducted in this analysis is to find a boundary condition that is closest to the anchor’s transfer load value measured in the test and converges well during the numerical analysis. Accordingly, as summarized in , the load transmitted to the anchor was compared by classifying it into simplified analysis and detailed analysis according to the presence or absence of anchor modeling.
Table 2. Boundary condition parameter study to gain the anchor load.
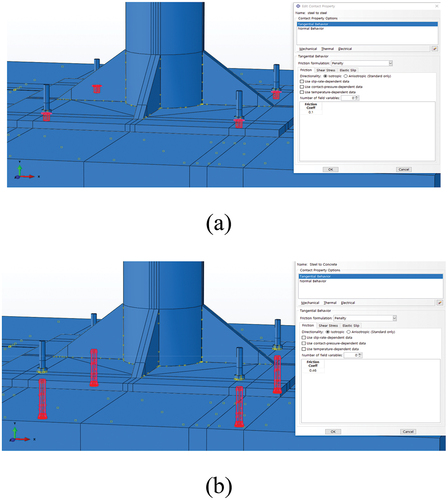
In simplified analysis case 1 did not model the anchor, but created a reference point by connecting nodes around the area to which the anchor is applied, and measured the reaction force at that point. In detailed analysis case 2, the anchor was modeled and set to behave integrally using the Tie function for the surface in contact with the anchor. Then, the pull-out load was measured by checking the Y direction body force of the anchor. Detailed analysis case 3 also modeled the anchor and used the Contact function for the surface in contact with the anchor to set the analysis between different materials. And the pull-out load was measured in the same way as in case 2. The contact condition applied to case 3 was applied as shown in by referring to the previous analysis boundary condition research (Chowdhury et al. Citation2014). The contact area between the anchor and the nut was moved integrally using the Tie function. In addition, referring to previous studies, the interface of the lower plate in contact with the nut was set to a friction coefficient of 0.1 as steel materials were in contact with each other. And, the friction coefficient of 0.46 was applied to the concrete interface in contact with the anchor because steel and concrete are in contact (Salman, Tran, and Kim Citation2020).
Figure 16. Friction coefficient of the contact for each material: (a) steel to steel and (b) steel to concrete.
3.5. Analytical study results and anchor boundary condition proposal
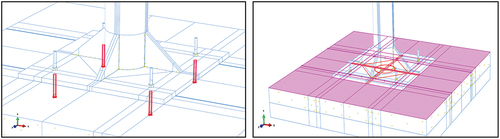
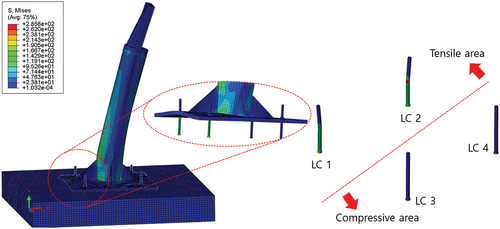
shows the state of the anchor in the concrete tension and compression areas of cases 2 and 3, which modeled anchors among the three finite element models presented in this study. Result of numerical analysis as well, it can be seen that the same deformation occurred in the anchors (LC 1 and 2) corresponding to the tensile area during the test.
Figure 17. Deformation of an anchor embedded in concrete with displacement load.
summarizes the results for each case according to the boundary conditions of the analysis model. It was analyzed that the nodal rigid tying method (case 1) had a good load transmission and linearly increased the load transmitted to the anchor (). In cases 2 and 3, which were modeled on anchors and concrete in the same way as the actual test, the load tendency transmitted to the anchor was similar to the test results, as shown in . The difference between the two models is whether the contact conditions for the anchor and concrete interface are reflected similarly to reality. It can be seen that the analysis was reasonably conducted by comparing the results from the case 3, which reflected contact conditions, with the test (refer to ).
Figure 18. The results of the compression and tensile loads of the post-installed anchors in each case: (a) case 1, (b) case 2 and (c) case 3.
The criterion for determining the pull-out load of the anchor in the case 1 to which the simplified analysis was applied was determined by measuring the maximum vertical reaction force generated at the reference point simulating the anchor. In cases 2 and 3 where detailed analysis was applied, when the tensile strength of the concrete part where the anchor was installed reached yield due to the displacement load applied to the upper column, the vertical force on the anchor installed at the corresponding point was measured. The yield tensile strength(fr) of the concrete was calculated in accordance with EquationEquation (7)(7)
(7) below and referenced.
Where, the coefficient of the light concrete factor is 1.0 for normal weight concrete, 0.85 for sand light weight concrete and 0.75 for all light weight concrete.
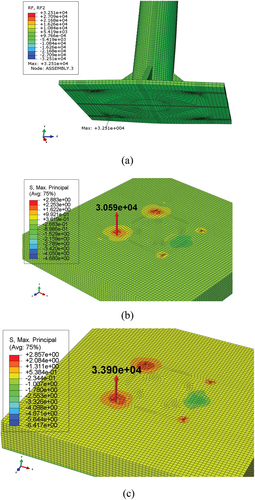
The pull-out load of the anchor applying the case 1 boundary condition was measured to be 32.51 kN, showing a difference of about 5% compared to the pull-out load of 30.90 kN measured in the experimental study of this paper (). When the Case 2 boundary condition was applied, it was measured at 33.90 kN, showing a difference of approximately 9% of the test result (). In case 3, the tension load of the anchor was 30.59 kN, which shows a difference of about 1% from the nearest test result ().
Figure 19. Comparison of maximum pull-out load of anchors according to boundary conditions: (a) case 1, (b) case 2 and (c) case 3.
Since the boundary condition method in cases 1 and 2 was performed assuming that the anchor was integrated with the concrete, it seems that the margin of error with the test results was large as a result. The case 3, which considered the friction between the anchor and the concrete similar to the actual installation conditions, showed the smallest error range of the test results, so it is judged that a reasonable analysis was performed. It was confirmed that the error range from the test results was reduced when the definition of the boundary condition was applied from an easy method based on simplified analysis to a complicated method based on detailed analysis. However, it can be seen that the difference in the results obtained by the three methods is not significant.
4. Conclusion
In this paper, a static performance test reflecting on-site installation conditions was conducted for M12 post-installed anchors used in the anchorage system of electrical cabinets for power generation, and the anchor performance was compared with general material tests. In addition, the reliability of the experimental study was verified through an analytical research approach following the development of a numerical analysis model. It is intended to provide reference load information that can predict the dynamic behavior characteristics of post-installed anchors during shaking table tests for evaluating the seismic performance of electric cabinets in the future. Accordingly, the conclusion of this paper is as follows.
Based on the experimental method employed in this study, it was observed that there was approximately a 10% difference in the tensile strength compared to standard material tests. This discrepancy can be attributed to the installation conditions of the post-installed anchors, which are fastened to the structure. It suggests that the load applied to the structure has a distinct effect on the anchors’ behavior rather than a direct application of load solely to the anchor. The analysis indicates that the performance of the anchor installed within the structure surpasses the performance measured through general material testing. This finding justifies the current practice of indirectly evaluating the performance of post-installed anchors based on the derived results, as it better represents the actual behavior of the anchor under on-site conditions when installed in a structure.
To validate the reliability of the experimental method, 3D finite element (FE) modeling was conducted for the same structure and post-installed anchor as used in the physical tests. The modeling process yielded reasonable results, with an error range of approximately 1%. Notably, as the modeling approach aligned more closely with the actual installation conditions mentioned in the paper, the error range with the test results reduced significantly. However, it is important to note that the actual analysis involved incorporating a complex mechanism in the modeling, which led to a longer time required to achieve convergence. Despite this computational challenge, the accuracy and convergence of the results were achieved, supporting the effectiveness of the chosen modeling approach.
In modeling other complex structures, the number of nodes and elements tends to increase significantly. Additionally, when contact surfaces between different materials are involved, the detailed analysis process may become time-consuming and prone to errors while trying to meet convergence conditions. Given the findings and analytical results discussed in Section 3.5 of the paper, it is recommended to utilize the case 1 boundary condition method for analysis. This approach offers a faster convergence time and a relatively simpler methodology compared to the detailed analysis.
Acknowledgements
This present work was supported by Basic Science Research Program through the National Research Foundation of Korea (NRF) funded by the Ministry of Education (2021R1A6A1A03044326 and 2022R1A6A3A01086071).
Disclosure statement
No potential conflict of interest was reported by the author(s).
Additional information
Funding
Notes on contributors
Sang-Moon Lee
Sang-Moon Lee, Ph.D., Research professor, Institute for Smart Infrastructure, Gangneung-Wonju National University, Gangneung-Si, Gangwon-Do, Republic of Korea. Research fields: Seismic, Finite Element Analysis, Natural Hazards, Reinforced Concrete, Non-structural elements retrofit.
Il-Wha Lee
Il-Wha Lee, Ph.D., Senior Researcher, Advanced Infrastructure Research Team of Korea Railroad Research, Uiwang-Si, Gyeonggi-Do, Republic of Korea Research fields: Concrete track, Rayleigh wave, Embankment, SASW, Settlement, Rapid Hardening Track, Pavement Gravel.
Woo-Young Jung
Woo-Young Jung, Ph.D., Professor, Department of Civil and Environment Engineering, Gangneung-Wonju National University, Gangneung-Si, Gangwon-Do, Republic of Korea. Research fields: FRP, Wind fragility, High wind vulnerability, Monte Carlo, Nonlinear, Finite element analysis, Natural hazards, Reinforced concrete.
References
- ASTM E. 2003. Standard Test Methods for Strength of Anchors in Concrete and Masonry Elements, 488–496. West Conshohocken, PA, USA: ASTM International.
- Chowdhury, M. A., M. D. Nuruzzaman, M. Arefin Kowser, M. MostafizurRahman, K. B. Roy, S. Chakraborty, N. Mohammad, M. Aktaruzzaman, and N. Mohammad. 2014. “Sliding Friction of Steel Combinations.” The Open Mechanical Engineering Journal 8 (1): 364–369. https://doi.org/10.2174/1874155X01408010364.
- Chung, Y. H., K. J. Hong, and S. O. Cho. 2020. “Rocking Stiffness of Electrical Cabinet for In-Cabinet Response Spectrum.” Journal of the Earthquake Engineering Society of Korea 24 (2): 95–102. https://doi.org/10.5000/EESK.2020.24.2.095.
- Di Sarno, L., G. Magliulo, D. D’Angela, and E. Cosenza. 2019. “Experimental Assessment of the Seismic Performance of Hospital Cabinets Using Shake Table Testing.” Earthquake Engineering & Structural Dynamics 48 (1): 103–123. https://doi.org/10.1002/eqe.3127.
- Eem, S. H., B. G. Jeon, S. J. Jang, and I. K. Choi. 2019. “Evaluate the Characteristics of Vibration Caused by Rocking Modes of Electric Cabinet Under Seismic Loading.” Transactions of the Korean Society for Noise and Vibration Engineering 29 (6): 735–744. https://doi.org/10.5050/KSNVE.2019.29.6.735.
- Eligehausen, R., R. Mallée, and J. F. Silva. 2006. Anchorage in Concrete Construction. Vol. 10. Berlin, Germany: John Wiley & Sons.
- Faraone, G., T. C. Hutchinson, R. Piccinin, and J. Silva. 2019. “Performance of Post-Installed Anchors in a Progressively Damaged Concrete Shear Wall.” ACI Structural Journal 116 (6). https://doi.org/10.14359/51718069.
- Faraone, G., T. C. Hutchinson, R. Piccinin, and J. F. Silva. 2022. “Anchor Performance in Cyclically Loaded Shear Walls.” ACI Structural Journal 119 (6). https://doi.org/10.14359/51737174.
- FEMA E-74. 2019. “Reducing the Risks of Nonstructural Earthquake Damage”. Practical Guide, Washington DC, USA.
- Fuchs, W., R. Eligehausen, and J. E. Breen. 1995. “Concrete Capacity Design (CCD) Approach for Fastening to Concrete.” Structural Journal 92 (1): 73–94. https://doi.org/10.14359/1533.
- Hur, J. 2012. Seismic Performance Evaluation of Switchboard Cabinets Using Nonlinear Numerical Models. Atlanta, USA: Georgia Institute of Technology.
- Hwang, K. R., H. S. Lee, and S. J. Kim. 2015. “Evaluation of Seismic Load Level in Korea Based on Global Recorded Earthquake Ground Motions.” Journal of the Earthquake Engineering Society of Korea 19 (5): 247–256. https://doi.org/10.5000/EESK.2015.19.5.247.
- Kim, N. K. 2001. “Load Transfer of Tension and Compression Anchors in Weathered Soil.” Journal of the Korean Geotechnical Society 17 (3): 59–68.
- Kim, D. I., and W. Y. Jung. 2019. “Structural Performance of the Cast-In-Place Anchor in Cracked Concrete Used in Power Plant Facilities.” Journal of the Korea Institute for Structural Maintenance and Inspection 23 (7): 120–128. https://doi.org/10.11112/jksmi.2019.23.7.120.
- Kim, J. S., W. Y. Jung, M. H. Kwon, and B. S. Ju. 2013. “Performance Evaluation of the Post-Installed Anchor for Sign Structure in South Korea.” Construction and Building Materials 44:496–506. https://doi.org/10.1016/j.conbuildmat.2013.03.015.
- Kim, J. S., M. H. Kwon, H. S. Seo, and J. H. Park. 2013. “Performance Evaluation and Analysis Model for the Post-Installed Anchor.” Journal of Korean Society of Hazard Mitigation 13 (2): 89–95. https://doi.org/10.9798/kosham.2013.13.2.089.
- Lee, S. M., and W. Y. Jung. 2022. “A Study on the Load Characteristics of the Anchorage According to the Natural Frequency Change of the Electric Cabinet in a Power Plant.” Advances in Mechanical Engineering 14 (9): 1–11. https://doi.org/10.1177/16878132221123676.
- Lubliner, J., J. Oliver, S. Oller, and E. Oñate. 1989. “A Plastic-Damage Model for Concrete.” International Journal of Solids and Structures 25 (3): 299–326. https://doi.org/10.1016/0020-7683(89)90050-4.
- Salman, K., T. T. Tran, and D. Kim. 2020. “Seismic Capacity Evaluation of NPP Electrical Cabinet Facility Considering Grouping Effects.” Journal of Nuclear Science and Technology 57 (7): 800–812. https://doi.org/10.1080/00223131.2020.1724206.
- Seo, S. Y. 2018. “A Study on the Pull-Out Strength of Bond Type Anchors.” Journal of Korean Society of Steel Construction 30 (2): 105–114. https://doi.org/10.7781/kjoss.2018.30.2.105.
- So, W. B. 2020. “ICRS analysis and seismic performance evaluation of electrical double door cabinet in power plants.” Master’s thesis in Korea, Kyung Hee University.
- Trautner, C. A., T. Hutchinson, P. R. Grosser, and J. F. Silva. 2016. “Effects of Detailing on the Cyclic Behavior of Steel Baseplate Connections Designed to Promote Anchor Yielding.” Journal of Structural Engineering 142 (2): 04015117. https://doi.org/10.1061/(ASCE)ST.1943-541X.0001361.
- Trautner, C. A., T. Hutchinson, P. R. Grosser, and J. F. Silva. 2017. “Investigation of Steel Column–Baseplate Connection Details Incorporating Ductile Anchors.” Journal of Structural Engineering 143 (8): 04017074. https://doi.org/10.1061/(ASCE)ST.1943-541X.0001759.
- Wang, L., S. Nagarajaiah, W. Shi, and Y. Zhou. 2022. “Seismic Performance Improvement of Base-Isolated Structures Using a Semi-Active Tuned Mass Damper.” Engineering Structures 271:114963. https://doi.org/10.1016/j.engstruct.2022.114963.
- Wang, L., S. Nagarajaiah, Y. Zhou, and W. Shi. 2023. “Experimental Study on Adaptive-Passive Tuned Mass Damper with Variable Stiffness for Vertical Human-Induced Vibration Control.” Engineering Structures 280:115714. https://doi.org/10.1016/j.engstruct.2023.115714.
- Wang, L., Y. Zhou, S. Nagarajaiah, and W. Shi. 2023. “Bi-Directional Semi-Active Tuned Mass Damper for Torsional Asymmetric Structural Seismic Response Control.” Engineering Structures 294:116744. https://doi.org/10.1016/j.engstruct.2023.116744.
- Wang, L., Y. Zhou, and W. Shi. 2023. “Seismic Response Control of a Nonlinear Tall Building Under Mainshock-Aftershock Sequences Using Semi-Active Tuned Mass Damper.” International Journal of Structural Stability and Dynamics. https://doi.org/10.1142/S0219455423400278.
- Yoo, S. W., S. H. Jung, K. S. Kwak, and J. H. Lee. 2006. “Experimental Study on Pull Out Characteristics of Adhesive Anchor.” KSCE Journal of Civil Engineering A 26 (3A): 555–563.
- Yun, D. W., B. G. Jeon, W. Y. Jung, S. J. Chang, and Y. J. Shin. 2019. “Analysis of Anchorage Behavior Characteristics of the Electrical Cabinet Using Shaking Table Tests.” Transactions of the Korean Society for Noise and Vibration Engineering 29 (1): 43–50. https://doi.org/10.5050/KSNVE.2019.29.1.043.