
 ?Mathematical formulae have been encoded as MathML and are displayed in this HTML version using MathJax in order to improve their display. Uncheck the box to turn MathJax off. This feature requires Javascript. Click on a formula to zoom.
ABSTRACT
Disordered commercial signboards are a key source of visual chaos in the urban landscape because signboard content is presented with a variety of forms and colors. Enforcement of signboard regulations has therefore received increasing attention. However, signboards are a significant element of the urban landscape, showcasing the regional characteristics and identity of a municipal region or city. Seoul, South Korea has implemented various signboard policies aimed at improving the urban landscape, but the effect has been unsatisfactory. In this study, the effects of commercial signboard regulation were assessed in a selected district of a Seoul municipality using Analytic Hierarchy Process (AHP) perceptional analysis for both customers and business owners. Quantitative analysis found that overall signboard size was reduced by more than 80 percent after regulation. In addition, Life Cycle Cost (LCC) analysis indicates using Light Emitting Diode (LED) has a 26.4% overall cost advantage over the conventional fluorescent lamp. Notably, business owners’ responses were not negative despite the smaller signboard size. After adopting the new policy, customers ranked the signboard shape as providing the most satisfaction among various subcategories while business owners indicated high satisfaction with reduced maintenance cost.
1. Introduction
1.1. Signboards and their economic impact
It seems that everywhere one goes in a town or city one is confronted by advertising signage of one kind or another – billboards, flashing signs, electronic screens, and so on (Blewitt Citation2015). Ambient street media, including street signs, are the visual background of our everyday urban lives (Murthy Citation2005). Accordingly, it is difficult to avoid signs in any place of human habitation (Consalo Citation2016). People in an unfamiliar place primarily rely on external sources of information in their navigation (Otterbring et al. Citation2014), and signboards often provide such information. Along with navigational guidance, signage plays multiple important roles in marketing communication, including identifying businesses, brandings sites, enhancing a store’s or brand’s image, and reinforcing advertisements (Kellaris and Machleit Citation2016; Otterbring et al. Citation2014).
Businesses have strong incentives to carefully manage the retail environment for their customers (Kopp and Langenderfer Citation2014) because on-premises signs can have a direct economic impact on their business (Kim Citation2010). The return on advertising investment is the consumer’s attention, but attracting the consumer’s notice is an increasingly challenging task (Bauer, Dohmen, and Strauss Citation2011). For many businesses, especially small retail shops, a prominent and readable on-premises sign is critical for sales, as they often do not have alternative means to communicate their location details (Taylor Citation2005).
Consumers’ cognition and purchase intentions are critical in advertising and are considerably affected by such elements as informativeness, involvement, entertainment, and targeting contained in signage (Lee and Cho Citation2019). Perceived informativeness positively affects consumers’ attitudes and perceptions of the advertising to which they are exposed (Choi, Kang, and Yang Citation2012). Business owners, therefore, rely heavily on signage to attract customers and to promote awareness to passers-by (Jourdan et al. Citation2013; Otterbring et al. Citation2014). Especially with the rise of e-commerce, many businesses pay close attention to signage to distinguish their businesses as places offering unique, tangible, and rich experiences (Rahman and Mehta Citation2020).
Signage can be particularly intrusive in Seoul and other large metropolitan areas, where housing complexes usually integrate mixed-use commercial buildings to support residents’ needs. The size of these buildings is often determined by the size of the nearby housing complex. A part of the housing complex generally includes small restaurants, medical clinics, laundry sites, real estate agencies, beauty shops, banks, drug stores, supermarkets, bakeries, clothing alteration shops, electronics stores, cafés, flower shops, convenience stores, gyms, and so forth. Typically, several small, similar businesses in the same building or area compete with each other for business. Such business environments result in disorderly and chaotic signboards in terms of size, color, installation location, and other characteristics. Signage pollution has emerged as a rather serious issue with commercial buildings constructed over the past decades when proper control was not enforced. Such pollution tends to be more problematic for commercial buildings located near housing complexes than for those by commercial or business districts. Fortunately, the issue is starting to be discussed by both communities and governments, including those at the local level. In Seoul, multiple pilot projects have been implemented by governments over several decades, though most were only partially successful due to insufficient project size, failures in protecting local identity, too-strict uniformity, low satisfaction rate, and other reasons. This paper presents a case study analysis of the performance of a specific signboard regulation program implemented by one of the municipalities of Seoul. A detailed research flow is depicted in .
Figure 1. Research flow diagram.
1.2. Signboard regulation issues and literature review
Prior to discussing signboard regulation, it is worth considering the positive aspects of signboards and their contribution to the constructed urban environment. In general, signboards are considered elements of a building, even though they are installed after the building has been constructed and are replaced whenever needed. Buildings and signs, as integral objects, are central to pedestrian perceptions of an area. People’s perceptions of a streetscape are determined by numerous buildings and signs, collectively. A legible and well-organized signscape can increase positive perceptions and economic activity, while the opposite can create visual pollution and hinder commerce (Rakestraw, Crawford, and Lee Citation2021). The characteristics of commercial signs that influence user perceptions include features of individual signs such as size, legibility, and color, as well as the collective characteristics of an area such as the number of commercial signs and street facade coverage (Portella Citation2016).
Sign controls are traditionally governed by municipal zoning ordinances (Rakestraw, Crawford, and Lee Citation2021). For example, in the United States, commercial signage, which plays an important role in urban design, has often been governed by a municipality’s zoning code (Crawford, Lee, and Beatty Citation2015). Signage policies should represent the broadest possible consensus or the prevailing community perspective about the city’s appearance (Weinstein et al. Citation2002). Ideally, the planning and design policies that affect signage should come about as a result of a planning process that promotes the positive contribution signs can make in creating a sense of place in a district and in a community (Weinstein et al. Citation2002). In addition, signage should be considered as one of the detailed morphological streetscape components in assessing the visual quality of an urban environment (Reeve, Goodey, and Shipley Citation2007).
The purpose of regulation is to ensure the visual appeal of signboards on streets and buildings and to create an organized urban landscape. Because commercial signs play a significant role in the visual quality of urban streetscapes and spaces (Blewitt Citation2015; Meikle Citation2013), the effective application of commercial signage controls is critical to decreasing negative effects (Crawford, Lee, and Beatty Citation2015). Excessive restrictions on signage, however, can have a negative effect on both consumers and businesses, a fact demonstrated clearly by a number of research studies, opinion polls, and case studies in the United States (Taylor Citation2005). Taylor and Sarkees (Citation2016) note that controversy remains regarding the pros and cons of signage; critics of illuminated signs argue that they are aesthetically displeasing, waste energy, and do not provide benefits. One example of a common negative effect is visual overload caused by an excessive number of signs and high variation among their physical features, such as size, color, proportion, facade locations, lettering style, and so on (Portella Citation2007). Accordingly, planning regulations and design guidelines have sought to control, minimize, or reduce visual pollution and unsightliness from signage (Blewitt Citation2015). Regulation is essential for municipalities’ efforts to create visually stimulating public spaces (Rakestraw, Crawford, and Lee Citation2021).
A wide range of perceptional analysis has addressed signage, for instance, looking at differences between residents’ and visitors’ perceptions of a cityscape (Nasar Citation1990). Gjerde (Citation2011) reported that the general public (that is, non-design professionals) react positively to visually ordered built environment scenes and resist highly varied scenes in which there is no underlying sense of order; Gjerde noted similar aesthetic preferences among professionals (e.g., architects and town planners). Taylor et al. (Citation2012) provide empirical evidence drawn from a survey analysis, that on-premises signs help small business communicate their locations, reinforce advertising, brand their sites, and enhance store image. A study conducted by Crawford et al. (Citation2015) shows there is a common perception of signage regulations and a connection between user preference and sign controls in non-historic areas. Taylor and Sarkees’s (Citation2016) survey research found that, regardless of type, size, or number of years in business, companies believe that lighted, on-premises signs provide important marketing functions. Other studies have analyzed signs’ aesthetic appeal by measuring user perceptions in terms of beauty, interest, and order (Crawford, Lee, and Beatty Citation2015; Portella Citation2016). For example, Franke and Taylor (Citation2017) conducted a meta-analysis to examine public perceptions of billboards by utilizing more than 100,000 elements of survey data. Rahman and Mehta (Citation2020) examined neighborhood visual identity by analyzing the form and character (including typography, materiality, dimensionality, size, scale, and color) of on-premises signage. Rakestraw et al. (Citation2021) compared the perceptional differences between designers and non-designers regarding on-premises commercial sign controls within urban corridors. Using three perception indicators (beauty, interest, and order), they identified a significant statistical difference between the two groups for only one indicator – beauty. Other studies have examined the impact of new technology on consumer perceptions. For instance, Xiangmin et al. (Citation2022) proposed a new virtual reality technique and utilized the correlation between eye movement data and visual perception in analyzing commercial streets’ visual attractiveness.
Previous literature on Korean signboard issues has tended to focus on the method of program implementation and the form of signboard design from an urban planning and signboard improvement perspective. Song and Park (Citation2011) highlight problems underlying the programs, like design uniformity, a mismatch between signboard and building styles, and inefficient project performance due to government-driven practice; they suggest representing local identity, using appropriate lettering style and colors, and applying design guidelines flexibly to improve current practices. In a similar context, Noh (Citation2007) recommends the active involvement of residents, ensuring new guidelines are consistent with local characteristics, and improving public relations communication about the project. Lee’s (Citation2007) quantitative and qualitative analysis results revealed that signboard areas are significantly reduced (by about 50 percent) after the implementation of signboard improvement programs, though experts’ perceptions of the improvements indicated that only the comfortability index was significantly improved, while symbolism, accessibility, and other indices are not.
Most previous studies have focused on perceptional differences or satisfaction levels of pedestrians, residents, or visitors. This study, in contrast, considered both of the groups most impacted by signboard regulation: customers, including residents, and business owners. This study also reports quantitative research outcomes of an analysis of the level of signboard downsizing and LCC.
1.3. Review of Seoul metropolitan signboard practices
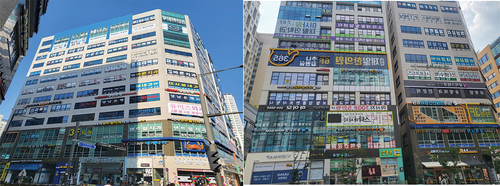
This section describes South Korean signboard practices, with a particular focus on Seoul. Signboards are considered an efficient communication tool in an urban environment. However, the morphologic form of signboards in Seoul has deteriorated over the last few decades in terms of shape and aesthetics. Most notably, their size and shape are senseless and excessively highlight visual elements by emphasizing stimulating content and using highly-noticeable colors. Accordingly, Seoul’s visual environment and streetscape have declined dramatically. These problems have led to a consensus on enforcing signboard regulation and triggered the signboard improvement programs of the early 2000s, which implemented regulations to control Seoul’s chaotic street environment. offers examples of signboard displays in an unregulated commercial district. As demonstrates, almost every building facade is covered with signs. No consistency can be found at all in terms of form, size, or color. As a result, both the buildings and these signs create eye pollution from an urban streetscape viewpoint. These cases exemplify the importance of appropriate regulation because the buildings were constructed after the current study’s samples.
Figure 2. Signboard examples in unregulated areas.
The city of Seoul consists of 25 municipalities, and only a few are participating in a signboard improvement program. In fact, several have implemented programs with similar names, such as “street one would like to walk”, “street upgrade project”, “scenic signboard street”, and “green street one would like to walk”. Although implemented by different municipalities, these initiatives all aim at promoting a pleasant urban environment, enhancing quality of life, and improving pedestrian convenience by enforcing signboard regulations. Some programs also seek energy savings and elimination of the risk of signs falling due to typhoons by limiting the numbers and size of signboards. The average project period was approximately eight months. However, these programs were implemented without sufficient preparation and careful consideration; specifically, a lack of systematic coordination with various community elements and stakeholders precluded a comprehensive and integrated approach. Unsurprisingly, the programs’ performance is considered disappointing from the public’s perspective.
(Seoul Metropolitan Government Citation2008) signboard design guidebook provides detailed instructions for making an effective and attractive commercial sign, including colors, inscription elements, signboard quality, lighting, size, the number of signboards, location, permissions, fabrication and installation, safety, and management (Paek Citation2017). Some of the above instructions are consistent with the eight principles of the sign system, as suggested by Tzeng and Wang (Citation2011): location, content, color, font style, lighting, size, special shapes, and material.
In the late 2000s, the city of Seoul and its municipalities started coordinating to promote a more efficient program; however, this effort was also deemed unsatisfactory due to the structure of the program, which was driven by the government without the voluntary participation of building- and shop-owners (i.e., the tenants). In the 2010s, city authorities and municipalities identified the problems of the previous programs and began to share the lessons they had learned. Specifically, the city of Seoul strongly emphasized the new design principles of the Design Seoul program, which reduced all forms of urban and visual pollution (Paek Citation2017). The city of Seoul proposed a signboard improvement program with four key aspects: environment, readability, aesthetic, and identity. The Design Seoul guidelines suggest detailed changes: limit the total number of signboards for each shop, limit the size and signboard areas, emphasize the orderliness of the urban landscape, enhance readability, create harmony within the local environment, and prioritize indirect and outside lighting while prohibiting flashing and exposed lights. The Ministry of Land, Infrastructure and Transport (Citation2013) also provides signboard guidelines regarding text, shape, design, material, color, letter, and lighting.
2. Samples and research methodologies
2.1. Sample site selection and characteristics
This study screened signboard programs implemented by Seoul municipalities and selected the Songpa-gu (Citation2017) program, which is considered to have been successful. The program provides the following signboard guidelines: using lighting and colors that are harmonious with the surrounding environment, ensuring a pleasant visual form, using natural materials and properties, optimizing signboard arrangements that consider the pedestrian point of view, and promoting an organized street environment through restrained design. Prior to selecting specific building samples for this study, the researchers conducted interviews and exchanged multiple rounds of questions and answers via e-mail with the district officials who oversee outdoor advertisement to obtain detailed signboard program information and policies. After sufficient information was collected, three mixed-use commercial buildings that had been constructed as a part of large independent residential complexes were selected for analysis. shows the location of the buildings and the surrounding environment. The buildings are located at the corners of the same intersection and distances among them are about 100 m. Each building faces a ten-lane motorway; a subway station with eight exits is also located at the intersection. Along with the three commercial buildings, street shops and restaurants line one of the intersection’s corners.
Figure 3. Layout of selected commercial buildings and the surrounding environment.

Large residential complexes are located behind each commercial building. Enclosing roads are shown with white lines, and elementary, middle, and high schools are indicated in purple, green, and blue respectively. Residential complex A has 72 apartment buildings; B has 65, and C has 46. The average number of floors in each building is around 33, and the total number of housing units in the three complexes is 14,937. Residents are estimated to number between 50,000 and 60,000 people.
The gross floor area of the three commercial buildings ranges from 25,500 to 39,100 m2, and the number of businesses ranges from 220 to 460. All three buildings have five floors, and the first basement level is used for shopping, while the second basement levels is parking lots. The tenants of the three commercial buildings are diversified yet show similar floor preferences according to business characteristics; the first floor is mostly favored by real estate agencies, grocery stores, and bakeries, and the second and third floors are preferred by medical clinics and banks. Food stores, including snacks and coffee shops, tend to be located on the first basement floor. Characteristics of the three malls are summarized in .
Table 1. Description and characteristics of each mall.
shows the street-side exterior of Building A. Signboards’ sizes varied but width and shape were relatively similar. As seen in , windows that have signs are used on the fourth and fifth floors to avoid regulation. The average size of window lettering for advertisement graphics is 5.63 m by 1.05 m and the area is, on average, 2.5 times larger than that of the horizontal type of external signboards.
Figure 4. Street view of building a.

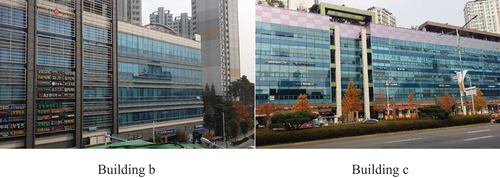
shows the street exteriors of Buildings B and C. The exterior of Building B is finished with glass, and all signboards are installed at two specified points (i.e., on the left and in the front of the building), except on the first floor. The disadvantage of this type of consolidated signboard installation is that customers cannot readily identify business locations from the signs. The board size tends to be similar and thus uniformity is secured, while the visual aspect is chaotic because of too many colors. One of the advantages of this kind of signboard display is the significant reduction of window signboards because all businesses’ signboards are collectively displayed in a designated location.
Figure 5. Street views of buildings b and c.
The right side of shows Building C’s street view. The front side of the building is the glass curtain-wall style. For this building, only three-dimensional horizontal lettering is allowed; the board-type sign is prohibited. The total number of advertising signs utilizing a window is 23, 21 of which are concentrated on the fourth and fifth floors where a horizontal exterior sign is not allowed. The primary kind of window sign was the roll screen type. This style of sign can avoid enforcement by business owners displaying it and removing it quickly. For Building C, the initial signboard design concept and plans were modified according to the recommendations of a municipal review and the permission council. Recommendations included signboard arrangement, size, and place of installation. Through the above process, the overall sign visual can be organized and harmonized while securing consistency.
2.2. Research methods
This study referenced perception-based research that used the Analytic Hierarchy Process (AHP) method (Alrawad et al. Citation2023; Bhattacharya et al. Citation2023; El-Kholei and Yassein Citation2022; Hong and Chang Citation2020; Kumar and Gupta Citation2020; Lee and Shepley Citation2020) to design the research framework and determine appropriate analytical tools. For the qualitative analysis, satisfaction regarding the signboard improvement program was measured through a questionnaire administered to both customers (mostly residents) and business owners. Despite the risk of response bias, questionnaires and interviews (which are the most idiomatic way to conduct surveys), have been shown to be effective in documenting abstract perceptions of a built environment (Ma et al. Citation2021). Crawford et al. (Citation2015) note that despite critiques of the perception-based approach, it has also been the major evaluation method used in landscape research.
Prior to designing a questionnaire survey form, it was necessary to construct an AHP hierarchy. This study adopted a three-level hierarchy. The first level was research objectives (i.e., customers’ and business owners’ satisfaction). The second level of the structure had three main category attributes (cognitivity, harmony, and identity) for customer perception analysis while an economic category was added for business owners’ perception analysis. The third level had 11 and 13 subcategory attributes for customers and business owners, respectively). Those main categories and subcategories were extracted from relevant government policies (Ministry of Land, Infrastructure and Transport Citation2013; Seoul Metropolitan Government Citation2008; Songpa-gu Citation2017) and literature (Baek, Song, and Paik Citation2010; Seo et al. Citation2011). Two sets of questionnaire forms were then designed based on the above framework. Prior to implementing the main survey, a short exploratory survey was conducted to evaluate the forms, which were then revised based on the results.
Securing the sample of respondents (both customers and business owners) was a challenging task because it was time-consuming and required respondents’ willing cooperation. Collecting surveys via e-mail was not a plausible option due to the personal information protection law. Therefore, the survey was distributed from a table prepared in front of the three buildings’ main entrances by researchers who asked customers if they would be willing to participate in the survey. For business owners, the researchers randomly selected individual businesses and visited in person to ask for participation in the survey. If customers and business owners agreed to participate in the survey, the authors explained the purpose, method, and personal information protection, then asked the participant to fill in the printed survey form. Respondents were asked to compare the performance of the signboard improvement program with commercial spaces where signboard use is unregulated using a 9-point Likert scale for pairwise comparison. Depending on the respondent’s age and the level of familiarity with signboard and urban development issues, the frequency of questions asked of the researchers varied. Average response time was between 20 and 30 minutes. Researchers gathered responses over 15 days. Care was taken to obtain a similar number of samples from each of the three buildings.
The consistency ratio (CR) was used to evaluate the sample, with a judgment criterion of not exceeding 0.10. The formula for CR calculation is shown in EquationEquation (1)(1)
(1) .
where max represents the principal eigenvector value.
CR values are obtained from the Expert Choice 11.5. Satisfaction level and opinion on the importance of the signboard regulation program were also assessed using the same program. IBM’s SPSS software was used for the independent sample t-test under the assumption that the two groups’ (i.e., customers and business owners) sample means are the same.
This study adopted previous studies’ methods for calculating importance and satisfaction scores of categories and subcategories (Darko et al. Citation2019; Kim et al. Citation2015; Saaty Citation1980; Tam and Tummala Citation2001; Teknomo Citation2012; Wei, Chien, and Wang Citation2005; Yu and Park Citation2019). For each pairwise comparison, the responders’ rating scores and number of corresponding responses were used to calculate normalized scores for each attribute (categories or subcategories). Utilizing the normalized scores, a comparison matrix was generated followed by a normalized comparison matrix. A normalized principal eigenvector, also called a priority vector, was then derived using the normalized relative weight of each attribute. The eigenvector values were used as relative weights among the comparison attributes.
Quantitative analysis was also conducted regarding the downsizing of the signboard area and LCC. As shown in , signboards are installed in a disorderly way in unregulated areas. The business environment in this location is extremely competitive. There is fierce competition among businesses offering similar products or services and securing customers is critical for survival. Shop owners seek to fully leverage the advertisement effect by highlighting, occupying the best location, and maximizing signboard size to attract potential customers’ attention. Typically, every available surface of buildings in unregulated areas is utilized for signboard installation, especially buildings with many small businesses. To quantitatively estimate the signboard reduction for three commercial buildings, the physical space available for signboard installation (if there were no signboard regulations) was measured. Only the front side of a building that faces a main street was considered. The reduction in signboard area was determined by subtracting the actual signboard area of the sample buildings from that of the physical space available for signs if their installation were unregulated.
3. Results and discussion
3.1. Building surface area analysis
The most significant quantitative effect of signboard regulation enforcement is the reduction of signboard coverage areas. The signboard regulations in the sample area imposed height and width limits: the width cannot exceed 80% of the business space’s width and the height cannot exceed 45 cm. This policy reduced average signboard area by more than 80%. In the case of Building C, the reduction was almost 90%. Such a reduction resulted in savings in terms of initial investment for signboards and maintenance costs. Detailed signboard reduction data is shown in .
Table 2. Pre- and post-signboard regulation: the reduction of signboard areas.
Results indicate that signboard area (excluding window graphics) was reduced by 365.8 m2 (−80%), −513 m2 (−88%), and −659.4 m2 (−89%) for samples A, B, and C, respectively. The researchers included all non-window surface areas on the front side of the buildings for the unregulated signage area calculation, which, while not unreasonable given actual practice in unregulated zones, may have artificially inflated these values. Accordingly, the actual signboard area reduction may be lower than the values presented in . However, these values provide a reasonable estimate of the effect of signboard policy.
The values in parentheses indicate that windows that have advertisements are heavily concentrated on the higher floors (i.e., the fourth and fifth floors) after the implementation of the signboard improvement policy. In general, government guidelines allow window graphics only for the entrance door and windows of a ground-floor business; therefore, installing window graphics on higher floors is considered to be violating the regulation. However, as described in the earlier section, window graphics are disorderly on the fourth and fifth floors after the improvement program was completed. Many businesses installed the roll-screen type of signage and letters printed on paper for advertisement as well as for light-blocking purposes. The prevalence of such practices may give the impression of damaged buildings and urban landscapes.
3.2. LCC analysis
LCC analysis was conducted to assess the effect of signboard regulation policy enforcement from an economic perspective. The conventional signboard, the Rectangle Flex Glow (RFG), has been widely used in South Korea in areas where signboard regulation is not enforced. However, using 3D LED letters on signage has several advantages, including aesthetics, energy savings, minimalism, and advertising effectiveness. Despite these advantages, RFG signboards continue to be used on old buildings and in unregulated areas. The fluorescent lamp is the primary light source for the RFG signboards, while the LED lamp is favored for the type using 3D letters. Although LED lamp usage is recommended for reducing CO2 emissions and energy costs, business owners hesitate to exchange them due to up-front costs.
LCC analysis requires consideration of both the initial investment and the maintenance costs. Initial investment cost includes signboard fabrication and installation, and maintenance costs consist of electricity and maintenance supplies. Electricity costs may vary significantly according to lamp type. All components required in fabricating RFG and LED signs are accounted for, as well as items for installation, which includes labor costs and equipment usage. In addition, all elements requiring maintenance are considered.
A critical consideration for LCC analysis is the duration of a business’s lifespan. Depending on the business type, the business life will vary. If a business closes or the business owner changes, there is a high likelihood that there will be a change in signboards. Therefore, this study factored average business survival durations for all private business types into the LCC analysis. In calculating electricity charges, the daily lighting duration was set at seven hours, as the regulations specify signs may be illuminated from 17:00 through 00:00. Initial signboard fabrication costs are 23.5% higher for LED signboards than for conventional fluorescent lamps. The study period for LCC analysis was taken to be ten years.
Cost comparison requires selecting a specific time point – either the present or a specified future time – and an identical analysis period for all scenarios. In general, LED signboards require a higher initial investment than the RFG type while the LED type has the advantage of lower electric charges and longer replacement cycles. Therefore, the cash flows of two signboard types can vary significantly over time. The conventional Net Present Value (NPV) method has been widely used for LCC analysis in previous studies (Dell’lsola and Kirk Citation2003; Hajare and Elwakil Citation2020; Petrović et al. Citation2021). All monetary flows and the timing of occurrences are identified first under the assumption of ten years of operation. Then each monetary flow, mostly outflows in this study, is brought to the present time by discounting future values. The sum of present values for each scenario represents LCC. compares cost components between LED and RFG-type signboards over ten years. The ratios are calculated based on present values.
Figure 6. Comparison of cost components (LED vs. RFG signboard).
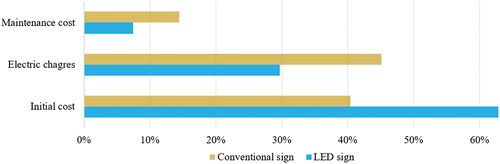
As expected, LED signs had cost advantages in terms of electricity and maintenance. Results indicate that the LED type has a 26.4% overall cost advantage over the conventional style, and the higher initial investment cost can be offset after 48 months of operation (the break-even point). In other words, after month 49, the LED signboard has an economic advantage over the conventional one.
Signboard improvement can be classified into two categories: new and existing buildings. For new buildings, signboards are regulated by current codes or laws, but the modernization of old-style signboards on existing buildings can be government-subsidized under an improvement policy. Such economic support can significantly reduce the initial burden of replacing deteriorated signboards. Moreover, such support may motivate owners to participate in the program.
3.3. Perception analysis results
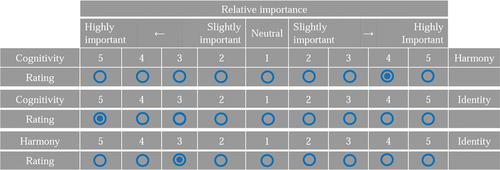
This section describes the perception analysis results for customers’ and business owners’ views on the comparative importance of several elements related to signboards. Seventy customers and 96 business owners participated in the surveys. Of the 70 customer responses, 15 were excluded from the analysis because the CR exceeded 0.1. Using the same methodology, 28 of the 96 business owner responses were excluded. In total, 55 customer responses and 68 business owner responses were assessed. shows the pairwise comparison structure of the questionnaire survey form, using the three main categories. The same format was used for pairwise comparison of subcategories. For the customer survey, 16 pairwise comparisons were made: 10 for cognitivity, 3 for harmony, and 3 for the identity subcategory, respectively, according to the formula n(n-1)/2 (Teknomo Citation2012).
Figure 7. Questionnaire survey form structure.
The demographics of the respondents were as follows: of the 55 customers, 45% were men and 55% women; the majority of respondents (66%) were in their 30s and 40s; all respondents visited the sample buildings at least once per week. As for the 68 business owners, 53% were men and 47% women; the majority of respondents (79%) were in their 30s and 40s. The business types were retail (35%), offices (26%), private lessons and education (22%), and medical clinics (16%).
3.3.1. Customers’ perceptions
Three indices were adopted to assess customers’ satisfaction levels. The first index was cognitivity, which represents how readily people recognize the content of a signboard. The subcategories of cognitivity consisted of size, shape, color, installation location, and letter size. The second index was harmony, which indicates the level of congruity with the surrounding environment, commercial buildings, and other signboards. The last was the identity index, which included the identities of a district, commercial building, and individual business. shows the response distribution of perceived relative importance among the attributes. Each respondent was asked to choose 1 option among 9 for 11 subcategories. For example, regarding signboard size and shape comparison, 29 respondents conceived the size is more important than shape while 14 respondents showed no preference by choosing neutral.
Table 3. Customer response distribution.
Analysis of customers’ perceptions of the 11 attributes are presented in .
Table 4. Customers’ perceptions.
All the CR values for the three main groups were less than 0.1, thereby confirming that the analysis is statistically valid. Results indicate that cognitivity was considered the most important (0.502) attribute of a signboard, followed by harmony (0.297), and then identity (0.201). The score of 0.502 is the relative weight among three categories (cognitivity, harmony, and identity); one of the priority vector values described in the methods section. The consistency index value confirmed the statistical validity of the results, showing less than 0.1, the judgment criterion. The weighted importance of each subcategory was computed reflecting the importance of the main category. For instance, the weighted importance of size (0.164) was computed by multiplying the overall index importance (0.502) by the subcategory importance (0.326). The satisfaction ranking compares the priority of 11 subcategories for conventional (unregulated) and new (regulated) styles.
As shown in , in the cognitivity analysis, signboard size was the most important factor (0.326), followed by shape, color, location, and letter size. The sample buildings are relatively large and numerous businesses display many signboards on the building exterior, creating a challenge for customers who want to identify the business they would like to visit as quickly as possible. The results imply that the size and shape of a signboard are critical in catching customers’ attention. For harmony, the most important value was balance or aligning with the surrounding environment (0.482) compared to balance with the building and with other signboards. This supports the idea that organized urban scenery can have a positive psychological impression on customers or pedestrians. Even if the signboard itself has an appealing design, it may not appeal to customers if it is not compatible or harmonious with the urban landscape. Furthermore, a commercial building’s overall attractiveness is important to tenant businesses; an attractive building with a coherent identity may stimulate customers’ expectations.
Notably, there was a consensus among customers regarding how effectively harmony creates identity: the customer assessment indicated that reflecting or representing the characteristics of the district well (0.437) is vital in securing identity compared to reflecting the characteristics of the building (0.311) or businesses (0.252) themselves. The above result is consistent with that of the harmony category. The majority of customer respondents lived near the buildings, which were constructed as a part of their residential complexes. A relatively large commercial building located in proximity to a residential complex makes residents’ home values more competitive. Accordingly, commercial buildings that harmonize with the residential complex as well as with the surrounding environment may increase the value of the area’s housing. If the uniqueness of businesses or buildings is emphasized on a signboard without careful consideration of the surrounding environment or landscape, the commercial building will likely have a negative effect on the visual urban environment.
Results for the 11 subcategory elements indicate that the weighted importance was highest (0.164) for signboard size, followed by shape (0.145) and the surrounding environment (0.143).
All signboards on the three sample buildings except the window graphics were fabricated and installed in compliance with municipal guidelines. Customers were asked to assess the effect of signboard enforcement policy in terms of satisfaction level for each of the 11 subcategories. The results reveal that customers were disappointed with smaller signs and letter sizes and the location of signs, but more satisfied with well-designed shapes and colors. Harmony between the signs and their surrounding environment received significant attention, and customers perceived that harmony between the signs and the building, and among signs themselves, improved after the new policy was adopted. The customers’ ranking of harmony with the surrounding environment second in creating satisfaction in unregulated commercial sign environments is unconvincing because numerous randomly jumbled signs undoubtedly harm the visual appeal of the surrounding environment. The customers might have a positive perception of the diversity of signs in terms of size, color, and shape, and they may also believe that such attributes help in setting a unique environment; however customers also like well-arranged signs. Therefore, more research should be conducted on this topic. Regarding identity, customers’ valuation was, in general, low.
For the subcategories valued highly in weighted importance but lowered satisfaction ranking after the regulation, careful modification should be done. For instance, customers have a negative view of significantly reduced sign sizes, so this is an area where policy could be improved. In addition, limiting letter size to a certain level may hinder readability. Therefore, more consideration should be given to increasing satisfaction levels for the subcategories assessed as low.
3.3.2. Business owners’ perceptions
In addition to the index categories on the customer survey, the survey of business owners also incorporated economic factors such as initial investment and maintenance costs for signs. Each business owner reported being responsible for the costs incurred for the fabrication and installation of the signboards as well as for maintenance costs during the life of the business. Results of business owners’ perceptions of the 13 attributes are presented in .
Table 5. Business owners’ perceptions.
For the business owners’ evaluations, all the CR values for the four main groups were less than 0.1, confirming that the analysis is statistically valid. Business owners considered cognitivity (0.378) the most important category, followed by identity (0.220), economics (0.202), and harmony (0.200). The three categories other than cognitivity had very similar importance values.
Conveying the business’s information through signboards is key, given the critical importance of attracting customers. The signboard generally presents the business’s name, type, phone number, and location (often including the floor level). Both customers and owners value a readily recognizable signboard, but for slightly different reasons: customers want to shop or receive services quickly, while business owners hope to attract as many customers as possible through the signboard. On the whole, this result suggests that the visual elements that contribute to a signboard’s recognition factor are the most important signboard characteristics for both customers and business owners.
As shown in , in the cognitivity analysis, signboard size was the most important element (0.261), followed by shape (0.250), color (0.191), location (0.163), and then letter size (0.135). Business owners’ value ranking for the subcategories of cognitivity category was consistent with that of customers’ evaluations. Owners tend to want to maximize signboard size to attract customer attention.
For the harmony category evaluation, balance or congruence with the surrounding environment had the highest importance value (0.400) compared to balance with the building itself (0.312) and with other signboards (0.287). Here, too, the results showed identical rankings to the customers’. As described in the analysis of customers’ perceptions, high valuation on harmony with the surrounding environment is reasonable. What can explain the result of the business owners’ perceptions? One of the following arguments may help explain this result. First, business owners care less about the harmony between signboards and other elements because their priority concern is business success. In addition, most owners are not residents of the nearby apartment complexes and are thus insensitive to changes in apartment values. Therefore, they may have simply assessed the priority among evaluation items and may have no critical preference at all among the subcategories. Alternatively, they may believe the shop’s value or premium can be increased if the building’s value increases by having more harmonized features with the surrounding environment, or they may expect more customer visits by operating in a more attractive building that harmonizes with the surrounding environment and creates a pleasant visual impression.
In evaluating identity, business owners most highly valued the special characteristics or uniqueness of each shop (0.359), followed by representing the building’s identity (0.339), and reflecting the district’s characteristics (0.302). The rankings of business owners’ evaluations are reversed from those of the customers’, as could be expected considering business owners’ ultimate goal (i.e., maximizing profits). Securing uniqueness or differentiating one’s business from others may provide more of a competitive edge for the business than the identities of a building or a district (or both).
From an economic perspective, more business owners prioritized maintenance expenses (0.519) than initial investment costs (0.481), though both were considered important. Owners’ understanding of the cost elements was high; for instance, they knew that smaller and LED-type signboards have lower lifecycle costs than conventional signs.
The overall satisfaction of business owners with the effects of signage regulations was higher than expected. The authors anticipated that the degree of satisfaction would be low for factors such as downsizing signboard area, limiting locations for signboard installation, and other restrictions. However, the result is less surprising considering the following facts. Most customers live near the commercial building and thus have sufficient information about the businesses and the services provided. Business owners’ interviews supported the above argument; they noted that most visitors are regular customers living in the nearby housing complexes. In addition, each housing complex shares information such as a list of shops and services provided and customer reviews via an independent online community network. This means that signboards are not the sole, or even dominant, communication mechanism attracting customers’ attention in a building that supports a residential complex. However, the above may not be generalizable to businesses in commercial and business districts, which have a higher volume of non-resident and new visitors. It seems likely that the communicative importance of signboards will decrease gradually as internet search engines and other information technology provides more comprehensive and accessible information.
The results for the 13 subcategories indicate that the combined importance of the maintenance cost was highest (0.105), followed by signboard size (0.099), initial investment costs (0.097), and signboard shape (0.095). Letter size (0.051) and harmonizing with other signboards (0.057) were considered least important. The ranking analysis for the business owners’ satisfaction levels revealed owners had positive views of the shape, color, and letter size of signs after the adoption of the new policy but were dissatisfied with the limited locations for sign installation. In contrast to the customers’ views, business owners did not highly value sign size. For the harmony evaluation, owners showed positive responses to the harmony between signs and their surrounding environment and between them and other signboards. For the identity evaluation, owners tended to perceive that the identities of a district, building, or business as harmed by the new policy. From an economic perspective, business owners were satisfied with maintenance costs under the new signage policy, ranking that sub-item first.
Low satisfaction rankings for the post-implementation category – for letter size, for example – imply that business owners were dissatisfied about specific requirements or strict enforcement of signboard policies. In addition, low satisfaction regarding harmony with the building and other signboards indicates a negative view of sign uniformity and suggests signage policies should allow a certain amount of diversity. Business owners’ evaluations were similar to those of customers regarding limitations on letter size, which may decrease the advertisement effect from a business owner’s perspective. Neither customers nor business owners were satisfied with letter size, indicating this as an area where policy improvement is needed.
3.3.3. Significance (t-test)
The statistical difference in satisfaction levels between customers and business owners was measured through a t-test. For each subcategory, the mean was first measured, and then statistical significance is tested. Only the 11 subcategories included in both questionnaires (excluding the two economic-related subcategories that were only included on the business owners’ questionnaire) were tested. Results indicate that only one subcategory, the harmony between signboards and the building, is statistically significant at the 0.05 level, while no mean differences are observed for the other ten subcategories.
3.3.4. Implications
These findings indicate streetscapes can be improved by significantly reducing the signboard coverage of buildings; long-term economic benefit can be realized by utilizing LED signs; and appropriate signage policies can satisfy both customers and business owners. Most local governments and other districts in the Seoul metropolitan area are not currently enforcing signboard improvement policies, often due to opposition from business owners and insufficient budgets for financial support. Some local municipalities are recently implemented laws or ordinances to regulate disordered signs; however, new regulations tend to focus on new construction and exclude signs on existing buildings. Since the benefits of regulation are apparent, government officials should consider adopting signboard improvement programs.
Forcing signboard improvement programs may draw significant opposition from business owners; therefore, any regulation effort should be preceded by consensus building among key stakeholders of the municipality. As described above, however, signboards are no longer the sole information transmission mechanism for many businesses, and it is reasonable to expect that the use of the internet will dramatically increase business discoverability. Educating business owners on the qualitative benefits of these alternatives is thus important. For instance, sign improvement leads to a more attractive building and harmonizes with the surrounding environment, providing organized and aesthetically appealing urban scenery. In turn, improved aesthetic characteristics may draw more customers and have a positive effect on their businesses. In addition, the increasing importance of sustainability issues lends support for the use of energy-saving options such as LED signs. Over time, these social and cultural changes will ease the acceptance of signboard improvement programs.
4. Conclusions
This study assessed the effects of signboard improvement policy implementation and found several advantages, such as creating pleasant urban scenery, contributing to a neighborhood’s identity, reducing costs for signboard fabrication and installation, and saving energy. However, adopting new regulations also brought negative effects such as reliance on window graphics on higher floors as a substitution for signboards, which violates policy and negatively impacts the building and streetscape scenery.
Quantitative analysis outcomes revealed that policy implementation reduced signboard area by at least 80 percent for all three sample buildings, compared to buildings in areas with no regulation. The analysis of initial signboard fabrication costs indicates that LED signboards cost 23.5% more than that of conventional fluorescent signs, but LED signs have a 26.4% overall cost advantage over the conventional type over the long term (i.e., the 10-year study period) when electricity and maintenance costs are considered. In addition, the higher initial investment cost can be offset after 48 months of operation.
Through the sample screening process, a total of 123 qualified questionnaire survey results (55 customers and 68 business owners) were utilized for perceptional analysis. In general, both customers and business owners indicated satisfaction with the improvement program. Among the various subcategories, customers tended to highly value improved design (shape was ranked as the first among 11 attributes) and the size of the signboard itself (ranked third), as well as the improvement of the urban landscape from greater harmony between signboards and the surrounding environment (ranked second). Business owners expressed negative views of signboard uniformity and specific regulations such as limiting letter size (ranked last among 13 attributes). In the pairwise evaluation of the importance of 13 subcategories, business owners tended to be more concerned about maintenance expenses and initial investment costs than other attributes.
These findings suggest existing signboard regulations should be supplemented to allow larger signboards and letters, increase subsidies for replacing conventional signboards, allow greater diversity in terms of size, color, and shape to avoid uniformity, and strictly enforce regulations (to prevent window graphic use). The central government should also promote the active participation of local governments in the program.
In addition, these findings will be useful for other countries that have similar concerns such as chaotic signboard problems and needing to improve urban scenery. Finally, this study contributes to the body of knowledge of architectural and urban landscape planning research.
Despite these contributions, this study had several limitations. The structure of the questionnaire did not permit the investigation of noncompliance with regulations on window graphics or allow a deeper analysis of dissatisfaction on several attributes. In addition, this study did not distinguish between different types of participants such as leaseholders and tenants among business owners, or customer attributes such as gender, age, and profession. Finally, the three commercial building samples are relatively large buildings located in densely populated residential areas; different building types, sizes, and locations may yield different results. These topics and issues should be addressed in future research.
Disclosure statement
No potential conflict of interest was reported by the author(s).
Additional information
Funding
Notes on contributors
Jungseob Yun
Mr. Jungseob Yun is working for his Ph. D. dissertation. He is also operating interior design and building renovation business.
Jongsoo Choi
Dr. Jongsoo Choi is a professor in the school of engineering at the Dongguk university in Seoul S. Korea. His research interests focus on design coordination and BIM.
References
- Alrawad, M., A. Lutfi, M. A. Almaiah, A. Alsyouf, A. L. Al-Khasawneh, H. M. Arafa, M. Tork, A. M. AboAlkhair, and M. Tork. 2023. “Managers’ Perception and Attitude Toward Financial Risks Associated with SMEs: Analytic Hierarchy Process Approach.” Journal of Risk and Financial Management 16 (2): 86. https://doi.org/10.3390/jrfm16020086.
- Baek, S., J. Song, and J. Paik. 2010. “Survey on users’ Satisfaction Level with the Outdoor signboards’ Visual Factors in Myeong-Dong.” The Journal of the Korea Contents Association 11 (1): 181–192. www.dbpia.co.kr.
- Bauer, C., P. Dohmen, and C. Strauss. 2011. “Interactive Digital Signage-An Innovative Service and Its Future Strategies.” In 2011 International Conference on Emerging Intelligent Data and Web Technologies, Tirana, Albania, 137–142. IEEE. September.
- Bhattacharya, P., A. Mukhopadhyay, J. Saha, B. Samanta, M. Mondal, S. Bhattacharya, and S. Paul. 2023. “Perception-Satisfaction Based Quality Assessment of Tourism and Hospitality Services in the Himalayan Region: An Application of AHP-SERVQUAL Approach on Sandakphu Trail, West Bengal, India.” International Journal of Geoheritage and Parks 11 (2): 259–275. https://doi.org/10.1016/j.ijgeop.2023.04.001.
- Blewitt, J. 2015. “Visual Pollution: Advertising, Signage and Environmental Quality.” Planning Perspectives 30 (1): 181–183. https://doi.org/10.1080/02665433.2014.967496.
- Choi, M. S., M. C. Kang, and S. B. Yang. 2012. “An Investigation of Affecting Factors on consumers’ Perceived Value and Attitude Towards Advertising in Smart Signage.” Journal of Information Technology Applications and Management 19 (4): 115–135. https://doi.org/10.21219/jitam.2012.19.4.115.
- Consalo, K. Z. 2016. “With the Best of Intentions: First Amendment Pitfalls for Government Regulation of Signage and Noise.” Stetson Law Review 46 (3): 533.
- Crawford, P., E. Lee, and M. Beatty. 2015. “Aesthetic Perception of Urban Streetscapes and the Impact of Form-Based Codes and Traditional Zoning Codes on Commercial Signage.” Current Urban Studies 3 (3): 199–215. https://doi.org/10.4236/cus.2015.33017.
- Darko, A., A. P. C. Chan, E. E. Ameyaw, E. K. Owusu, E. Pärn, and D. J. Edwards. 2019. “Review of Application of Analytic Hierarchy Process (AHP) in Construction.” International Journal of Construction Management 19 (5): 436–452. https://doi.org/10.1080/15623599.2018.1452098.
- Dell’lsola, A. J., and S. J. Kirk. 2003. Life Cycle Costing for Facilities. Massachusetts: Reed Construction Data.
- El-Kholei, A. O., and G. Yassein. 2022. “Professionals’ Perceptions for Designing Vibrant Public Spaces: Theory and Praxis.” Ain Shams Engineering Journal 13 (5): 101727. https://doi.org/10.1016/j.asej.2022.101727.
- Franke, G. R., and C. R. Taylor. 2017. “Public Perceptions of Billboards: A Meta-Analysis.” Journal of Advertising 46 (3): 395–410. https://doi.org/10.1080/00913367.2017.1334248.
- Gjerde, M. 2011. “Visual Evaluation of Urban Streetscapes: How Do Public Preferences Reconcile with Those Held by Experts?” Urban Design International 16 (3): 153–161. https://doi.org/10.1057/udi.2011.10.
- Hajare, A., and E. Elwakil. 2020. “Integration of Life Cycle Cost Analysis and Energy Simulation for Building Energy-Efficient Strategies Assessment.” Sustainable Cities and Society 61:102293. https://doi.org/10.1016/j.scs.2020.102293.
- Hong, C. Y., and H. Chang. 2020. “Residents’ Perception of Flood Risk and Urban Stream Restoration Using Multi‐Criteria Decision Analysis.” River Research and Applications 36 (10): 2078–2088. https://doi.org/10.1002/rra.3728.
- Jourdan, D., K. Hurd, H. Hawkins, and K. Winson-Geideman. 2013. “Evidence-Based Sign Regulation: Regulating Signage on the Basis of Empirical Wisdom.” Urban Law 45 (2): 327.
- Kellaris, J. J., and K. A. Machleit. 2016. “Signage as Marketing Communication.” Interdisciplinary Journal of Signage and Wayfinding 1 (1): 1–17. https://doi.org/10.15763/issn.2470-9670.2016.v1.i1.a4.
- Kim, K. 2010. “The evaluation of the impact of form-based code and conventional zoning on Fort McPherson redevelopment.” Master’s Thesis, Atlanta, GA: Georgia Institute of Technology.
- Kim, J. H., C. Y. Park, S. H. Kang, and S. J. Choi. 2015. “An Overview of the Analytic Hierarchy Process.” Evidence & Value 1 (1): 35–40. https://kmbase.medric.or.kr/.
- Kopp, S. W., and J. Langenderfer. 2014. “Protecting Appearance and Atmospherics: Trade Dress as a Component of Retail Strategy.” Journal of Public Policy and Marketing 33 (1): 34–48. https://doi.org/10.1509/jppm.09.031.
- Kumar, M., and S. Gupta. 2020. “Security Perception of E-Banking Users in India: An Analytical Hierarchy Process.” Banks and Bank Systems 15 (1): 11. https://doi.org/10.21511/bbs.15(1).2020.02.
- Lee, K. A. 2007. “The Current State and Future Direction of Signboard Model Street Project.” Journal of Outdoor Advertising and Research 4 (1): 88–108.
- Lee, H., and C. Cho. 2019. “An Empirical Investigation on the Antecedents of consumers’ Cognitions of and Attitudes Towards Digital Signage Advertising.” International Journal of Advertising 38 (1): 97–115. https://doi.org/10.1080/02650487.2017.1401509.
- Lee, J., and M. M. Shepley. 2020. “College Campuses and Student Walkability: Assessing the Impact of Smartphone Use on Student Perception and Evaluation of Urban Campus Routes.” Sustainability 12 (23): 1–18. https://doi.org/10.3390/su12239986.
- Ma, X., C. Ma, C. Wu, Y. Xi, R. Yang, N. Peng, C. Zhang, and F. Ren. 2021. “Measuring Human Perceptions of Streetscapes to Better Inform Urban Renewal: A Perspective of Scene Semantic Parsing.” Cities 110:1–26. https://doi.org/10.1016/j.cities.2020.103086.
- Meikle, J. L. 2013. “Signs, Streets, and Storefronts: A History of Architecture and Graphics alongAmerica’s Commercial Corridors.” Technology and Culture 54 (3): 672–674. https://doi.org/10.1353/tech.2013.0089.
- Ministry of Land, Infrastructure and Transport. 2013. “Design Guidelines of Sign for the Improvement of Urban Landscape.” https://www.korea.kr/archive/expDocView.do?docId=34247.
- Murthy, R. S. 2005. “Street media: Ambient messages in an urban space.” Doctoral dissertation, Massachusetts Institute of Technology, Department of Comparative Media Studies.
- Nasar, J. L. 1990. “The Evaluative Image of the City.” Journal of the American Planning Association 56 (1): 41–53. https://doi.org/10.1080/01944369008975742.
- Noh, H. D. 2007. “A study on signboard of repair business from the lead of government: focused on improvement plans of design guideline.” Master’s Thesis, Gachon University.
- Otterbring, T., E. Wästlund, A. Gustafsson, and P. Shams. 2014. “Vision (Im)possible? The Effects of In-Store Signage on customers’ Visual Attention.” Journal of Retailing and Consumer Services 21 (5): 676–684. https://doi.org/10.1016/j.jretconser.2014.05.002.
- Paek, S. 2017. “The Entangled Everyday: Design Seoul and the Disciplining of Commercial Signs.” Journal of Asian Architecture and Building Engineering 16 (1): 139–146. https://doi.org/10.3130/jaabe.16.139.
- Petrović, B., X. Zhang, O. Eriksson, and M. Wallhagen. 2021. “Life Cycle Cost Analysis of a Single-Family House in Sweden.” Buildings 11 (5): 215. https://doi.org/10.3390/buildings11050215.
- Portella, A. 2016. Visual Pollution: Advertising, Signage and Environmental Quality. New York: Routledge.
- Portella, A. A. 2007. “Evaluating commercial signs in historic streetscapes: the effects of the control of advertising and signage on user’s sense of environmental quality.” Doctoral dissertation, Oxford Brookes University.
- Rahman, M. N., and V. Mehta. 2020. “Signage Form and Character: A Window to Neighborhood Visual Identity.” Interdisciplinary Journal of Signage and Wayfinding 4 (1): 35–48. https://doi.org/10.15763/issn.2470-9670.2020.v4.i1.a59.
- Rakestraw, M., P. Crawford, and E. Lee. 2021. “Perceptions of On-Premise Commercial Sign Regulation Codes for Beauty, Interest, and Order by Designers and Non-Designers.” Interdisciplinary Journal of Signage and Wayfinding 5 (1): 6–25. https://doi.org/10.15763/issn.2470-9670.2021.v5.i1.a76.
- Reeve, A., B. Goodey, and R. Shipley. 2007. ““Townscape Assessment: The Development of a Practical Tool for Monitoring and Assessing Visual Quality in the Built Environment.” Urban Morphology 11 (1): 25–41. https://doi.org/10.51347/jum.v11i1.3932.
- Saaty, T. L. 1980. The Analytic Hierarchy Process. NY, USA: Mcgraw Hill.
- Seo, Y., K. Kim, C. Oh, and H. Kim. 2011. “Survey of User S Satisfaction Level with the Outdoor Signboards Throughout the Signboard Improvement Project.” The Journal of the Korea Contents Association 11 (6): 215–227. https://doi.org/10.5392/JKCA.2011.11.6.215.
- Seoul Metropolitan Government. 2008. “Signboard Design Guidebook.” ebook.seoul.go.kr/Viewer/HURSCPNTS15J.
- Songpa-gu. 2017. “Songpa-Gu Urban Design Plan.” https://www.songpa.go.kr/www/contents.do?key=5707&.
- Song, M. J., and U. H. Park. 2011. “An Analysis of the Problems of the Sign After the Execution of the Improvement Project for the Sign in Seoul.” A Journal of Brand Design Association of Korea 9 (1): 212–222. https://doi.org/10.18852/bdak.2011.9.1.211.
- Tam, M. C., and V. R. Tummala. 2001. “An Application of the AHP in Vendor Selection of a Telecommunications System.” Omega 29 (2): 171–182. https://doi.org/10.1016/S0305-0483(00)00039-6.
- Taylor, C. R. 2005. “How Excessive Restrictions on Signage Backfire.” Journal of Consumer Marketing 22 (6): 304–305. https://doi.org/10.1108/07363760510623885.
- Taylor, C. R., and M. E. Sarkees. 2016. “Do Bans on Illuminated On-Premise Signs Matter? Balancing Environmental Impact with the Impact on Businesses.” International Journal of Advertising 35 (1): 61–73. https://doi.org/10.1080/02650487.2015.1059005.
- Taylor, C. R., M. Sarkees, and H. K. Bang. 2012. “Understanding the Value of On-Premise Signs as Marketing Devices to Businesses for Legal and Public Policy Purposes.” Journal of Public Policy and Marketing 31 (2): 185–194. https://doi.org/10.1509/jppm.10.054.
- Teknomo, K. 2012. “Analytic Hierarchy Process (AHP) Tutorial.” Revoledu com 6 (4): 1–20.
- Tzeng, S. Y., and T. H. Wang. 2011. “Development of an Evaluation Model for the Design of Sign Systems for University Libraries.” Journal of Asian Architecture and Building Engineering 10 (1): 109–116. https://doi.org/10.3130/jaabe.10.109.
- Wei, C. C., C. F. Chien, and M. J. J. Wang. 2005. “An AHP-Based Approach to ERP System Selection.” International Journal of Production Economics 96 (1): 47–62. https://doi.org/10.1016/j.ijpe.2004.03.004.
- Weinstein, A. C., M. Morris, D. Mace, and M. L. Hinshaw. 2002. “Legal Issues in the Regulation of On-Premise Signs.” Law Faculty Contributions to Books 220. https://engagedscholarship.csuohio.edu/fac_book_contributions/220.
- Xiangmin, G., C. Weiqiang, L. Tiantian, and H. Shumeng. 2022. “Research on Dynamic Visual Attraction Evaluation Method of Commercial Street Based on Eye Movement Perception.” Journal of Asian Architecture and Building Engineering 21 (5): 1779–1791. https://doi.org/10.1080/13467581.2021.1944872.
- Yu, E., and H. Park. 2019. “Analysis of Competitiveness Factors of Small and Medium-Sized Ports Using AHP Method: Focused on Comparison Between Daesan and Pyongtaek, Dangjin Ports.” Journal of Management & Economics 41 (1): 155–183. https://www.dbpia.co.kr/Journal/.