
ABSTRACT
The existing research on waterfront tour route planning suggests that thermal comfort assessment has a direct impact on people’s outdoor tour experiences. It contributes to understanding the thermal comfort regulation mechanisms of landscape nodes and the scientific planning of tour routes. However, the research in this area is relatively limited and faces complex issues in data processing and analysis. This study takes the West Lake waterfront tour route in Hangzhou, China, as an example. Through empirical research, it validates the feasibility of tour route planning guided by thermal comfort. It employs field surveys, on-site measurements, and data analysis methods primarily based on the Rayman software to explore the relationship between urban outdoor waterfront spaces and microclimates. The study reveals the following findings: (i) Extensive water bodies surrounding an area positively regulate local microclimates. The closer one is to the water and the more water surrounds the area, the stronger the microclimate effect. (ii) Factors such as spatial openness, waterfront orientation, prevailing monsoons, etc. all have certain impacts on the microclimates of the lake and lakeside spaces. (iii) Air temperature has significant variability in its impact on human thermal comfort, with different PET (Physiological Equivalent Temperature) values at each measurement point during different time periods. The study combines the actual human thermal comfort conditions at eight measurement points around the lake with existing tour routes. It proposes two practical tour route optimization designs based on real tour microclimate factors. These designs employ thermal comfort assessment methods to effectively enhance and improve human thermal comfort during tours. This research carries social value and provides new insights for mitigating urban waterfront space microclimates, enhancing tour comfort, and improving landscape environments.
1. Introduction
The escalating global climate change crisis, characterized by frequent extreme weather events and intensifying urban heat island effects, poses a significant threat to human survival and well-being, encompassing adverse impacts on health, ecosystems, society, and the economy, prompting extensive research into Urban Heat Mitigation and Adaptation from various perspectives (Bao-Jie He, Sharifi, and Liu Citation2023; Bao-Jie He, Zhu, and Qi Citation2022, Citation2022). The layout of urban waterfront spaces is closely related to the microclimate environment. Due to the large heat capacity and evaporation latent heat of water bodies and the small reflection rate of water surface, a special microclimate is usually formed over water bodies, which has geographical, seasonal, diurnal, and nocturnal influences on the temperature, relative humidity, and wind speed of the surrounding environment (Yu & Yan, Citation2022). The impact of such water bodies on thermal comfort will act on the human body in an independent or cumulative form, affecting human thermal comfort. Therefore, under the global and regional climate background, it is imperative to conduct research on thermal comfort in the context of the wind-heat-moisture environment, combined with meteorological factors of urban waterfront spaces and human comfort, to guide outdoor tourism in summer and ultimately promote systemic environmental efficiency (Mei and Xu Citation2022).
Thermal comfort assessment is an interdisciplinary field involving meteorology, geography, landscape planning, environmental behavior, and other disciplines. Its main research content includes the thermal comfort assessment of functional places such as urban landscapes, green spaces, and scenic gardens. Outdoor thermal comfort assessment is particularly important because it directly relates to the livability of cities and the comfort of tourists (Cohen, Potchter, and Matzarakis Citation2013). Meanwhile, tourist route design is indispensable to tourism planning (Lin and Matzarakis Citation2008). However, less research scientifically incorporates thermal comfort assessment into the design of urban waterfront tourism routes (Zhang et al. Citation2019). Currently, the interdisciplinary nature of tourist route design is already apparent. Therefore, starting from the perspective of human perception, exploring the impact of thermal comfort assessment on urban waterfront tourism routes (Salata et al. Citation2017), the research results will help researchers and landscape designers to further understand the environmental thermal comfort regulation mechanism of various landscape nodes (Yang, Dong, and Li Citation2019), and provide theoretical support and feasible suggestions for design practices, especially for the optimization design of waterfront tourism routes.
In recent decades, research on microclimates and outdoor spaces has attracted the attention of many scholars. In the realm of urban waterfront space research, the urban heat island effect exerts a certain influence on outdoor waterfront areas. During the summer season, the cooling effect of water is more pronounced in the afternoon than in the morning. This effect is particularly noticeable between 12:00 and 15:00. Water bodies can enhance the outdoor comfort during summer, and this can be achieved by incorporating more green vegetation in proximity to water bodies, reducing artificial surfaces and building density. These measures effectively elevate microclimate comfort (Yanyan Cheng et al. Citation2022). In terms of sightseeing routes, Yu Wang and Bao-Jie He take into account human thermal comfort, health, and safety considerations. They enhance people’s adaptability by investigating the walkability within a 15-minute urban radius. Additionally, they have developed a Dynamic Attenuation Model (Tan et al., Citation2007) for thermal stress, aimed at prolonging and alleviating thermal comfort issues (Yu and Edition, Citation2022).Bin-Yi Liu reviewed the impact of climate, personal, and spatial factors on urban public spaces, emphasizing that thermal comfort is an important aspect to evaluate urban public spaces. Thermal comfort in urban spaces should be evaluated from multiple perspectives, and research findings from different climate zones should not be directly applied to other areas (Liu and Dongxue, Citation2017). Meanwhile, many scholars have conducted research on the combination of thermal comfort assessment and the tourism industry. Kahina Labdaoui and Said Mazouz developed a measurement tool for street walkability and thermal comfort index (SWTCI) evaluation through questionnaire surveys, observations, and field measurements (air temperature, wind speed, and relative humidity), which focuses on the comfortable facilities and physiological equivalent temperature (Bartelt et al., Citation2011) at the street scale, identifies problems, and proposes improvement suggestions to make streets ideal for walking and comfortable (Labdaoui et al. Citation2021). S.Y. Chan and C.K. Chau revealed the relationship between the factors affecting the thermal comfort and acceptability of urban parks and discussed the psychological effects of the perception of the number of park environmental features and the instantaneous visibility of park features on thermal comfort and acceptability (Chan, Chau, and Leung Citation2017). Y Peng and T Feng used on-site measured data to conduct path analysis to capture the direct and indirect effects of various factors on comfort and finally concluded that the use of objective indicators and personal subjective factors is the basis for fully capturing the actual comfort of urban public spaces (Peng et al. Citation2019; Mei, Y.and L. Xu, Citation2023). JK Vanos and E Kosaka evaluated the potential impact of extremely high temperatures on marathon routes and further explored various factors affecting human thermal comfort under the influence of urban design and vegetation, such as solar radiation and airflow (Vanos et al. Citation2019). Jacob A. Lachapelle applied a newly developed TUF-pedestrian model to quantify the impact of summer pedestrian sidewalk tree coverage on pedestrians in mid-latitude urban low-level communities, capturing the detailed temporal and spatial variations of direct shade and directional long-wave radiation load caused by tree shade on pedestrians, and proposed that trees should be distributed relatively evenly on sunny sidewalks (Lachapelle et al. Citation2023).
In summary, given the escalating crisis of extreme heat in the summer, research in the field of thermal comfort assessment for urban waterfront spaces is crucial. It can help address the shortcomings in understanding the impact of microclimates, water bodies, and urban waterfront space design on human well-being. Furthermore, integrating thermal comfort assessment into tourism route design can enhance the overall tourist experience and contribute to the sustainability of urban waterfront areas. However, there are deficiencies in existing tour routes both in theoretical research and practical application. On one hand, there is a lack of theoretical research, and on the other hand, insufficient details are provided in research methods to explain how these methods are applied, such as data collection and analytical techniques. This lack of clear methodology hinders readers’ understanding of the research process. Therefore, thermal comfort assessment can be used to fill these gaps. Thermal comfort assessment methods play a significant and supportive role in the planning and design of summer waterfront tourist routes, and the relationship between the two is quite close. The main purpose of this study is to investigate and analyze the optimization of tourist routes in the waterfront space of the top ten scenic spots of West Lake in Hangzhou under the evaluation of thermal comfort and provide scientific reference for the design of tourist routes and sightseeing paths in urban waterfront spaces and waterfront parks. For this research goal, this paper proposes the following two main research questions:
What are the diurnal variations in thermal comfort values in different waterfront spaces? (lake and lakeside)
How to use thermal comfort assessment methods scientifically to select and optimize tourist routes?
2. Research methods
2.1. Research site and measurement locations
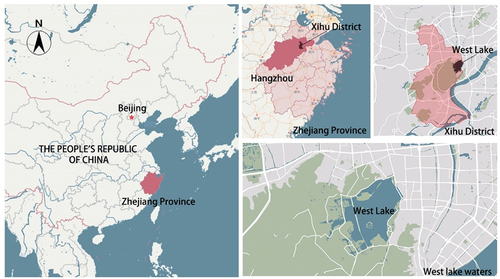
The research site of this paper is West Lake, Hangzhou, China, which is located in the West Lake Scenic Area of Hangzhou, Zhejiang Province, China (). Hangzhou is the capital and economic, cultural, and scientific center of Zhejiang Province, as well as an important scenic tourist city. Its geographical coordinates are between 29°11′N − 30°34′N and 118°20′E − 120°37′E, and it has a subtropical monsoon climate with distinct seasons, abundant sunshine, plentiful rainfall, short spring and autumn, and long winter and summer. In 2022, the average temperature in Hangzhou was 18.2℃, which was 1.0℃ higher than the same period of the previous year; the average precipitation was 1340.8 mm, which was 12.3% less than the same period of the previous year; the total sunshine hours were 1765 hours, which increased by 157 hours compared with the previous year. The prevailing wind direction is the southeast monsoon, with a maximum wind speed of 3.14 m/s and an average wind speed of 1.3 m/s during the measurement period.
Figure 1. Location map of West Lake area in Hangzhou.
Due to its prominent universal value and representativeness, the “Ten Scenes of West Lake” is the most popular and iconic landscape in Hangzhou, and was chosen as the measurement site for this study. The “Ten Scenes of West Lake” were created during the Southern Song Dynasty (13th century), revived during the Yuan and Ming Dynasties (14th-16th centuries), and consolidated into the “Four-character Scene” series during the Qing Dynasty (17th-19th centuries). The ten scenes are: “Melting Snow at Broken Bridge, Autumn Moon over the Calm Lake, Spring Dawn at Su Causeway, Orioles Singing in the Willows, Lotus in the Breeze at the Crooked Courtyard, Viewing Fish at Flower Harbor, Sunset Glow at Leifeng Pagoda, Evening Bell at Nanping Hill, Twin Peaks Piercing Clouds, Three Pools Mirroring the Moon”. After field investigations, it was found that “Twin Peaks Piercing Clouds” and “Three Pools Mirroring the Moon” were not suitable as measurement sites for this study. Firstly, “Twin Peaks Piercing Clouds” is located about 1000 meters away from the West Lake, and is relatively less affected by the water area. Secondly, considering factors such as the opening hours of the scenic area, transportation methods, and measurement costs, “Three Pools Mirroring the Moon” was not chosen. Therefore, the measurement sites for this study are the “Ten Scenes of West Lake” excluding “Twin Peaks Piercing Clouds” and “Three Pools Mirroring the Moon”, which consist of eight measurement points ( and ).
Figure 2. Distribution map of “Ten Scenes of West Lake” and measuring points.
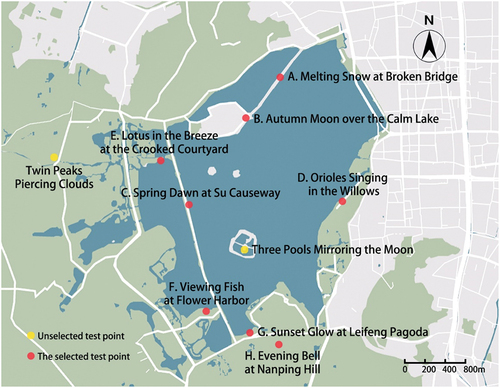
Table 1. Basic spatial characteristics of each measurement point.
2.2. Instrumentation and time of field measurement
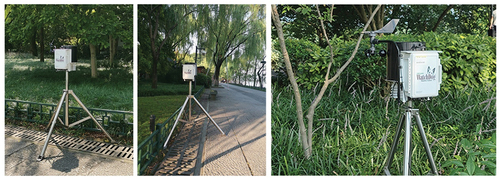
The American-made WatchDog 2900ET automatic weather station was used for field measurement, which is capable of accurately measuring multiple meteorological parameters such as temperature, humidity, wind speed, and rainfall. To ensure the accuracy of the research results, typical clear or slightly cloudy days in summer were selected to avoid the impact of small climatic factors such as temperature and humidity caused by cloudy and rainy weather. Field measurements were conducted at eight sites simultaneously for three consecutive days from July 28 to 30 July 2022, with specific measurement times from 6:30 a.m. to 7:00 p.m. each day, and a total duration of 12 hours of testing per day. The WatchDog 2900ET automatic weather station was fixed on a tripod about 1.5 meters above the ground and level with the chest to ensure that the measurement data was not affected by other factors such as the underlying surface and water body, ensuring high-precision measurement data (). Due to the fact that the measurement sites are located within the West Lake Scenic Area in Hangzhou, where the cultural landscape is designated as a UNESCO World Heritage site, the internal management of the West Lake Scenic Area is rigorously enforced. Moreover, with a high daily influx of tourists, placing meteorological stations directly on the pedestrian pathways would impede pedestrian traffic and the passage of sightseeing vehicles. Therefore, for the selected measurement points, some meteorological station sensors were placed on the lawns near pedestrian pathways.
Figure 3. Placement of meteorological station.
2.3. Subjective evaluation questionnaire survey of thermal comfort
The subjective thermal sensation of the human body is closely related to objective thermal comfort. The role of the questionnaire survey is to extract the subjective feelings and thermal sensation evaluations of tourists, but it is subjective and unstable, making it difficult to quantify and control (Yao and Edition, Citation2021; Vitt, R. and A. Gulyas, Citation2015). In this study, the clothing and dress obtained from the questionnaire survey can be used as data to calculate Rayman’s clothing insulation coefficient (clo), thereby further supporting the objective analysis of human thermal sensation based on digital platforms, to improve the scientific and comprehensive nature of the study.
The questionnaire content is divided into two parts: the first part includes basic information such as gender, age, and clothing; the second part is the comfort perception survey, which includes thermal sensation vote (TSV) and thermal comfort vote (TCV). Thermal sensation vote represents the subjective evaluation results of a person’s cold and hot perception of the surrounding environment. Based on the 7-level scale (cold, cool, slightly cool, neutral, slightly warm, warm, hot, with values ranging from −3 to 3) in the American Society of Heating, Refrigerating and Air-Conditioning Engineers (ASHRAE) specifications, thermal sensation vote is selected. The humidity perception is voted on a 5-level scale (dry, slightly dry, neutral, slightly humid, humid, with values ranging from −2 to 2), and the wind perception is voted on a 5-level scale (no wind, light wind, gust, strong wind, gale, with values ranging from −2 to 2). Thermal comfort vote uses a 5-level scale (extremely uncomfortable, uncomfortable, neutral, comfortable, very comfortable, with values ranging from −2 to 2) for selection.
2.4. Thermal comfort assessment indicators and calculation methods
The UTCI and PET are presently two extensively employed thermal comfort assessment indices known for their high accuracy. In the comparison of their suitability for outdoor application, some studies have suggested that PET might be better suited for evaluating outdoor thermal comfort. Numerous investigations contend that the UTCI standard exhibits substantial variations across diverse climatic zones, which contradicts the assertion of its general applicability to various climates. For instance, Jin Hong et al. investigated thermal comfort along two urban pedestrian streets in Harbin and observed that the original UTCI threshold was unsuitable for the city (Yu and Edition, Citation2022; Wang, Y. and B. J. He, Citation2022). Additionally, Nie Ting et al., through experimental analysis, determined that the probability of correctly interpreting outdoor thermal comfort in cold regions using UTCI and PET stood at 74.2% and 75.1%, respectively, with PET holding a slight advantage (Ting Nie et al. Citation2022).
In this study, the Physiological Equivalent Temperature (Bartelt et al., Citation2011) was selected as the thermal comfort assessment indicator for urban outdoor waterfront spaces. PET is based on the Munich Personal Energy Balance Model and represents the physiological balance temperature under specific environmental conditions (Manavvi and Rajasekar Citation2022; Wu, Z.-F., and L.-D. Chen, Citation2016). PET value equals the air temperature under typical indoor conditions (Tmrt = air temperature, wind speed = 0.1 m/s) when the outdoor thermal state is the same (the same core and surface temperature) (Liu, Zhang, and Deng Citation2016; Mayer and Hoppe Citation1987). Unlike other climate indicators, PET considers not only objective indicators such as temperature, humidity, and wind speed, but also individual physiological status indicators such as height, weight, age, clothing index, and activity level. The higher the PET value, the hotter the weather, providing an evaluation of climate impact on human thermal state, commonly used for outdoor thermal comfort assessment (Davtalab et al. Citation2020). shows the corresponding range of PET evaluation and thermal comfort level (Liu and Planners, Citation2017).
Table 2. Correspondence between PET evaluation and thermal comfort.
This article selects three main meteorological factors in thermal comfort assessment: air temperature (Ta, ℃), relative humidity (RH, %), and wind speed (v, m/s). Currently, Rayman is a commonly used software for calculating PET. In the software panel, input the measurement date, altitude and longitude of each measuring point, human factors, clothing thermal resistance coefficient, and meteorological factor values during different time periods to obtain the PET value at different time points of the relevant measuring points. Based on the questionnaire survey and results, the body parameters are set at the conventional level, including gender, age, height, weight, clothing, activity, and status (male, 35 years old, 1.75 m, 75 kg, 0.5 clo, 80 W and standing).
3. Results and analysis
3.1. Results and analysis of microclimate measurements at various points
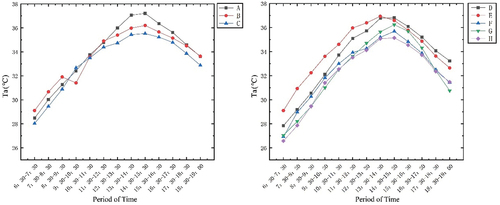
Currently, most studies consider that the thermal environment is the main cause of the impact on the climate environment. In this study, the heat source of the thermal environment is the air temperature. The average daily variation trend of air temperature at each measurement point during the three test days in summer was consistent, with the measured air temperature ranging from 26.58 to 37.21℃ (). The maximum value (37.21℃) occurred between 14:30–15:30 at point A, and the minimum value (26.58℃) occurred between 6:30–7:30 at point H. Comparing the daily average temperatures at the lake (points A, B, C) and the lakeside (points D, E, F, G, H), it can be seen that the air temperature at the lake measurement points is significantly higher than that at the lakeside measurement points during the morning period of 6:30–7:30. In the evening period of 18:30–19:00, the air temperature at the lake measurement points is slightly higher than that at the lakeside measurement points. The contrast between point A (28.48℃, 33.61℃) and point D (27.85℃, 33.24℃) is particularly significant, indicating that the measurement points at the lake have a positive effect on microclimate regulation due to the surrounding water body. The closer the measurement points are to the water body and the larger the water body area, the stronger the microclimate effect is, which helps to balance the environmental temperature during the day and night.
Figure 4. Mean air temperature at each measurement point.
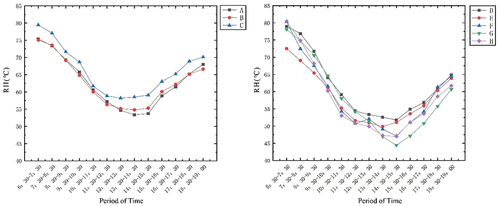
Relative humidity of air has no direct effect on the heat load applied to the human body, but it can affect the efficiency of heat dissipation through sweating on the surface of the body due to its evaporative effect on the air, thus achieving the effect of changing human thermal comfort (Labdaoui et al. Citation2021). During the three test days in summer, the relative humidity values of each measuring point ranged from 44.45% to 80.45% (). By comparing the relative humidity values of the measuring points in the lake and on the lakeside, it can be seen that the average relative humidity of the measuring points in the lake is significantly higher than that of the lakeside measuring points during the morning and evening periods. However, during the noon period, the average relative humidity of the measuring points in the lake is lower than that of the lakeside measuring points, indicating that the diurnal range of relative humidity at the measuring points in the lake is smaller than that of the lakeside measuring points. This is mainly due to the fact that the measuring points in the lake are adjacent to the water and surrounded by water. As the temperature rises, the water evaporates faster, so the relative humidity is higher than that of the lakeside measuring points at noon. At the same time, the lakeside measuring points are adjacent to the embankment, and the linear channels on the shore promote the enhancement of airflow in the local area, making it difficult for water vapor to remain and condense. Therefore, the relative humidity of the lakeside measuring points is lower than that of the measuring points in the lake. Comparing the relative humidity of the measuring points in the lake, it can be seen that measuring point C is significantly higher than measuring points A and B, which are influenced by its enclosed spatial features and the combination of trees and grass. The higher vegetation coverage at measuring point C improves the microclimate adaptability of the site.
Figure 5. Mean relative humidity of each measurement point.
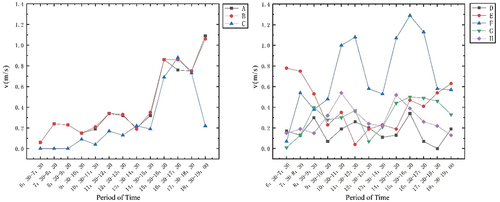
The wind environment includes the wind volume, wind direction, and wind speed (including average wind speed and gust wind speed) within a space, which is the most variable and complex category in the microclimate environment, with the characteristics of variability, difficulty in capturing, and unpredictability (Reynolds Citation1997). The wind speed is the main aspect of the wind environment analyzed in this study. During the three testing days in summer, the air wind speed range at each measuring point was 0 ~ 1.29 m/s (), and there were differences in the daily average wind speed variation trend at each measuring point. The maximum wind speed value appeared at measuring point D between 15:30 and 16:30, with a value of 1.29 m/s. Comparing the daily average wind speed variation at measuring points in the lake and lakefront areas, it was found that the wind speed in the lake area was more stable and had a smaller fluctuation range. This was because the measuring points in the lake area were less affected by the airflow from the land, and the local wind environment and microclimate were more stable. Meanwhile, the average wind speed values at measuring points A (0.42), B (0.43), E (0.41), and F (0.71) were significantly higher than those at measuring points C (0.25), D (0.16), G (0.30), and H (0.28), which was due to the influence of the prevailing north-south monsoon. The average wind speed values at measuring points A, B, and E on the south waterfront and measuring point F on the north waterfront were higher, with more obvious fluctuations. The measuring points C, D, G, and H on the east and west waterfronts were less affected by the prevailing monsoon. Measuring point C had a higher vegetation coverage, which led to lower average wind speed values and smaller fluctuation ranges compared to measuring points A and B, which were also in the lake area. This indicates that there is a correlation between wind speed and waterfront form, prevailing monsoon, and vegetation coverage.
Figure 6. Mean wind speed of each measuring point.
3.2. Results and analysis of subjective evaluation questionnaire on thermal comfort
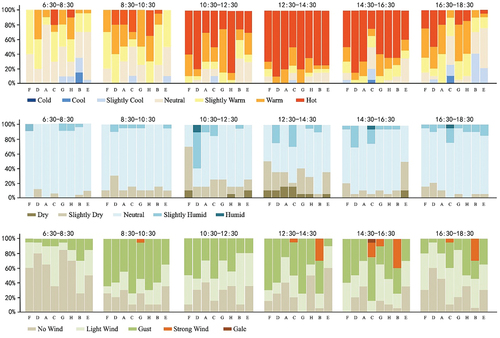
Tourist visitors were selected as the survey subjects at various measurement points, with a total of 526 questionnaires distributed and 508 valid questionnaires returned. The TSV survey results are shown in , indicating a clear valley distribution of human thermal sensation in summer, while the changes in humidity sensation and wind sensation are relatively weak with a single peak. The indices for “heat” and “hotness” are concentrated between 10:30–16:30 and 12:30–14:30, reaching their peak at measurement point D, which is particularly hot. During other time periods, the thermal sensation is mainly in the comfort range. The “dry” and “humid” sensations of humidity are concentrated between 10:30–16:30 and 10:30–18:30 respectively, with the most representative measurement points being A and C. As for wind sensation, “strong wind” and “gale” are concentrated between 12:30–18:30, with measurement point B having the strongest wind sensation.
Figure 7. Thermal sensation vote (TSV) results at different measurement points.
3.3. Human thermal comfort results and analysis
The measured values of the summer microclimate factors at each measurement point were imported into the Rayman software to calculate and summarize the PET values at each point. The trend of microclimate comfort change at each measurement point, both in the lake and along the lakeshore, showed a unimodal variation (). The differences in microclimate comfort change were relatively small, with PET values mainly in the range of “slightly warm” to “hot”, and no measurement points were within the “comfortable” range. Among all the measurement points, 4.81% were “slightly warm”, 9.62% were “warm”, 9.62% were “hot”, and 75.96% were “hot and humid” (). From the graph, it can be seen that the comfort indices of the various measurement points in the lake and along the lakeshore fluctuated greatly during the period of 10:30–15:30, with obvious differences. The comfort index values of the measurement points in the lake ranged from 28.52 to 57.92, with a relatively concentrated distribution and small fluctuations. Of these, 0.96% were in the “slightly warm” range, 28.85% were in the “hot and humid” range, and 3.85% were in the “warm” and “hot” ranges. The comfort index values of the measurement points along the lakeshore ranged from 26.86 to 59.2, with a relatively dispersed distribution and large fluctuations. Of these, 3.85% were in the “slightly warm” range, 47.11% were in the “hot and humid” range, and 5.77% were in the “warm” and “hot” ranges.
Figure 8. Mean PET values of each measurement point.
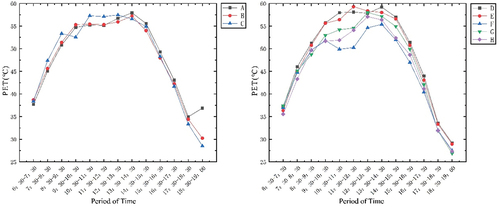
Table 3. Distribution of thermal comfort.
From the proportion of PET values of each measuring point in the lake and lakeside, it can be seen that the overall comfort index is higher, and the majority of measuring points that reach the hot scorching range are lakeside open space measuring points. The main reason is the high temperature caused by the large area of solar radiation. The measuring points located in the lower comfort range are half-open space measuring points surrounded by water in the lake, mainly due to the influence of water morphology, vegetation coverage and other factors. Comparing the PET values of measuring points in the two types of spatial forms of the lake and lakeside, the proportion in the slightly warm and warm ranges is 4.81% less in the lake than in the lakeside measuring points, and the proportion in the hot scorching ranges is 20.18% less in the lake than in the lakeside measuring points. Therefore, when tourists visit, they will generally feel more comfortable in the measuring points in the lake than in the lakeside measuring points.
4. Selection of tourist routes based on changes in thermal comfort index
4.1. Daytime variation of PET index at different measurement points
Eight measurement points were found to have a considerable amount of time in the “Very hot” range, with some periods falling into the “Warm”, “Slightly warm”, or “Hot” range. Therefore, according to the discomfort range of each measurement point (PET falls within the “Hot” and “Very hot” range) and the relatively comfortable range (PET falls within the “Warm” and “Slightly warm” range), the PET total values of each measurement point were sorted as follows: F<H<G<B<C<E<A<D. Relatively speaking, measurement points with high PET total values have a more obvious sensation of being “Very hot”, while measurement points with low PET total values do not have a clear sensation of being “Very hot”. shows the details.
Table 4. Average PET values of each measurement point.
Looking at the average PET values of each measuring point at different time periods can reflect the microclimate comfort situation at different times. As discussed above and shown in , the measuring points with better microclimate comfort from 6:30 to 7:30 are H, E, F, and D; from 7:30 to 8:30 are H, F, E, and A; from 8:30 to 9:30 are G, H, F, and E; from 9:30 to 10:30 are H, F, C, and G; from 10:30 to 11:30 are F, H, G, and A; from 11:30 to 12:30 are F, H, G, and A; from 12:30 to 13:30 are F, B, A, and H; from 13:30 to 14:30 are F, H, C, and G; from 14:30 to 15:30 are F, H, B, and C; from 15:30 to 16:30 are F, B, C, and H; from 16:30 to 17:30 are F, H, C, and G; from 17:30 to 18:30 are G, H, F, and E; from 18:30 to 19:00 are G, H, F, and C (). This conclusion can provide a basis for the optimization of subsequent sightseeing routes.
Table 5. Ranking of PET Mean values at different measurement points during various time periods.
By using the PET average value, the degree of microclimate comfort of different spatial structures at each measurement point can be reflected. Considering that the PET average value of each point is greater than 47.71, the higher the value, the lower the microclimate comfort degree. The comfort level ranking is F < H < G < B < C < E < A < D. According to the ranking, it can be seen that F and H have a relatively good perception of microclimate thermal comfort overall (as shown in ). The magnitude of PET standard deviation at each measurement point during the test period reflects the stability of microclimate comfort with different spatial structures. The larger the change in PET, the worse the stability of microclimate comfort. As shown in , the stability ranking of microclimate comfort at each measurement point is A < F < B < H < C < G < D < E. According to the ranking, it can be seen that A and F have better stability in terms of microclimate comfort.
Figure 9. PET average values at each measurement point.
Figure 10. PET standard deviation at each measurement point.
4.2. Principles of tourist route design
According to Chen Qiyue’s definition, tourist routes refer to the trajectory of tourists during their travel (College Citation2003). Tourist routes play an important role in tourism and have a certain impact on the healthy development of the tourism industry (Suai Citation2021). Based on the perception of thermal comfort, designing new tourist routes for the scenic area to provide tourists with a new perspective on travel is another form of optimizing tourist routes. However, scholars have not yet given a unified method and principle for the optimization of tourist routes due to their different research directions and academic backgrounds. To organize tourist routes scientifically, factors such as the age structure level of tourists and their preferences for stopping points should be considered, and the following principles should be met: (1) reasonable time arrangement, avoiding backtracking; (2) reasonable arrangement of travel rhythm; and (3) considering the needs of most tourists and providing a clear and specific reference route.
The tourist route proposed in this study is an optimized form based on the evaluation of thermal comfort, and is formed based on the existing evaluation system and objective measurement data. It takes into account different modes of travel and provides tourists with a better tourism experience in terms of thermal environment perception, forming a representative and unique route.
4.3. Tour route plans
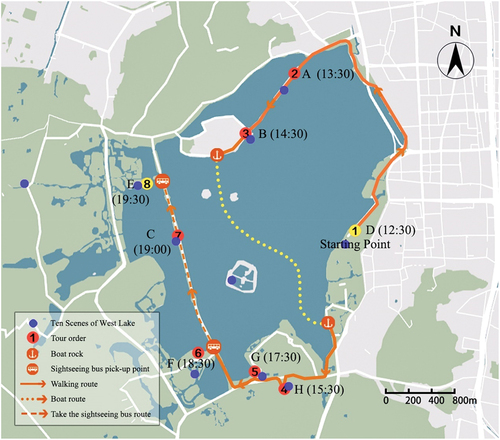
By investigating the popular tour routes of West Lake, the well-known Chinese travel website Ctrip was selected, which provides comprehensive travel services including travel information. Four tour routes were summarized as follows ():
Figure 11. Tour route plans.
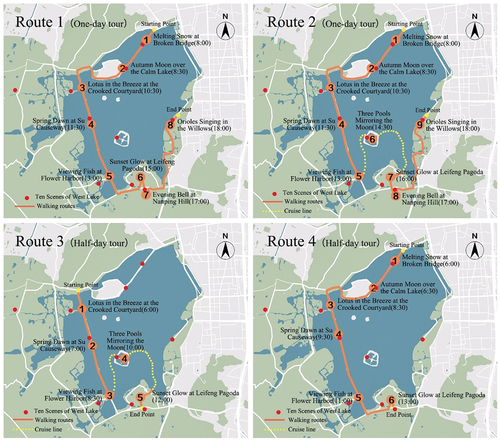
Quantitative supplements were applied to four distinct routes, with a comprehensive elucidation of the distances, modes of exploration, points of interest en route, time requirements, and minimum thermal comfort indices provided through a structured tabular presentation(). The time required for exploring points of interest along the route was derived from the sum of official recommended durations for site visitation within the scenic area and the walking or boating time corresponding to the segment’s distance. The minimum thermal comfort index was ascertained through empirical measurements of the Physiological Equivalent Temperature (Bartelt et al., Citation2011) during the designated timeframe at the measurement points.
Table 6. Each section planning standard quantification table.
4.4. Tour route optimization design
4.4.1. Optimization design for route 1
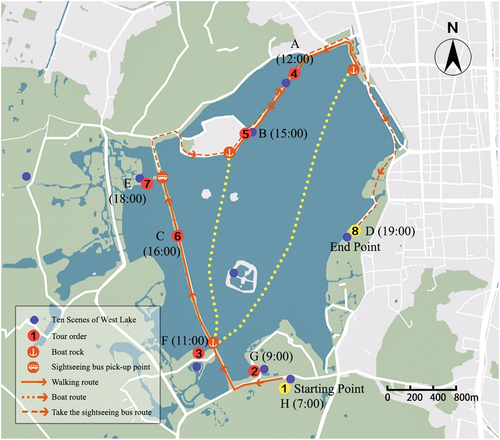
Based on the analysis of the PET average values at different measuring points during summer, we sorted the PET average values of different measuring points at different times to indicate the heat comfort level at each point. Then, we selected the measuring points with relatively lower PET values (i.e., better heat comfort feeling) at each time period to form an optimized tour route. For Route 1, we selected the measuring points H, G, F, A, B, C, E, and D in chronological order according to the PET average value ranking at each time period. This optimized design route is suitable for tourists who want to visit the “Ten Scenes of West Lake” and its surrounding attractions and make a full circle around the lake. The route includes three transportation modes: walking, sightseeing bus, and boat, which allows tourists to visit the main attractions of the West Lake area within a day. However, there are some repeated sections and attractions, which may not be conducive to the distribution of tourists and the revenue of the scenic area. It does not achieve the integration of all attractions without omissions and repeats, and therefore lacks universality ().
Figure 12. Optimized design route 1.
4.4.2. Optimization design for route 2
The optimization method for Route 2 is to concatenate the PET averages of measurement points D, A, B, H, G, H, B, and E in each time period in order (as shown in ). This optimized route is suitable for tourists who want to visit the “Ten Scenes of West Lake” and surrounding attractions within half a day, while also taking a lap around the lake. The route includes three modes of transportation: walking, sightseeing bus, and rowing boat or paddle boat, which ensures that all scenic spots along the route are covered without any repetition or omission. It is relatively more reasonable than Route 1.
Figure 13. Optimized design route 2.
5. Conclusion and future outlook
This study explores the spatial characteristics of eight measuring points within and around the ten scenic spots of West Lake in urban outdoor waterfront spaces. This region has the longest tourist stay time and the highest pedestrian flow rate. Combined with the measured meteorological factors, the relationship between the hot and humid environment and human comfort is analyzed, with the aim of providing a basis for the optimization design of the travel routes based on the evaluation of thermal comfort. The results of the measurement and analysis show that: (1) The large area of water surrounding the area has a positive regulating effect on the local microclimate, and the closer to the water, the stronger the microclimate effect. The bank form and vegetation greening also have a certain influence on the evaluation of thermal comfort; (2) Different open space characteristics of measuring points within and around the lake, due to the increase in temperature at noon, most of the human comfort is in the hot scorching interval or the boundary area. The influence of trees on both sides shading, open space scale, waterfront orientation, and prevailing monsoon has a certain impact on human thermal comfort in the lake and lakeside space; (3) The influence of air temperature on thermal comfort assessment has a significant difference. During the period of 6:00–10:30 AM, G and H have a more comfortable PET value. During the period of 10:30 AM to 3:30 PM, F is more comfortable, and during the period of 3:30 PM to 7:00 PM, D and A feel uncomfortable with human thermal comfort, and the PET values at each measuring point are different at each time interval.
Based on the thermal comfort assessment system and objectively measured data, this paper defines and explains the definition and design principles of travel routes, proposes two specific optimized route plans of Route 1 and Route 2 as practical results. The optimized travel routes aim to provide practical suggestions for tourists and park managers, have practical significance for enhancing the tourist experience and park management strategies, and provide new ideas for the evaluation of thermal comfort and the update of travel routes in urban outdoor waterfront spaces in summer.
The conclusions drawn from this study regarding the relationship between urban waterfront space characteristics and thermal comfort in the context of tour routes are insightful. However, certain limitations persist, such as the incomplete monitoring of microclimate elements and the absence of an investigation into visitor behaviors. Subsequent research should enhance the monitoring of microclimate elements and analyze their correlation with visitor tour behaviors. This will facilitate a more comprehensive understanding of the microclimatic impact on urban outdoor waterfront tour routes, ultimately contributing to their refinement.
6. Suggestions and insights
Waterfront space planning based on microclimate heat adaptation requirements presents certain design complexities. In order to enhance the effectiveness of heat-adaptive design for urban outdoor waterfront spaces and to provide visitors with a thermally comfortable experience during their tours, it is essential to systematically integrate waterfront landscape design elements, judiciously select and apply design features, and strategically plan tour routes based on thermal comfort and the desired duration of visits. Employing computer simulation software, it is possible to construct a microclimate simulation model for waterfront landscapes, giving due consideration to the physical factors that influence thermal comfort. Ensuring the positive contribution of these physical elements to enhancing thermal comfort in waterfront spaces becomes pivotal, thereby alleviating outdoor heat discomfort for individuals during high-temperature summer conditions and fostering overall improvement in the urban ecological environment.
Ethics approval
This study involved human/animal subjects, but did not require ethical approval. We followed strict ethical guidelines and principles to protect the rights of the participants, including privacy and confidentiality, informed consent, and data protection. We obtained the consent of the participants and ensured the confidentiality and privacy of all data.
Availability of data and material
The datasets used and/or analyzed during the current study are available from the corresponding author on reasonable request.
Disclosure statement
No potential conflict of interest was reported by the authors.
Additional information
Funding
Notes on contributors
Yi Mei
Yi Mei Doctor of Landscape Architecture, School of Architecture and Urban Planning, Tongji University, Member of China Society of Landscape Architecture. He is currently the director of the Undergraduate Special Office and deputy Director of the Department of Environmental Design, School of Design and Architecture, Zhejiang University of Technology. The research direction is landscape architecture planning and design, landscape architecture experience, published 1 monograph, published more than 20 papers, presided over and participated in 7 provincial and ministerial level research projects, design a number of domestic and foreign landscape projects.
Yuhang Han
Yuhang Han The corresponding author of this article. Master degree in Environmental Design, School of Design and Architecture, Zhejiang University of Technology.
Dan Han
Dan Han Doctor of Urban Forestry, Chinese Academy of Forestry. His research interests include plant landscape planning and design, urban biodiversity conservation, urban forest planning and design.
Junke Lu
Junke Lu Master degree in Environmental Design, School of Design and Architecture, Zhejiang University of Technology.
Lili Xu
Lili Xu Master degree in Environmental Design, School of Design and Architecture, Zhejiang University of Technology.
References
- Bao-Jie He, W. W., A. Sharifi, and X. Liu. 2023. “Progress, Knowledge Gap and Future Directions of Urban Heat Mitigation and Adaptation Research Through a Bibliometric Review of History and Evolution.” Energy & Buildings 287:112976. https://doi.org/10.1016/j.enbuild.2023.112976.
- Bao-Jie He, J. W., J. Zhu, and J. Qi. 2022. “Beating the Urban Heat: Situation, Background, Impacts and the Way Forward in China.” Renewable and Sustainable Energy Reviews 161:112350. https://doi.org/10.1016/j.rser.2022.112350.
- Bartelt, A., O. T. Bruns, R. Reimer, H. Hohenberg, H. Ittrich, K. Peldschus, and J. Heeren, U. I. Tromsdorf, H. Weller, C. Waurisch, A. Eychmüller. 2011. “Brown Adipose Tissue Activity Controls Triglyceride Clearance.” Nature Medicine 17 (2): 200–205. https://doi.org/10.1038/nm.2297.
- Chan, S. Y., C. K. Chau, and T. M. Leung. 2017. “On the Study of Thermal Comfort and Perceptions of Environmental Features in Urban Parks: A Structural Equation Modeling Approach.” Building & Environment 122:171–183. https://doi.org/10.1016/j.buildenv.2017.06.014.
- Cohen, P., O. Potchter, and A. J. A. G. Matzarakis. 2013. “Human Thermal Perception of Coastal Mediterranean Outdoor Urban Environments.” Applied Geography 37:1–10. https://doi.org/10.1016/j.apgeog.2012.11.001.
- College, Q. C. 2003. “Tourists’ Choice of Tour Route.“ Journal of Zhenjiang College 16 (2): 3.
- Davtalab, J., S. P. Deyhimi, V. Dessi, M. R. Hafezi, and M. Adib. 2020. “The Impact of Green Space Structure on Physiological Equivalent Temperature Index in Open Space.” Urban Climate 31:100574. https://doi.org/10.1016/j.uclim.2019.100574.
- Labdaoui, K., S. Mazouz, M. Moeinaddini, M. Cools, and J. Teller. 2021. “The Street Walkability and Thermal Comfort Index (SWTCI): A New Assessment Tool Combining Street Design Measurements and Thermal Comfort.” Science of the Total Environment 795:148663. https://doi.org/10.1016/j.scitotenv.2021.148663.
- Lachapelle, J. A., E. S. Krayenhoff, A. Middel, P. Coseo, and J. Warland. 2023. “Paper Maximizing the Pedestrian Radiative Cooling Benefit per Street Tree.” Landscape and Urban Planning 230:104608. https://doi.org/10.1016/j.landurbplan.2022.104608.
- Lin, T.-P., and A. Matzarakis. 2008. “Tourism Climate and Thermal Comfort in Sun Moon Lake, Taiwan.” International Journal of Biometeorology 52 (4): 281–290. https://doi.org/10.1007/s00484-007-0122-7.
- Liu, B., and W. Dongxue W.2017. “Review and Prospect of Urban Green Space Thermal Comfort.“ Planners 33 (3): 6.
- Liu, W., Y. Zhang, and Q. Deng. 2016. “The Effects of Urban Microclimate on Outdoor Thermal Sensation and Neutral Temperature in Hot-Summer and Cold-Winter Climate.” Energy & Buildings 128:190–197. https://doi.org/10.1016/j.enbuild.2016.06.086.
- Manavvi, S., and E. Rajasekar. 2022. “Evaluating Outdoor Thermal Comfort in Urban Open Spaces in a Humid Subtropical Climate: Chandigarh, India.” Building & Environment 209:108659. https://doi.org/10.1016/j.buildenv.2021.108659.
- Mayer, H., and P. Hoppe. 1987. “Thermal Comfort of Man in Different Urban Environments.” Theoretical and Applied Climatology 38 (1): 43–49. https://doi.org/10.1007/bf00866252.
- Mei, Y., and L. Xu. 2022. “Research on Seasonal Thermal Neutral Temperature in West Lake Scenic Area of Hangzhou, China.” International Journal of Environmental Research & Public Health 19 (22): 14677. https://doi.org/10.3390/ijerph192214677.
- Mei, Y., L. Xu, and Z. Li. 2023. “Study on Emotional Perception of Hangzhou West Lake Scenic Area in Spring Under the Influence of Meteorological Environment.” International Journal of Environmental Research & Public Health 20 (3): 1905. https://doi.org/10.3390/ijerph20031905.
- Peng, Y., T. Feng, and H. Timmermans. 2019. “A Path Analysis of Outdoor Comfort in Urban Public Spaces.” 148 (JAN): 459–467. https://doi.org/10.1016/j.buildenv.2018.11.023.
- Reynolds, J. S. 1997. “MICROCLIMATIC LANDSCAPE DESIGN: CREATING THERMAL COMFORT and ENERGY EFFICIENCY.” Landscape Journal 16 (1): 129–130. https://doi.org/10.3368/lj.16.1.129.
- Salata, F., I. Golasi, R. Proietti, and A. D. L. Vollaro. 2017. “Implications of Climate and Outdoor Thermal Comfort on Tourism: The Case of Italy.” International Journal of Biometeorology 61 (12): 2229–2244. https://doi.org/10.1007/s00484-017-1430-1.
- Suai, M. 2021. A Study on Traveller's Spatial Behavior and RouteOptimization Based on Trajectory Data——Taking JinciMuseum as An Example. Shanxi University. https://doi.org/10.27284/d.cnki.gsxiu.2021.000120.
- Tan, J., Y. Zheng, G. Song, L. S. Kalkstein, A. J. Kalkstein, and X. Tang. 2007. “Heat Wave Impacts on Mortality in Shanghai, 1998 and 2003.” International Journal of Biometeorology 51 (3): 193–200. https://doi.org/10.1007/s00484-006-0058-3.
- Ting Nie, D. L., K. Liu, Z. Lian, Y. Yuan, and L. Sun. 2022. “Discussion on Inapplicability of Universal Thermal Climate Index (UTCI) for Outdoor Thermal Comfort in Cold Region.” Urban Climate 46:101304. https://doi.org/10.1016/j.uclim.2022.101304.
- Vanos, J. K., E. Kosaka, A. Iida, M. Yokohari, A. Middel, J. Scott-Fleming, and R. D. Brown. 2019. “Planning for Spectator Thermal Comfort and Health in the Face of Extreme Heat: The Tokyo 2020 Olympic Marathons.” Science of the Total Environment 657:904–917. https://doi.org/10.1016/j.scitotenv.2018.11.447.
- Vitt, R., A. Gulyas, and A. Matzarakis. 2015. “Temporal Differences of Urban-Rural Human Biometeorological Factors for Planning and Tourism in Szeged, Hungary.” Advances in Meteorology 2015:1–8. https://doi.org/10.1155/2015/987576.
- Wang, Y., B. J. He, C. Kang, L. Yan, X. Chen, M. Yin, X. Liu, and T. Zhou. 2022. “Assessment of Walkability and Walkable Routes of a 15-Min City for Heat Adaptation: Development of a Dynamic Attenuation Model of Heat Stress.” Frontiers in Public Health 10. https://doi.org/10.3389/fpubh.2022.1011391.
- Wu, Z.-F., and L.-D. Chen. 2016. “Thermal Comfort Assessment and Urban Thermal Environment Research: Review and Prospective.” Shengtaixue Zazhi 35 (5): 1364–1371. https://doi.org/10.13292/j.1000-4890.201605.036.
- Yang, X., L. Dong, and C. Li. 2019. “Microclimate Tourism and Microclimate Tourism Security and Safety in China.” Tourism Management 74:110–133. https://doi.org/10.1016/j.tourman.2018.12.012.
- Yanyan Cheng, X. L., Z. Zeng, and H. Bao-Jie. 2022. “Impacts of Water Bodies on Microclimates and Outdoor Thermal Comfort: Implications for Sustainable Rural Revitalization.” Frontiers in Environmental Science 10. https://doi.org/10.3389/fenvs.2022.940482.
- Yao, X., and Y. Y. Edition. 2021. “Study on Correlation Between Medium and Small Climate Factors and Thermal Comfort in Jiangnan Historic District.“ Journal of Xi'an University of Architecture & Technology(Natural Science Edition) 53 (2): 8. https://doi.org/10.15986/j.1006-7930.2021.02.013.
- Yao, X., and Y. Yan. 2022. “Effect of the Spatial Form of Jiangnan Traditional Villages on Microclimate and Human Comfort.“ Sustainable Cities and Society 52 (1): 179–188. https://doi.org/10.1016/j.scs.2022.104136.
- Zhang, J., Z. Gou, Y. Lu, and P. Lin. 2019. “The Impact of Sky View Factor on Thermal Environments in Urban Parks in a Subtropical Coastal City of Australia.” Urban Forestry & Urban Greening 44:126422. https://doi.org/10.1016/j.ufug.2019.126422.