
 ?Mathematical formulae have been encoded as MathML and are displayed in this HTML version using MathJax in order to improve their display. Uncheck the box to turn MathJax off. This feature requires Javascript. Click on a formula to zoom.
ABSTRACT
Flexural tests were conducted on the normal section of two different forms of specimens with wet joints to study the damage and cracks of mortise-and-tenon wet joints. Simulations were performed to analyze the mortise-and-tenon joint specimens. The extent of damage and development of cracks of specimens with straight joints and mortise-and-tenon joints are similar. The interface cracking of the specimens with mortise-and-tenon joints is often caused by concrete cracking at the root. Different tenon sizes have a negligible effect on the cracking load and overall bearing capacity of specimens. Therefore, the tenon end and depth sizes are considered 25–37.5% of the joint width, and the transition zone of the joint interface is selected to be 100–150 mm. According to the calculation formula of the flexural bearing capacity at the wet joint position and reduction factor of straight joints , the correction coefficient of mortise-and-tenon joints
was proposed to be 1.03.
1. Introduction
The occurrence of cracks is an important factor in the non-homogeneity and anisotropy of concrete (Shen Citation2020). In concrete girder bridges, wet joints, as the connection structure between bridge decks, can be damaged by loads or environmental erosion. The most common phenomenon is cracking. Once the concrete is cracked, the degree of erosion by the external environment will aggravate, shortening the service life of the bridge deck significantly. This creates an urgent need for new methods ((Wang et al. Citation2020)-)9] or specific structures to improve the durability of bridges.
Based on the structure and form of wooden mortise and tenon in China, various mortise-and-tenon structures have been applied to concrete structures, which include wet joints of bridge decks. Recently, many scholars have studied wet joints and mortise and tenon forms. Based on the connection types of wood structures, Wang (Wang and Liang Citation2022)proposed concrete members with mortise-and-tenon node connections. Additionally, the node forces and seismic performance were investigated by finite elements. Feng et al (Feng et al. Citation2022, Citation2022) investigated the effect of reinforcement rate on the flexural and shear resistance of wet joints in bridges. Su et al (Huifeng et al. Citation2017). designed mortise-and-tenon joints based on the erection process and investigated their shear resistance. Wang et al (Wang et al. Citation2022). designed a step form wet joint and studied its flexural properties. Yin et al (Yin et al. Citation2022) simulated to analyze the effect of wet joint interface roughness on bending performance. Wang (Wang Citation2017) verified the flexural bearing capacity of wet joints. Through finite element simulation, they concluded that the transmission of wet joints was similar to the strut-and-tie model. Zhao et al (Zhao et al. Citation2018) analyzed the main influencing factors of the force performance of dovetail joint positions by static load test and simulation. Su et al (Su et al. Citation2017) found that the ultimate tensile load capacity of the joints in the form of curved steel construction is higher. Gao (Gao, Zhang, and Du Citation2022) found that through finite element simulation the impact resistance of mortise-and-tenon construction blocks was three times higher than that of traditional rectangular blocks. Zhao (Zhao, Wang, and Shen Citation2014) concluded from finite element simulation that the effects of foundation settlement and vehicle loading on the lateral internal forces of wet joints were greater than those of shrinkage, creep, and temperature. Lee (Lee et al. Citation2012) used ABAQUS simulation analysis to propose the evaluation coefficients of longitudinal joint connection performance. Zheng et al (Zheng, Xu, and Lei Citation2021) applied the mortise-and-tenon structure to the transverse connection of precast hollow slab beams. Furthermore, based on simulation, they concluded that the inclination angle of the mortise and tenon structure should not be greater than 45°. Zhang (Zhang et al. Citation2018) found that a lapping angle of U-shaped reinforced bars of under 45° can prevent brittle fracture of the joint. Jia (Jia, Zeng, and Hu Citation2021) proposed the formula for calculating the flexural load capacity of ultra-high performance concrete (UHPC) with a T-bar and diamond-shaped joint beam. Shen et al (Shen, Guo, and Han Citation2019). designed various bridge deck specimens with wet joints and found that the damage load increased with the lapping length of the reinforced bars. Zhao (Zhao Citation2015) found that the number of lapped reinforcement bars and the form of construction significantly affected the ultimate load capacity and ductility of the flexural specimens with wet joints. Joergensen et al (Joergensen and Linh Hoang Citation2013) proposed a formula for the ultimate bearing capacity of the wet joints with a U-shaped reinforced lapping connection. Voo et al (Voo, Foster Stephen, and Voo Chen Citation2014) studied the shear strength of UHPC joints and showed that the friction coefficient of UHPC joints decreased with the increase in prestress. Yao (Yao, Zhao, and Ge Citation2006) concluded that the stiffness of mortise-and-tenon joints in wood structures varies nonlinearly with the load.
The aforementioned studies suggest that the mortise-and-tenon form has significant advantages in structural applications. Mortise-and-tenon construction is mostly used in wooden structures. However, studies on mortise-and-tenon construction applied to bridge deck slabs have not been reported (Wang, Shi, and Zhou Citation2022; Shi et al. Citation2019). The application of mortise-and-tenon construction to the wet joints of bridge deck slabs is of great significance for improving the stress performance of bridge deck slabs and prolong the service life of bridge deck slabs. Hence, we investigate the cracking of mortise-and-tenon wet joints based on a combination of experimental and finite element simulation analysis. In this study, two concrete specimens were fabricated to compare and analyze the cracking load and crack development process of concrete through different joint forms. Furthermore, the mortise-and-tenon joint members were simulated to further analyze and verify the cracking mechanism of concrete. The objective is to reveal the damage behavior and force properties of tongue-and-groove wet joints for engineering applications.
The main contents and structure of this paper are as follows. First, the design and preparation of specimens, loading devices, and results are described. Second, finite element simulations are discussed based on the tests to analyze the laws of damage morphology, load – displacement curves, characteristic loads, and cracking process of specimens. Then, the size and load-bearing formulas of the mortise-and-tenon wet joints are derived. Finally, the cracking law of the mortise-and-tenon wet joints is summarized.
2. Materials and methods
2.1. Specimen design
A straight joint specimen and mortise-and-tenon joint specimen of reinforced concrete were prepared for this test. The test was conducted using 32.5-grade slag silicate cement, river sand, and common gravel in accordance with the design requirements of the Specification for Mix Proportion Design of Ordinary Concrete (JGJ 55–2000 Citation2000) (JGJ55–2011) for C30 concrete mix proportion design. The test model was adopted from the full-size model in the 2008 edition of the General Drawing for Bridges in the Transportation Industry of the People’s Republic of China, as shown in . The reinforcement required for the test was HRB400E. The overall size of the specimen was 2100 mm × 400 mm × 160 mm. The specific reinforcement is shown in . The specific dimensions of vertical joints and mortise-and-tenon joints are shown in , respectively. Mortise-and-tenon joints are connected to the deck slabs by tenon ends. The tenon end size is 100 mm, tenon root size is 65 mm, and tenon depth is 100 mm. All mortise-and-tenon joint interfaces are mitered. The mechanical properties of the reinforcement and concrete used in the test meet the necessary requirements above.
Figure 1. Joint structure in the 2008 edition of the Ministry of Transport general drawings (mm).
Figure 2. Diagram of the test piece reinforcement design and wet joint size (mm).
2.2. Specimen preparation
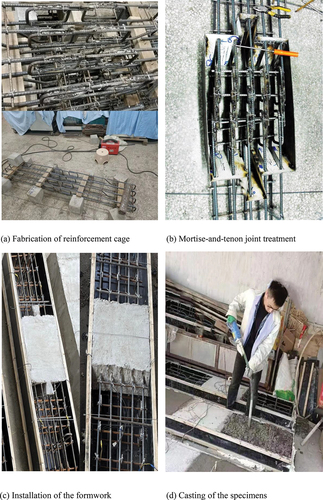
As shown in , the manually tied reinforcement cage was welded on both sides with electric arc welding to meet the necessary conditions. Formwork production and installation are shown in . The joints were connected by a wooden formwork using corner brackets and screws to achieve the construction form of straight joints. The upper and lower formwork were slotted to ensure that the reinforced bars can be stuck into the slots, while the other gap parts were filled with foam grout. The bottom and side plates were treated using transparent adhesive tape, while the end and side plates were reinforced with steel wire rope connections to ensure that the end formwork and reinforcement gaps were sealed while preventing slurry leakage during pouring. The more complicated mortise-and-tenon joint formwork was made by welded and screwed with steel plates. The casting process of the specimen is shown in . The concrete was vibrated while pouring to achieve compaction. The order of pouring the precast sections and wet joint was reversed during the production of the specimens, and the concrete joint was covered with a film and sprinkled with water for 7 days after the concrete was poured. After 7 days, the entire concrete for manufacturing the precast section was covered with a film and sprinkled with water for 28 days.
Figure 3. Fabrication process of the specimens.
2.3. Specimen loading
The loading design and loading device are shown in .
Figure 4. Loading design and device.
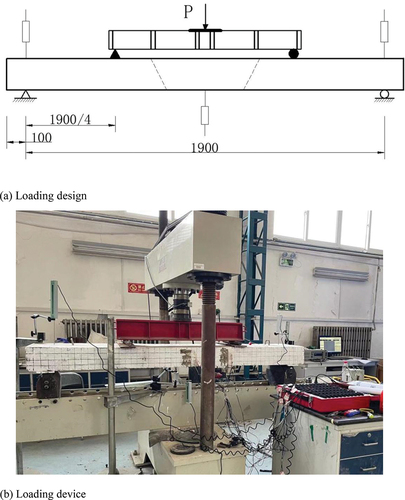
The loading device used for the test was a 500 kN electro-hydraulic servo press. Before loading, the main reinforcement strain gauges were arranged at the mid-span position, while concrete strain gauges were arranged at the mid-span and joint positions of the specimen. The deflection was measured using displacement transducers with a maximum range of 50 mm. Displacement and strain data were collected using a 60-channel static resistance strain gauge with the acquisition frequency set at 0.5 Hz. The specimen was pre-loaded at a rate of 0.005 kN/s before loading until the 5 kN load was added. After preloading was complete, the specimen was unloaded to prepare it for formal loading. Considering the comparability of the cracking process of the specimens, according to the standard of test methods for concrete structures (GB/T 50152–2012 Citation2012), the formal loading was performed in a leveled manner with the loading rate set to 0.01 kN/s. The specimen was loaded with 5 kN at each level before cracking and 10kN at each level after cracking. The crack development and load value of each crack start and development were recorded during the loading process. The load at each level was held for 10 min, and the crack width was measured and recorded. When the strain of the main reinforcement reached the yield strain, the loading method was changed to displacement-controlled loading until the specimen was damaged by the displacement-controlled loading rate set to 0.5 mm/s.
2.4. Results and discussion
The damage pattern of the flexural specimen in the normal section is shown in , where the upper figures show the development and sequence of cracks during loading, and the lower figures show the load value (kN) corresponding to the cracks developed before yielding of the reinforcement.
Figure 5. Normal section damage due to the flexure of the specimens.
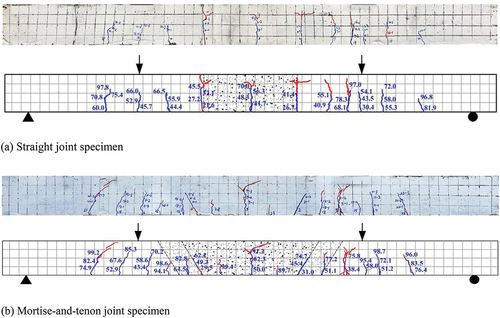
shows that the cracks of the entire beam are distributed within the supports, with the distribution length being approximately 1400 mm. The crack development of the straight joint specimen and the mortise-and-tenon joint specimen are similar, with the main cracks appearing at the mid-span position and wet joint interface position, where the height of the crack at the mid-span position is close to the beam height. The crack of the straight joint specimen at the joint position developed throughout the beam, whereas the crack of the mortise-and-tenon joint developed until 1/2 of the beam. Therefore, the mortise-and-tenon joint effectively prevents cracks from developing, thus suppressing load-induced damage.
As shown in , the cracking, yield, and peak loads of the concrete mortise-and-tenon joint specimens are higher than those of the straight joint specimens by 49%, 7.3%, and 5.3%, respectively. The increase in cracking load is greater. The load – displacement curves are shown in . According to the overall damage form of the specimens, they are divided into three stages, elastic stage, normal-use stage, and damage stage. Generally, the deflection curves of the two jointed specimens are relatively close. Before cracking, the tensile stress in the tensile zone of the specimen was mainly borne by the concrete in the tensile zone. The specimen cracked when the tensile stress in the concrete in the tensile zone was greater than the ultimate tensile stress of the concrete. As the tensile stress in the tensile zone at the joint position was mainly borne by the bond strength of the wet joint interface, the wet joint interface cracked when the tensile stress was greater than the bond strength of the interface. In the normal-use stage, after the cracking of the concrete straight joint specimen, the tensile stress in the tensile zone was mainly borne by the tensile reinforcement. As the interface bond strength is lower than the concrete tensile stress, the cracking rate of the interface in the loading process is much greater than that of concrete at other locations between the cracks. In addition to the bonding and anchoring effect of the tensile reinforcement and concrete, the mortise-and-tenon specimen has the mechanical interlocking effect for continued working. Therefore, cracks develop only to the midpoint of the beam at the wet joint interface location. In the damage stage, when the tensile reinforcement yields, the deformation of the specimen increases. Then, the concrete in the compression zone is wrecked gradually. When the number and width of cracks reach the maximum, the specimen fails.
Figure 6. Load – displacement curve for the flexural damage test.
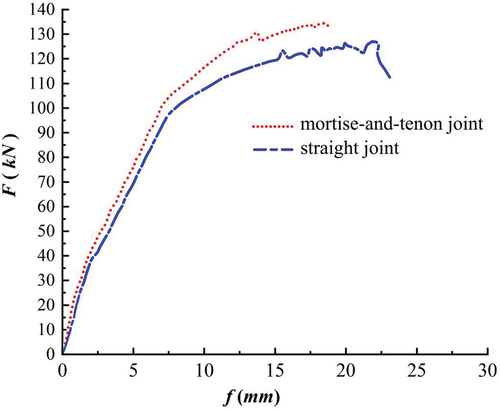
Table 1. Cracking load, yield load, peak load, and deflection of the specimen.
3. Numerical simulation of mortise-and-tenon joints
From the flexural bearing capacity test of the normal section, the force characteristics of the mortise-and-tenon joints in the precast reinforced concrete ribbed girder bridge were found to be more prominent. The cracking load of the mortise-and-tenon joint specimen is greater than that of the straight joint specimen. In this study, based on the test results, the tensile damage to the concrete at the root of the tenon in the mortise-and-tenon joint was found to raise the joint cracking load. Therefore, to verify the crack development in concrete specimens during the test and the damage mechanism when the joint interface of the mortise-and-tenon joint specimens cracked, ABAQUS general finite element software was used.
3.1. Material constitutive relationships
(1) Concrete Constitutive Relationship: The plastic damage model (CDP) was used for concrete. The required stress – strain relationships for concrete under tension and compression were calculated according to the Code for Design of Concrete Structures (GB 50,010–2010) (GB 50010–Citation2010) Appendix C. The following equations provide the uniaxial compressive stress – strain relationships for concrete:
where dc refers to the evolution parameter of uniaxial compressive damage, and fc,r refers to the representative value of uniaxial compressive strength.
Stress – strain relationships for concrete subjected to uniaxial tension are given by:
where ft,r refers to the representative value of the uniaxial tensile strength of concrete, and dt refers to the evolution parameter of uniaxial tensile damage.
The stresses and strains of concrete under uniaxial compression and uniaxial tension based on the code are nominal stresses and nominal strains, which are converted to obtain true stresses and true strains. The stress – strain curve relationships for concrete under uniaxial stress and uniaxial compression and the curves of concrete damage under tension and compression were determined ().
Figure 7. Concrete constitutive relationship curve.
The other plastic parameters of concrete are shown in . The choice of different plastic parameters is related to the convergence of the finite element calculation results and calculation process.
Table 2. Plasticity parameter values of concrete.
(2) Reinforcement constitutive relationship: The ideal elastic – plastic model is used for the reinforcement constitutive relationship, as shown in .
Figure 8. Reinforcement constitutive relationship.
3.2. Finite element modeling
The finite element model meshing and steel skeleton are shown in .
Figure 9. Finite element model.
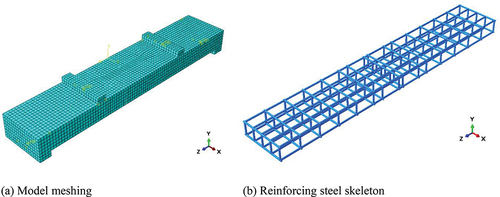
Unit type: To prevent the damage process of the model from causing local damage to the concrete, which in turn affects the calculation results, mats were set at the loading locations and support locations during modeling. The mat is implemented using the discrete rigid body unit R3D4. The eight-node linear hexahedral (C3D8R) element was adopted for concrete, whereas the two-node linear three-dimensional truss element (T3D2) was adopted for the reinforcement.
Contact and restraint: The bond between the reinforcement and concrete is restrained by the embedded region. The tie restraint is used between the support mat, loading mat, and concrete, and the bond-slip between the mat and concrete was ignored. The bonding effect between the joint interfaces is implemented using the cohesion model (CDP). ABAQUS provides two analysis methods for cohesion models. The first method is to simulate the bonding region between the old and new concrete by defining a certain thickness of interface element as the cohesion element. The second method is to directly define a zero-thickness cohesion contact to simulate the bond-slip relationship between the interfaces. As no other bonding material existed between the wet joint concrete and bridge deck concrete, the second method was directly used to simulate the bond-slip relationship between the wet joint concrete and bridge deck concrete by defining the cohesive contact surface.
Step of loading and its analysis: Displacement loading is the load considered in the finite element simulation. The loading value is consistent with the maximum value of final deflection measured in the experimental results. The loading analysis step is general static loading.
4. Comparison and validation of finite element results
Finite element simulations were performed for tests on the flexural performance of mortise-and-tenon joint specimens from the positive section. The correctness of the finite element model was verified by comparing the load – displacement curves, characteristic loads and deformations, and damage patterns of mortise-and-tenon joint specimens.
4.1. Comparison of load-displacement curves
The finite element simulated values of the load – displacement curves of the mortise-and-tenon joint specimens are compared with the test values, as shown in .
Figure 10. Comparison of load – displacement curves.
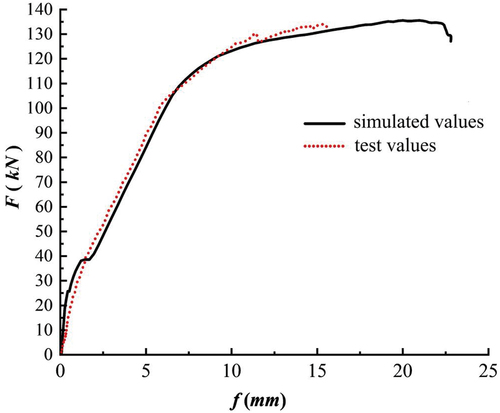
shows that the load – displacement curves of the mortise-and-tenon joint specimens obtained from the static load test and the load – displacement curves obtained from the finite element simulation have the same trend. The two have a high degree of similarity, and the ultimate load values are similar, which proves the reliability of the finite element simulation. However, the deflection values obtained from the finite element simulation are larger than the test results after the reinforcement yielded, and the main reasons for this problem are analyzed as follows:
The material constitution used in the finite element simulation is based on the theoretical stress – strain relationship given by the code, which is different from the real stress – strain relationship of the test.
The loading method of the finite element simulation was displacement loading. However, the loading method of the test was initially load-controlled and then displacement-controlled.
4.2. Comparison of feature loads and deformations
The finite element simulation results are compared with the cracking, yield, peak loads, and corresponding deflections of the normal section flexural test, as shown in .
Table 3. Comparison of feature loads and corresponding deflections.
By comparing the finite element simulation and normal section flexural test results of the mortise-and-tenon joint specimen, we found from the feature load and corresponding deflection values that the yield load and peak load of the simulation and test results are consistent. Moreover, the deflection values corresponding to the feature load are generally consistent. However, the cracking loads obtained finite element simulation results are larger than the test results. The main reason for this is that the interfacial bond coefficient in the finite element simulation process is an idealized theoretical calculation result. Therefore, a certain difference exists between the numerical value and interfacial bond action in the actual test. Furthermore, unavoidable errors are present in the actual specimen fabrication and loading process. Nevertheless, in comparison, the finite element simulation results agree well with the test results.
4.3. Comparison of damage patterns of mortise-and-tenon joint specimens
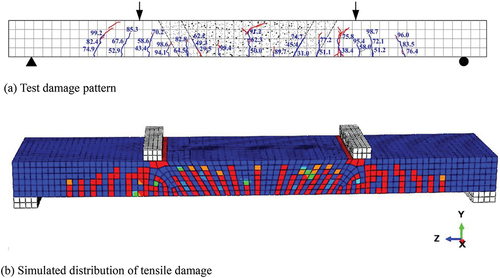
Damage under tension indicates the degree of cracking and damage to concrete, and its value ranges from 0–1. When the value of damage is 0, the concrete is not cracked; when the value is 1, the concrete is completely damaged and cracked.
As shown in , by comparing the test crack distribution with the tensile damage result obtained from the finite element simulation, the tensile damage result of finite element simulation was found to be consistent with the crack distribution obtained from the test results, thus proving the reliability of the finite element simulation results and accuracy of the finite element simulation parameter settings.
Figure 11. Comparison of tensile damage to the specimens.
4.4. Cracking process of the mortise-and-tenon joint interface
To verify the causes of joint interface cracking in mortise-and-tenon joint configurations under static load flexure, the tensile damage evolution process was analyzed by considering the joint bottom surface at different loading stages. The partial process of the tensile damage evolution of the joint bottom surface at different loading stages is shown in .
Figure 12. Tensile damage process on the bottom surface of a mortise-and-tenon joint.
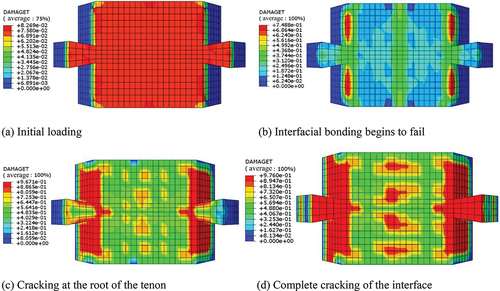
Based on the evolution process of the tensile damage to the bottom surface of the joint shown in , the interface cracking process of the mortise-and-tenon joint specimen can be obtained as follows.
Initially, when the specimen is being loaded, the interfacial bond strength is higher than the tensile stress, and the tensile stress on the tensile side is uniformly transmitted at the bottom surface of the joint. During this time, no cracks appear, as shown in .
As the load increases, the stress on the tensile side in the specimen gradually approaches the interfacial bond strength. The joint interface bonding begins to fail. At this point, the crack is about to develop, as shown in .
When the interface is about to crack, the tenon structure is gradually pulled under the mechanical interlocking force, which limits the interface cracking and highlights the advantages of the mortise-and-tenon joints, as shown in .
With the increasing load, the tensile stress on the bottom side of the specimen gradually becomes equal to the concrete tensile strength. During this time, the concrete at the root of the tenon cracks under tension. The interfacial bonding action fails completely. Furthermore, the joint interface position and tenon root crack simultaneously. The tensile stress is transferred to the mid-span position through the reinforcement, which in turn causes the span section of the specimen to crack, as shown in .
The analysis of the evolution process of the tensile damage at the bottom surface of the joints and the cracking process at the interface of the mortise-and-tenon joints, as shown in , verified the reasonableness of the cracking process and the crack development distribution of the specimens in the test.
4.5. Expansion of finite element analysis
4.5.1. Model design
Through tests and simulations, the interface cracking of mortise-and-tenon joint specimens was found to be often characterized by cracking of the concrete at the root of the tenon. Therefore, three different mortise-and-tenon joint forms with different tenon sizes, as shown in , were designed for static load flexure simulations. The three specimens were numbered S-100, S-150, and S-200 according to the tenon size, where S denotes the mortise-and-tenon joint specimen, and the number denotes the head size and depth of the tenon structure. The three tenon sizes were designed to ensure that the tenon end size and depth value of the tenon were consistent. The tenon end dimensions, tenon root dimensions, and tenon depth of the mortise-and-tenon joint specimens in the test were expanded by 50 mm, as shown in , and by 100 mm, as shown in , for simulation.
Figure 13. Tenon size design of finite element simulation (mm).
4.5.2. Load – displacement curves
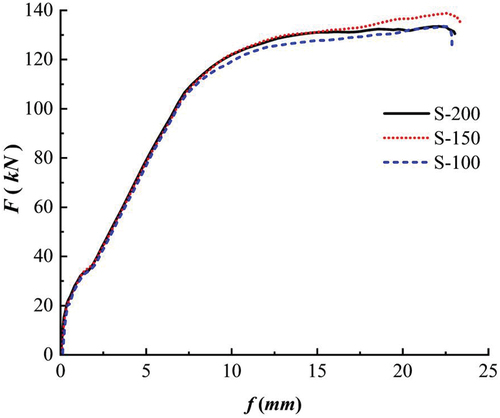
The load – displacement curves of the mortise-and-tenon joint specimens with different tenon sizes under static load flexure loading are shown in . By comparing the load – displacement curves of the specimens, we found that the load – displacement curves of different tenon sizes overlap well, i.e., tenon size does not affect the cracking load and ultimate load-carrying capacity of the specimen.
Figure 14. Load – displacement curves for specimens with different tenon sizes.
4.5.3. Analysis of the evolution of joint damage for different tenon sizes
The load – displacement curves of the specimens show that different tenon sizes do not affect the cracking load and flexural load capacity of the specimen overall. Therefore, simplified simulations were performed for different tenon structures, and the nephogram obtained from the simulations when the tenon is damaged and cracked is shown in .
Figure 15. Tensile damage nephogram for tenons of different sizes at the same moment.
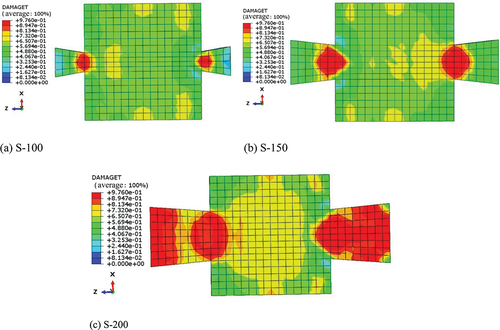
As shown in , the locations of all tensile damage cracking of tenons are concentrated at the tenon root location, explaining the high degree of overlap of load – displacement curves of mortise-and-tenon joint specimens with different tenon sizes. In particular, the main indicator affecting the cracking load of mortise-and-tenon joint specimens is the ultimate tensile strength of concrete at the tenon root, independent of the tenon size. Under the same loading conditions at the same moment, as the tenon size increases, the damage area at the tenon area increases, with S-200 directly showing overall damage at the tenon area, causing more cracks at the interface of the mortise-and-tenon joint and adversely affecting the structure. Therefore, from the above analysis, we concluded that considering the tenon end and depth dimensions between 25% and 37.5% of the joint width is the optimal choice. By analyzing the cracking of mortise-and-tenon joints and direct joints, the joint transition zone plays a significant role in limiting the development of cracks and improving the load-bearing capacity of the members. According to the simulation analysis, the optimal length of the joint transition zone ranges between 100 and 150 mm.
4.5.4. Calculation of flexural load capacity at wet joints
In the calculation, the connection between the reinforcement and concrete and their adjacent precast slab at the wet joint is assumed to be good, i.e., the reinforcement and concrete crack within a certain range of the length of the member after the force is applied. Subsequently, the flexural bearing capacity of the normal section of the reinforced concrete flexural member can be calculated. During the experiment, the stress in the compressive zone is extremely small and the height of the compressive zone obtained from the actual calculation is also small. Therefore, the role of the reinforcement in the compressive zone is ignored when calculating the flexural bearing capacity of the normal section. The flexural bearing capacity is calculated, as shown in , using the single reinforcement rectangular section.
Figure 16. Calculation of flexural load bearing capacity of the normal section of the single reinforced rectangular section member.
According to the condition for the balance of internal forces in the horizontal direction in the cross-section:
According to the equilibrium condition that the sum of the moments at the point of action of the combined forces on the concrete in the section is zero, it follows that
According to the experimentally obtained flexural damage form of the joint cross-section of the flexural member, the equilibrium equation is established with the state of the cross-sectional forces at the time of damage, and the formula for calculating the bearing capacity is derived (JTG/T Citation3365-05-2022).
where Mudis the design value of the flexural bearing capacity of the section of the flexural member; fcd is the design value of the axial compressive strength of concrete; fsd is the design value of the tensile strength of the longitudinal tensile reinforcement; As is the cross-sectional area of the longitudinal tensile reinforcement; x is the height of the compressive zone of the section calculated based on the equivalent rectangular stress diagram; b is the section width; h0is the effective height of the cross-section;is the structural importance factor; Md is the design value of the flexural moment of the cross-section;
is the reduction factor of the joint against the flexural load capacity, considered to be 0.95.
From the test and simulation analysis, the generation of cracks in flexural members is mainly concentrated near the wet joints. Once the joints are damaged, the damage will concentrate the forces on the members. Thus, the reinforcement will attain the yield state quickly, thereby reducing the bearing capacity of the joint section. The test shows that compared to direct joints, the flexural bearing capacity of mortise-and-tenon joints increased by 0.05 times. Additionally, a structural safety factor of 1.5 was introduced. Thus, the flexural bearing capacity of the mortise-and-tenon joints increased by 0.03 times. Therefore, for mortise-and-tenon joints, the load-bearing capacity equation (Eq. (14)) should consider the correction factor:
where, which is the correction factor for mortise-and-tenon joints, is considered 1.03.
5. Conclusion
According to the damage morphology exhibited by the specimens in the flexural test of the normal section, the flexural damage simulation analysis of the mortise-and-tenon joint specimens under static load was conducted using a general finite element software model. Furthermore, based on the cracking mechanism of the mortise-and-tenon joint specimens, three different sizes of tenon forms were designed for finite element analysis. The main conclusions are as follows:
The mid-span and joint locations were the first parts of the concrete specimens to crack. Based on the development of cracks during bending, it can be concluded that mortise-and-tenon joints could limit the development of cracks very well. It can also act as an inhibitor to the damage caused by the beams. The load-bearing capacity of the mortise-and-tenon joints was larger than that of the straight joint specimen.
The finite element model was validated against experimental results. The load – displacement curves and feature load values obtained from the simulations agreed well with the experimental results, and the obtained tensile damage nephogram agreed well with the experimental crack distribution. The plausibility of the interfacial cracking mechanism was verified.
The tenon size does not affect the cracking load and overall load-bearing capacity of the specimen. Additionally, in comparison, the larger tenon size increases the transition range of the joint and the number of concrete cracks at the joint location. By analyzing the evolution of joint damage for different tenon sizes, we recommend that the tenon end and depth dimensions should be 25–37.5% of the joint width. The length of the transition zone of the joint interface should range from 100 to 150 mm.
According to the formula of flexural load capacity and direct joint reduction factor
at the wet joint, the correction factor of flexural load capacity of the mortise-and-tenon wet joints
In this study, experimental and simulation analyses were conducted on concrete specimens with straight and mortise-and-tenon joints to explore the cracking mechanism of concrete structures and the distribution of crack development, which has to be explored and analyzed in the future from various aspects and under various joint forms. In addition, structural dynamic issue is the main focus of slender bridges. The application of a tuned mass damper to ribbed girder bridge deck slabs is also one of the future research directions.
Acknowledgements
This work was supported by the scientific research project of the Liaoning Education Department under Grant [2020LNJC02].
Disclosure statement
No potential conflict of interest was reported by the author(s).
Additional information
Funding
Notes on contributors
Xiaotao Zhang
Xiaotao Zhang, Master of Engineering (M.E. degree). His research interests include concrete structures and bridge inspection & reinforcement.
Shuai Tian
Shuai Tian, Doctor of Engineering (PhD). His research interests include concrete structures and bridge inspection & reinforcement.
Suhe Zhang
Suhe Zhang, Master of Engineering (M.E. degree). His research focuses on the performance and design, durability and innovative applications of concrete and fibre-reinforced composite materials and structures.
Bo Sun
Bo Sun, Master of Engineering (M.E. degree). His research interests include concrete structures and bridge inspection & reinforcement.
References
- Feng, Z., L. Chuanxi, K. Lu, and Y. Doo-Yeol. 2022. “Experimental and Numerical Investigations on Flexural Performance of Ultra-High-Performance Concrete (UHPC) Beams with Wet Joints.” Structures 45:199–213. https://doi.org/10.1016/j.istruc.2022.09.029.
- Feng, Z., L. Chuanxi, R. Pan, D.-Y. Yoo, H. Jun, and L. Ke. 2022. “Shear Capacity of Ultrahigh-Performance Concrete with Monolithic Interface and Wet-Joint Interface.” Journal of Materials in Civil Engineering 34 (7): 04022153. https://doi.org/10.1061/(ASCE)MT.1943-5533.0004297.
- Gao, W., P. Zhang, and T. Du. 2022. “ANSYS Finite Element Analysis of the Performance of Confined Walls Made of Mortise-And-Tenon Blocks.” Inner Mongolia Coal Economy 11:4–6. 10.13487/j.cnki.imce.022328. (in Chinese).
- GB 50010-2010 Code for the Design of Concrete Structures. (in Chinese)
- GB/T 50152-2012. 2012. Standard on Test Methods for Concrete Structures. Beijing, China: Ministry of Housing and Urban-Rural Development of the People’s Republic of China.
- Huifeng, S., L. Zhaoping, C. Wang, and M. Zheng. 2017. “Experiment Study on the Grouting Material for the Fabricated Metro Station’s Joint with Tenon and Mortise.” Science of Advanced Materials 9 (9): 1644–1652. https://doi.org/10.1166/sam.2017.3132.
- JGJ 55-2000. 2000. Specification for Mix Proportion Design of Ordinary Concrete with notes on provisions). (in Chinese). Beijing, China: Ministry of Housing and Urban-Rural Development of the People’s Republic of China.
- Jia, Y., T. Zeng, and M. Hu. 2021. “Study on Flexural Performance of UHPC with T-Bar with Rhombic Joint Beams.” Highway Engineering 46 (5): 104–109. in Chinese.
- Joergensen, H. B., and C. Linh Hoang. 2013. “Tests and Limit Analysis of Loop Connections Between Precast Concrete Elements Loaded in Tension.” Engineering Structures 52:558–569. https://doi.org/10.1016/j.engstruct.2013.03.015.
- JTG/T 3365-05-2022 Specifications for Design of Highway Precast Concrete Bridges. (in Chinese)
- Lee, S.-Y., J.-M. Lee, H.-Y. Kim, and J.-J. Song. 2012. “Analytical Study on a Longitudinal Joints of the Slab-Type Modular Bridges.” International Journal of Civil and Environmental Engineering 6 (2): 164–169.
- Shen, Z. H. 2020. Study on Mesoscopic Simulation and Mechanical Properties of Cracked Concrete. in Chinese. Wuhan: Hubei University of Technology.
- Shen, Y., W. Guo, and Z. S. Han. 2019. “Experimental Study on the Pure Flexural Damage Behavior of Concrete Bridge Deck Slabs with Wet Joints.” Bridge Construction 49 (3): 34–39. (in Chinese).
- Shi, W., L. Wang, L. Zheng, and H. Wang. 2019. “Experimental and Numerical Study on Adaptive-Passive Variable Mass Tuned Mass Damper.” Journal of Sound and Vibration 452:97–111. https://doi.org/10.1016/j.jsv.2019.04.008.
- Su, Q., Y. Hu, L. Tian, et al. 2017. “Curved steel connection construction for wet joints in composite girder bridge deck slabs.” Chinese Journal of Highway and Transport 30 (9): 86–92. in Chinese.
- Voo, Y. L., J. Foster Stephen, and C. Voo Chen. 2014. “Ultrahigh-Performance Concrete Segmental Bridge Technology: Toward Sustainable Bridge Construction.” Journal of Bridge Engineering 20 (8): B5014001. https://doi.org/10.1061/(ASCE)BE.1943-5592.0000704.
- Wang, L. 2017. Research on Wet Joint Construction and Force Transmission of Precast Bridge Deck Slabs for Steel-Hybrid Combination Bridges. Xi’an: Chang’an University (in Chinese).
- Wang, K., L. Guo, J. Wang, H. Shimei, and Y. Guoqing. 2022. “Flexural Behaviour Analysis of Wet Joint of Precast Bridge Deck with UHPC Functional Gradient.” Advances in Structural Engineering 26 (3): 448–458. https://doi.org/10.1177/13694332221127768.
- Wang, X., and Y. Liang. 2022. “Design and Application of New Mortise and Tenon Concrete Structure Nodes.” New Building Materials 49 (2): 86–89. [in Chinese].
- Wang, L., S. Nagarajaiah, W. Shi, and Y. Zhou. 2021. “Semi-Active Control of Walking-Induced Vibrations in Bridges Using Adaptive Tuned Mass Damper Considering Human-Structure-Interaction.” Engineering Structures 244:112743. https://doi.org/10.1016/j.engstruct.2021.112743.
- Wang, L., S. Nagarajaiah, Y. Zhou, and W. Shi. 2023. “Experimental Study on Adaptive-Passive Tuned Mass Damper with Variable Stiffness for Vertical Human-Induced Vibration Control.” Engineering Structures 280:115714. https://doi.org/10.1016/j.engstruct.2023.115714.
- Wang, L., W. Shi, Q. Zhang, and Y. Zhou. 2020. “Study on Adaptive-Passive Multiple Tuned Mass Damper with Variable Mass for a Large-Span Floor Structure.” Engineering Structures 209:110010. https://doi.org/10.1016/j.engstruct.2019.110010.
- Wang, L., W. Shi, and Y. Zhou. 2022. “Adaptive-Passive Tuned Mass Damper for Structural Aseismic Protection Including Soil–Structure Interaction.” Soil Dynamics and Earthquake Engineering 158:107298. https://doi.org/10.1016/j.soildyn.2022.107298.
- Yao, K., H. Zhao, and H. Ge. 2006. “Experimental Study on the Characteristics of Mortise and Tenon Joints in Ancient Wooden Structures.” Engineering Mechanics 23 (10): 168–173. [in Chinese].
- Yin, Y., F. Yi, J. Yang, S. Qingtian, and G. Zhang. 2022. “Numerical Calculation and Analysis of Mechanical Properties of UHPC Wet Joint Interface of Prefabricated Segmental Beams.” Case Studies in Construction Materials 17:17 e01426. https://doi.org/10.1016/j.cscm.2022.e01426.
- Zhang, J., Z. Guan, L. Liang, and X. Ling. 2018. “Experimental Study on Longitudinal Joints with Accelerated Construction Features in Precast Multibox Girder Bridges.” Journal of Bridge Engineering 23 (1): 4017116. https://doi.org/10.1061/(ASCE)BE.1943-5592.0001172.
- Zhao, Z. Q. 2015. Research on the Mechanical Properties of New Joints of Prefabricated Precast RC Slabs. in Chinese. Nanning: Guangxi University.
- Zhao, Y., C. Wang, and X. Shen. 2014. “Study on the Force Performance of Spliced Wet Joints in Continuous Box Girder Bridges.” Journal of Highway and Transportation Research and Development 10 (7): 148–151. [in Chinese].
- Zhao, C., K. Wang, Q. Zhou, K. Deng Kailai, and B. Cui. 2018. “Full-Scale Test and Simulation on Flexural Behavior of Dovetail-Shaped Reactive Powder-Concrete Wet Joint in a Composite Deck System.” Journal of Bridge Engineering 23 (8): 4018051. https://doi.org/10.1061/(ASCE)BE.1943-5592.0001265.
- Zheng, Y., B. Xu, and G. Lei. 2021. “Research on the Design of Mortise and Tenon Structure of Precast Hollow Slab Beams.” World Bridges 49 (5): 52–58. [in Chinese].