
 ?Mathematical formulae have been encoded as MathML and are displayed in this HTML version using MathJax in order to improve their display. Uncheck the box to turn MathJax off. This feature requires Javascript. Click on a formula to zoom.
ABSTRACT
This paper reports a study on the flexural performance of prestressed high strength steel reinforced concrete (PHSSRC) beams and proposes machine learning (ML) models for predicting the flexural bearing capacity of steel reinforced concrete (SRC) beams. Seven prestressed steel reinforced concrete (PSRC) beams were tested under a four-point bending load to investigate the effect of steel strength grade, steel ratio, and longitudinal reinforcement ratio on the flexural load capacity of beams. The test results indicated that increasing the steel strength grade and steel ratio significantly enhanced the bearing capacity of PSRC beams. A database consisting of 112 sets of experimental data on the flexural performance of SRC beams, including the test data in this study, was established for training and validating the ML models. Artificial Neural Network (ANN) model and eXtreme Gradient Boosting (XGBoost) model were respectively developed to predict the flexural load capacity of SRC beams, and the accuracy of the flexural load capacity values predicted by the design specification, the ANN model and the XGBoost model were compared. The results show that the XGBoost model has the best prediction performance. Finally, the sensitivity analysis of the parameters was performed using the Shapley Additivity (SHAP) interpretation method.
1. Introduction
Steel reinforced concrete constructions are widely used in high-rise buildings (Wang et al. Citation2019, Citation2020; Wang, Shi, and Zhou Citation2019; Wang, Zhou, and Shi Citation2023a) and large-span structures (Wang, Wang, and Shi Citation2021; Wang et al. Citation2020, Citation2021, Citation2023) because of their excellent mechanical, seismic and fire resistance properties (Wang et al. Citation2020, Citation2022, Citation2023; Wang, Shi, and Zhou Citation2022; Wang, Zhou, and Shi Citation2023b). In recent years, high strength steel (HSS) has been widely researched and applied in composite structures due to its high yield strength (F, L, and L Citation2007; Gang, Jin-qing, and Wei-qing Citation2014; L et al. Citation2020; T et al. Citation2022). However, there are few reports on the application of HSS in steel reinforced concrete (SRC) beams. Kabir (Kabir et al. Citation2020) conducted flexural performance tests on Engineered Cementitious Composites and Lightweight Concrete (ECC-LWC), and the test results showed that the load carrying capacity and ductility properties of HSS composite beams wrapped by ECC-LWC are higher than those of HSS composite beams wrapped by ordinary concrete. Liu (Zu-qiang, Beng-you, and Jian-yang Citation2023) designed and fabricated six Q460 HSS ultra-high-performance concrete composite beams to study their bending performance, using steel ratio, section location, and steel fiber volume as test parameters. The test results indicated that all specimens had reached ductile failure, and the yielding of the tensile reinforcement and the lower flange of the section occurred before the concrete was crushed in the compression zone. The above studies did not use conventional stirrups or longitudinal reinforcement, were designed with fewer study parameters, and did not incorporate prestressing tendons, which hinder the development of HSS. The application of HSS to SRC beams can meet the demand for the bearing capacity of large-span structures and reduce steel consumption, which has good economic benefits. In addition, the application of prestress improves the cracking resistance and deformation resistance of the members.
There are two main methods for calculating the flexural load capacity of SRC beams. The calculation accuracy of the Superposition Method is low, and the calculation process of the Deformation Synergy Method is cumbersome. Machine Learning (ML) has been applied in the field of structural engineering to solve complex engineering computational problems. Wakjira (Wakjira et al. Citation2022) developed a total of 11 ML models for predicting the shear capacity of FRP-RC beams, where the extreme gradient boosting (XGBoost) model has superior predictive accuracy over the available codes and the guiding equations. Golafshani (Golafshani et al. Citation2012) developed an ANN model using test data from 179 test beams to predict the bond strength of reinforced steel in concrete structures. The above studies show that for specific engineering computational problems, different ML methods have an important impact on the accuracy of the computational results, and the selection of appropriate ML models can help to reduce the amount of computation and improve the prediction accuracy.
Therefore, tests on the flexural performance of seven prestressed steel reinforced concrete (PSRC) beams were carried out to investigate the effect of steel strength grade, steel ratio, and longitudinal reinforcement ratio on the flexural performance of the specimen. 112 sets of test data investigating the bending performance of SRC beams were collected and two ML models were developed with a database of test data from this paper and the published literature covering a wide range of geometrical and material properties. A comparative study between the proposed model and the canonical computational methods was carried out to obtain a load capacity prediction model with relatively high accuracy and good generalization performance, which provides a reference for engineering practice. Finally, the contribution of the input features to the bending capacity of SRC beams was ranked using the Shapley Additive Properties (SHAP) method of interpretation. By addressing the limitations of previous research, incorporating conventional reinforcement and prestressing tendons, and utilizing ML techniques, this study provides novel insights into the flexural performance of PSRC beams and offers a valuable reference for engineering practice. The workflow diagram of this study is shown in . This article is overloaded with noun abbreviations, and to improve the readability of the article, the abbreviations, and their meanings appearing in the text are summarized in .
Figure 1. Workflow of this study.
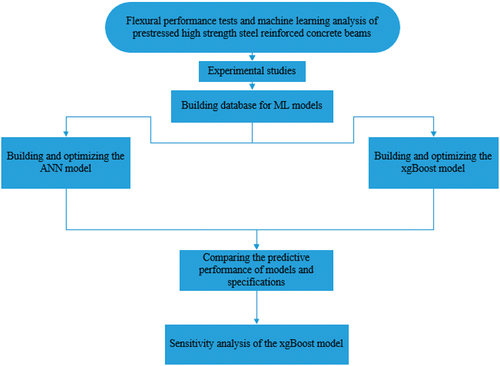
Table 1. Meanings of nouns.
2. Experimental study
2.1. Specimens and material properties
For the test, seven beams were made. The beam length was 3100 mm, and the concrete cover depth was 20 mm. The cross-sectional sections of the different specimens are shown in . The spacing of the stirrups at the support was 50 mm, the encryption length was 300 mm, and the spacing of the rest of the stirrups was 100 mm. The section steels were made of welded H-beams. The application of prestress was completed by the unbonded post-tensioning process. The design parameters of the tested beams are shown in . shows the mechanical parameters of the steel used in welded H-beams and bars. The specimens were selected from C50 commercial concrete. Concrete specimens had an average cubic compressive strength of 55.3 MPa.
Figure 2. Cross-sectional reinforcement diagram.
Table 2. Parameter of specimens.
Table 3. Mechanical properties of steel.
2.2. Loading method and measurement point arrangement
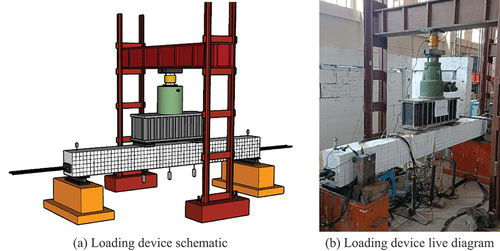
The test used a four-point bending graded loading method, and the loading device is shown in . The test procedure began with the preloading of the specimen, followed by the commissioning of the test equipment, and subsequently initiating normal loading. The load increment for each stage of normal loading was 10% of the estimated ultimate load. Upon reaching 90% of the estimated ultimate load of the tested beam, the loading approach was altered to displacement-controlled loading at a 2 mm/min loading speed until the specimen was destroyed. The crushing of the concrete in the compression zone indicated damage to the tested beams. The loading ceased when the load on the specimens decreased to 0.85 times the ultimate load.
Figure 3. Test device and instrumentation.
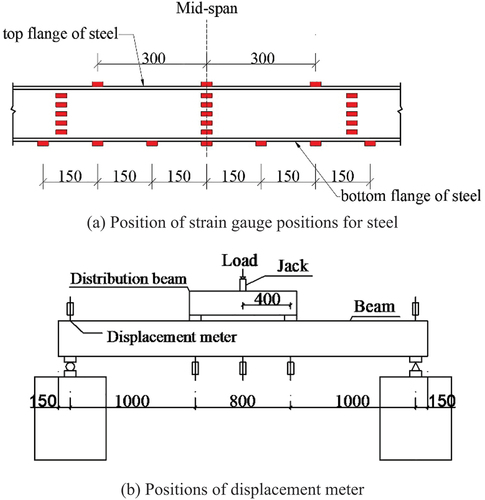
The vertical deformation of the specimen was measured by displacement meters. Three displacement meters were evenly arranged in the span section of the specimen, and two displacement meters were arranged at the support. To quantify the strain variations over the whole test, strain gauges were positioned at 150 mm intervals along the length of the pure bending section’s longitudinal reinforcement. The arrangement of the strain gauges for the section steel is shown in , and the position of the displacement gauges is shown in .
Figure 4. Arrangement of strain gauge and displacement meter.
3. Experimental results and analysis
3.1. Failure mode
As shown in , all specimens exhibited bending damage mode. At the initial stage of loading, no early cracking occurred in tested beams due to the applied prestressing load. The specimens cracked when the load was increased to 0.22 ~ 0.3 times the ultimate load (Pu). The tensile reinforcement yielded when loaded to (0.49 ~ 0.6) Pu. The load when the bottom flange of the steel at the pure bend section was completely yielded is taken as the yield load (Py) (J, M, and Z Citation2014). When the specimen was subjected to (0.74 ~ 0.91) Pu, yielding occurred in the bottom flange of the steel. This led to an increased rate of deflection, as well as a rapid extension of cracks from the tensile zone towards the position of the neutral axis. When the web yielded to (0.37–0.75) times the height of the web, the concrete in the compression zone crushed and the specimens reached the ultimate bearing capacity. After that, the bearing capacity of the beams started to drop slowly, and when the load dropped to 0.85 Pu, the unloading was completed. The ultimate load Pu and yield load Py of each specimen are listed in .
Figure 5. Damage pattern of some test beams.
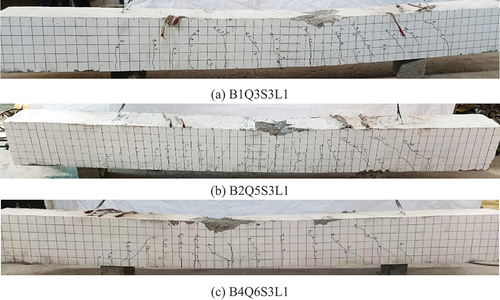
Table 4. Yield load, ultimate load of the test.
3.2. Load-deflection curves
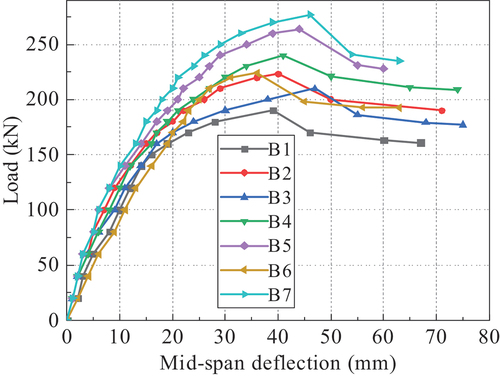
shows the comparison of the load-deflection curves of the seven specimens. Comparing specimens B1 and B4, the bearing capacity of the test beams was increased by 26.3% when the steel strength grade was increased from Q355 to Q690. In comparison to specimens B3 and B7, when the steel ratio was increased from 2.27% to 4.4%, the bearing capacity was increased by 31.9%. The carrying capacity of the members rose by 17.9% when the longitudinal reinforcement ratio was raised from 1.09% to 2.29%. The above analysis shows that increasing the steel strength grade, steel ratio and longitudinal reinforcement ratio can improve the bearing capacity of PSRC beams.
Figure 6. Load-deflection curves for different beams.
3.3. Strain distribution of cross-section in the span
The strain distribution of steel and concrete are shown in .
Figure 7. Strain distribution along the depth of the steels.
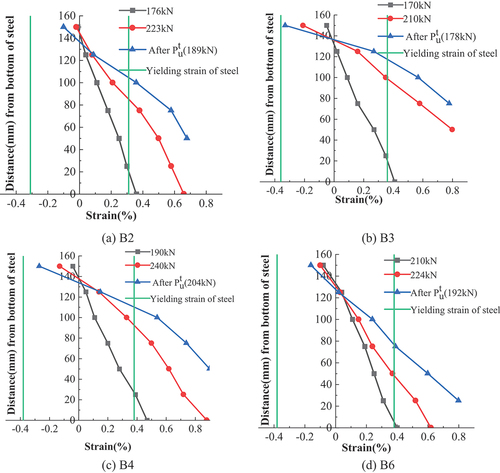
Figure 8. Strain distribution along the depth of the beams.
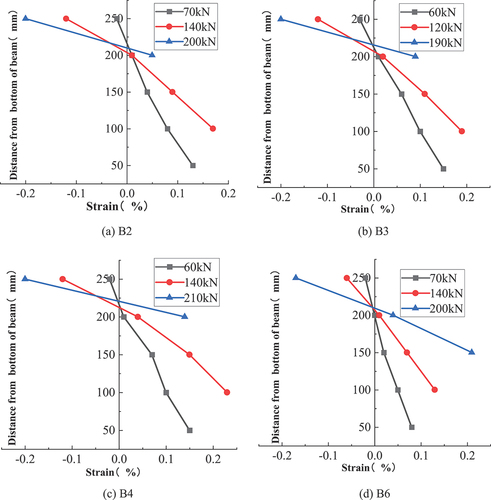
From the figure, it can be seen that:(1) the in-span strain shows a good linear relationship along the direction of beam height, which satisfies the assumption of flat cross-section;(2) the bottom flange of each steel beam is fully yielded under tension, and the steel web is highly yielded, which fully utilizes the tensile strength of the steel. (3) The beams with lower steel ratio (B3) and more compression reinforcement (B4) have a higher utilization of steel strength.
4. Research methodology
The ANN model and the XGBoost model are two commonly used ML models that have demonstrated success in previous research (Li et al. Citation2022; Wakjira et al. Citation2022, Citation2022, Citation2022). The ANN model is composed of multiple basic units called neurons, which transfer information through weighted connections. It possesses the ability to automatically extract and learn complex patterns and features from data. The XGBoost model is an ensemble learning model that combines multiple weak classifiers based on decision trees. This model offers better tunability and requires smaller amounts of data. In this study, both models were employed to predict the bending capacity of SRC beams. Based on the calculated results, the model exhibiting superior performance and more accurate predictions was selected.
4.1. Database for ML models
In this paper, a total of 112 test data of SRC beams including this test were collected, and a database was established (Wang, Wu, and Zheng Citation2009; Zhang, Sima, and Zhang Citation2005; Jia et al. Citation2015; Jiang et al. Citation2022; F, L, and L Citation2007; Li Citation2007, Citation2005; Liu Citation2012; Shao et al. Citation2001; Shen Citation2005; Tang, Zhou, and Zhang Citation2018; Wang Citation2006; Wang et al. Citation2015; Yang Citation2007; Zhang Citation2013). The database covered a total of 11 input parameters, including the width of section b (180-260 mm), the height of section h (200-400 mm), the eccentricity distance of section E (−25 ± 75 mm, downward eccentricity is positive), effective prestress fp0 (0–312.5kN), concrete compressive strength fc (20.3–86.2Mpa), yield strength of steel fa (235-840Mpa), yield strength of reinforcement fy (320-552Mpa), modulus of elasticity of concrete Ec (18200–48700Mpa), the cross-sectional area of reinforcement As (144-1718 mm2), the cross-sectional area of steel Aa (1255.9-6208 mm2), and cross-sectional area of prestressing tendon Ap (0-280 mm2). The output parameter chosen was the flexural bearing capacity M. Details of all specimens are listed in Appendix . 80% of the samples in the database were used to train the ML model, while the other 20% were used to assess the model’s performance (Li et al. Citation2022; Tang et al. Citation2015; Wakjira et al. Citation2022).
4.2. The preprocessing method of the model
4.2.1. Indicators to evaluate performance
To assess the performance and accuracy of the ANN model, this section and the following sections used several statistical metrics. These include mean absolute percentage error (MAPE), root mean squared error (RMSE), and coefficient of determination (R2), which are expressed in equations (1)-(3), respectively.
Where, ,
, and
are the average of the true, predicted, and real values, respectively; n is the number of samples.
Mean absolute percentage error (MAPE) and root mean squared error (RMSE) reflect the deviation between the test and predicted values, and the coefficient of determination R2 indicates the degree of linear correlation between the test and predicted values. The lower the values of MAPE and RMSE, the closer the R2 is to 1, which proves the better the prediction performance of the model.
4.2.2. Normalization of models
To control the influence of weights and bias values on the ANN model and to improve the efficiency of the training algorithm, the input parameters were normalized in the training process, and the normalization equation was given in EquationEquation (4)(4)
(4) :
Where x’ is the normalized data; and
default to 0 and 1, respectively;
and
are the maximum and minimum values of the input data.
4.2.3. Optimized models
Hyperparameter optimization significantly enhances the performance and generalization ability of ML models, resulting in improved predictions and more dependable results. In this study, the grid search method was employed to conduct hyperparameter tuning, drawing from successful experiences documented in previous research (Wakjira et al. Citation2022). To address the issue of overfitting, a 10 times 10-fold cross-validation approach was utilized for hyperparameter optimization. The training dataset was randomly divided into 10 groups, each including nine training sets and one validation set. After completing the training process, the validation set was replaced, and this procedure was repeated 10 times.
4.3. Building ML models
4.3.1. ANN model
The artificial neural network proposes weights and deviations of each neuron to connect the layers. EquationEquation (5)(5)
(5) may be used to compute the connection between the values of input and output.
where xi is the value of input; wi is the weight value of the nerve; b is the bias value of the model; f is the activation function; and y is the value of output.
The ANN model used a back propagation (BP) algorithm to predict the flexural bearing capacity of beams, which can minimize the error of a specific training model. The Levenberg-Marquardt (LM) algorithm has the advantages of fast convergence, high accuracy, and efficient handling of redundant parameters. Therefore, the LM algorithm was used in the modeling phase. The ANN model established in this paper sets up an input layer, a hidden layer, and an output layer, as shown in .
Figure 9. Architecture of the ANN model.
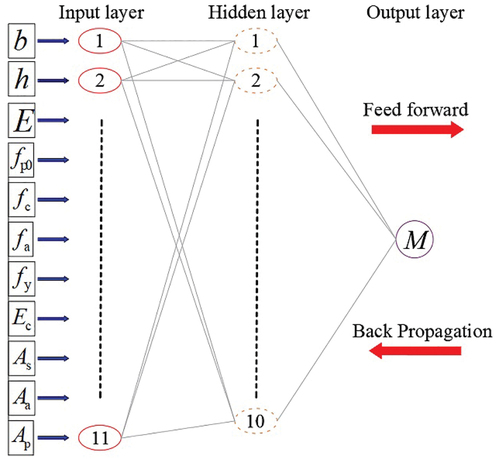
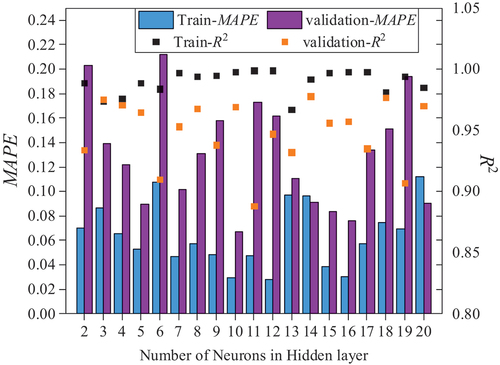
To determine the optimal number of neurons in the hidden layer, the hyperparameter optimization of the model was performed using the methodology provided in Section 4.2.2, which allows multiple attempts at different configurations. Two metrics, MAPE and R2, were chosen to assess the performance of the model with different numbers of neurons. The number of neurons in the hidden layer was increased from 2 to 20, and the calculation results are shown in . The training results showed that different numbers of neurons had a large impact on the model performance. ANN 11-10-1 (11 input parameters, 10 hidden layer neurons, and 1 output parameter) had the smallest MAPE value and high R2 value, which proved the excellent performance of the model. The ANN model utilized a sigmoid transfer function within the hidden layer, which transforms the input signal to produce the encoded output. Meanwhile, a linear transfer function was used in the output layer to provide a mapping of the input to corresponding output values.
Figure 10. Performance of models with different numbers of neurons.
4.3.2. XGBoost model
XGBoost effectively controls the complexity of the model through regularization methods. It uses two regularization techniques: weight decay and leaf-wise minimum constraints on leaf nodes. These techniques help prevent overfitting and improve the generalization ability of the model. The objective function of XGBoost consists of a loss function and a regularization term as shown in EquationEquation (6)(6)
(6) (Chen and Guestrin Citation2016). The regularization term is shown in EquationEquation (7)
(7)
(7) .
where K represents the leaf count; and
denote the regularization hyperparameters;
corresponds to the leaf weights.
Combining the grid search method with the K-fold cross-validation method, the hyperparameter optimization of the XGBoost model was carried out using the training set data. The optimization results of hyperparameters such as the number of estimators, maximum depth, and learning rate are shown in .
Table 5. Optimized values of the hyperparameters for the XGBoost model.
5. Predictive performances of models
5.1. Calculation methods of the current codes
At present, there are two main methods for calculating the flexural bearing capacity of SRC beams: one is the Superposition Method, such as the Japanese Standard for Calculation of Steel and Bone Concrete Structures (AIJ- SRC (Citation2001) Citation2001); the other is the Deformation Synergy Method, such as the Code for Design of Prestressed Concrete Structure (JGJ 369–Citation2016) in China.
(a) AIJ-SRC 2001
where, is the bearing capacity of prestressed reinforced concrete;
is the bearing capacity of the section steel; x is the height of the concrete compressive zone;
is the plastic development coefficient of cross-section, 1.05 for H-beams;
is the resistance moment of the section steel;
,
,
and
are the yield strength of the compression reinforcement, tensile reinforcement, section steel, and steel strands respectively;
,
and
are the distance from the center of the tensile and compression reinforcement, and steel strands, respectively, to the edge of the compressive zone;
,
and
are the cross-sectional areas of tensile reinforcement, compression reinforcement, and steel strands respectively.
(b)JGJ369–2016
The specific section stress distribution is shown in . The specific meaning of symbols in the formula is detailed in the specification JGJ 369–2016.
Figure 11. Stress distribution diagram of beam section of JGJ369–2016.
5.2. Comparison of the predicted results
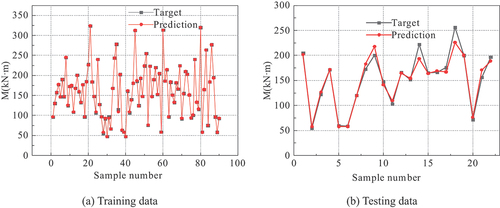
show the comparison between the predicted and tested values in the training and test sets computed by the ANN model and XGBoost model. The R2 of the ANN model was 0.998 and 0.969 for the training and test sets, respectively; the MAPE was 0.0297 and 0.067, respectively; and the RMSE was 10 kN·m and 12.66 kN·m, respectively. The R2 of the XGBoost model was 0.999 and 0.962 for the training and test sets, respectively; the MAPE was 0.0055 and 0.044, respectively; and the RMSE was 1.072 kN·m and 11 kN·m, respectively. The values of RMSE and MAPE for the XGBoost model are less than the ANN model, which indicates that the model is more predictive than the ANN model and the model generalizes better.
Figure 12. Comparison of the predicted and experimental values of the ANN model.
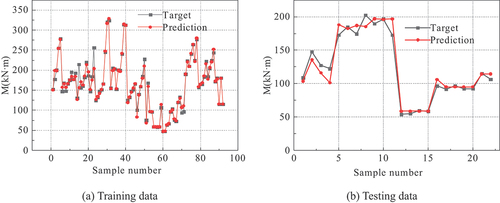
Figure 13. Comparison of the predicted and experimental values of the XGBoost model.
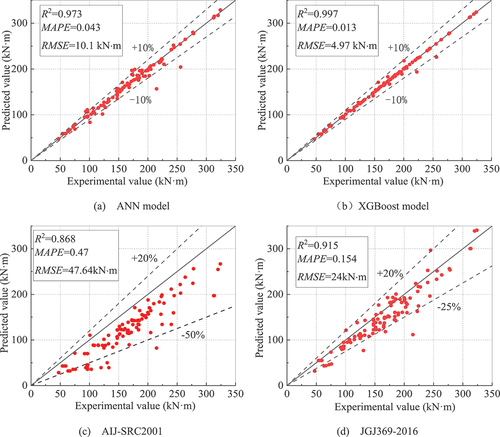
For a more visual comparison, the calculated results of the ANN model, XGBoost model, JGJ 369–2016, and AIJ-SRC2001 were compared with the test values, as shown in . The XGBoost model calculated R2, MAPE, and RMSE of 0.994, 0.013 and 4.97 kN·m, respectively, which are within 10% error from the experimental values. The errors between the calculated results of the ML models and the test values are smaller than those of JGJ 369–2016 and AIJ-SRC 2001, indicating that the flexural capacity of SRC beams calculated according to the code is on the conservative side. The calculated results of the ML models are closer to the test values and have higher prediction accuracy, while the XGBoost model has better prediction performance than the ANN model.
Figure 14. Comparison of models and codes.
5.3. Sensitivity analysis of the XGBoost model
XGBoost model can be regarded as a black box model, even though the model has good performance on the training set, we still cannot explain the decision-making process behind the model. Shapley interpretation method provides an interpretable approach that allows us to understand how each feature is ranked and decided based on its impact on the model prediction, and this methodology has been used with previous machine learning research with success (Gao and Lin Citation2021; Mangalathu, Hwang, and Jeon Citation2020; Wakjira et al. Citation2022). With Shapley’s Interpretive Approach, we can understand the extent to which each feature contributes to the model’s predictions, which allows us to understand which features are most critical to the model’s predictions and how they affect the model’s output.
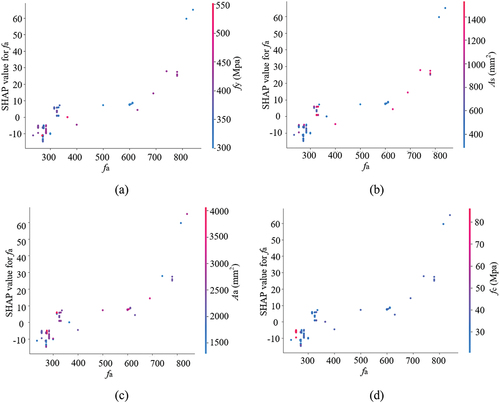
illustrates the distribution of Shap values for each input parameter. The position of each point on the x-axis indicates the Shap value of each factor indicating the effect of each factor on the flexural capacity of the SRC beams, and the y-axis gives the factors in order of importance. The colors in indicate the values of the factors. The average of the absolute Shap values for each input variable is plotted in in descending order of its importance. As can be seen from the figure, the four most influential factors are the yield strength of section (fa), the section area of section (Aa), the cross-sectional area of the reinforcement (Aa), and the section height (h). In addition, shows the results of the analysis based on the correlation of SHAP features. From , it can be seen that there are negative interactions between section and reinforcement, and section and concrete strength.
Figure 15. Shap values of input parameters, (a) each point (b) average value.
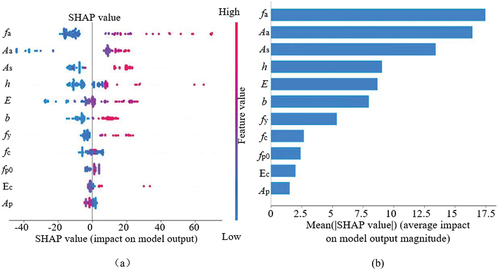
Figure 16. Interaction plot of factors.
6. Conclusion
In this paper, flexural performance tests of seven types of PSRC beams were completed. After collecting and building a database containing 112 sets of credible test data, two ML models were developed to predict the flexural capacity of SRC beams. The computational results of the ML models were compared with the specifications. The main result of this study is that the machine learning model suitable for predicting the load bearing capacity of SRC beams is selected through comparison, avoiding the tedious manual calculation process, but the main problem of the study is that fewer experimental data is collected, and more experimental data on the flexural capacity of SRC beams will be collected in the future, so that the model’s generalization ability and accuracy can be further improved. The main conclusions of this paper are as follows:
Increasing the steel strength grade, steel ratio and longitudinal reinforcement ratio can increase the flexural bearing capacity of PSRC beams.
Compared with the calculation results of JGJ 369-2016 and AIJ-SRC 2001 for the flexural capacity of SRC beams, the prediction results of ANN model and XGBoost model are in good agreement with the experimental results, and the error is within 10%, which can predict the flexural capacity of SRC beams more accurately. The generalization ability and stability of the XGBoost model are better than that of the ANN model.
The sensitivity analysis of the model shows that the correlation between the input parameters and the flexural capacity is in the following order: steel yield strength > steel cross-sectional area > steel cross-sectional area, and there is a negative interaction between the strength of the steel section and the reinforcement, and between the strength of the steel section and the strength of the concrete.
Acknowledgements
This research was financially supported by the National College Student Innovation and Entrepreneurship Training Program (202210225271) and the Fundamental Research Funds for the Central Universities (2572019CT01).
Disclosure statement
No potential conflict of interest was reported by the author(s).
Additional information
Funding
Notes on contributors
Zhibo Bao
Zhibo Bao is an undergraduate student at Northeast Forestry University, majoring in Civil Engineering, and is the leader of the China Student Innovation and Entrepreneurship Program and a recipient of the China National Scholarship. is an undergraduate student at Northeast Forestry University, majoring in Civil Engineering, and is the leader of the China Student Innovation and Entrepreneurship Program and a recipient of the China National Scholarship.
Jun Wang
Jun Wang is a professor and doctoral supervisor at the School of Civil Engineering, Northeast Forestry University. He is mainly engaged in the research on the theory of combined structures and the basic theory and structure of concrete composites.
Yurong Jiao
Jiao Yurong is a master's student at the School of Civil Engineering, Northeast Forestry University, with research interests in modular structures.
References
- AIJ- SRC. 2001. The Standard for Structure Calculation of Steel Reinforced Concrete Structures. Tokyo: Architectural Institute of Japan.
- Chen, T. and C. Guestrin. 2016. Xgboost: A Scalable Tree Boosting System. in Proceedings of the 22nd acm sigkdd international conference on knowledge discovery and data mining. San Francisco, CA, United states: Association for Computing Machinery.
- F, C., Y. L, and S. L. 2007. “Experimental Study on Flexural Behaviour of Prestressed Steel-Concrete Beam with Simple Support.” Journal of Architectural Structure (3): 62–73. https://doi.org/10.14006/j.jzjgxb.2007.03.009
- Gang M, Jin-Qing J I, Wei-Qing Z H. 2014. “Experimental Study and Bearing Capacity Analysis of Prestressed Steel Ultra-High Strength Concrete Composite Beams.” Journal of Architectural Structure 35 (9): 1–10. https://doi.org/10.14006/j.jzjgxb.2014.09.001.
- Gao, X., and C. Lin. 2021. “Prediction Model of the Failure Mode of Beam-Column Joints Using Machine Learning Methods.” Engineering Failure Analysis 120:105072. https://doi.org/10.1016/j.engfailanal.2020.105072.
- Golafshani E. M., Raha A., Sebt M.H., and Akbarpour H. 2012. “Prediction of Bond Strength of Spliced Steel Bars in Concrete Using Artificial Neural Network and Fuzzy Logic.” Construction and Building Materials 36:411–418. https://doi.org/10.1016/j.conbuildmat.2012.04.046
- JGJ 3 69-2016. 2016. Code for Design of Prestressed Concrete Structures. Beijing, China: Architecture and Building Press.
- Jia, J.Q., Meng, G., Feng, S., and Zhu, W.Q. 2015. “Flexural Ductility of Prestressed Steel Reinforced Ultra-High Strength Concrete Beams.” Journal of Harbin Institute of Technology 47 (4): 64–70. https://doi.org/10.11918/j.issn.0367-6234.2015.04.011
- Jiang T., Wang, Y.S., Xiao, M., and Wang, L. 2022. “Flexural Behavior of CFRP Reinforced Concrete Encased Steel Composite Beams.” China Journal of Highway and Transport 35 (2): 39–51. https://doi.org/10.19721/j.cnki.1001-7372.2022.02.003
- Kabir, M. I., C. Lee, M. M. Rana, and Y. X. Zhang. 2020. “Flexural Behaviour of ECC-LWC Encased Slender High Strength Steel Composite Beams.” Journal of Constructional Steel Research 173:173. https://doi.org/10.1016/j.jcsr.2020.106253.
- Lai B, Liew J R, Venkateshwaran A, Li S, Xiong M. 2020. “Assessment of High-Strength Concrete Encased Steel Composite Columns Subject to Axial Compression.” Journal of Constructional Steel Research 164:20. https://doi.org/10.1016/j.jcsr.2019.105765.
- Li, F., Experimental Research on the carrying capacity of the Prestressed Steel Reinforced Concrete Beam Master’s Thesis, Chongqing University (in China), 2007.
- Li, H., Force property study of flexural member in high strength steel reinforced concrete , in Master’s Thesis, Xi’an University of Architecture and Technology (in China). 2005.
- Liu, X. 2012. “Experimental Study on Flexural Stiffness of Section Steel Reinforced Concrete Beams.” Journal of Guangdong University of Petrochemical Technology 1991:91–103.
- Li, S., Zheng W, Xu T, Wang Y. 2022. “Artificial Neural Network Model for Predicting the Local Compression Capacity of Stirrups-Confined Concrete.” Structures 41:943–956. https://doi.org/10.1016/j.istruc.2022.05.055.
- Mangalathu, S., S.-H. Hwang, and J.-S. Jeon. 2020. “Failure Mode and Effects Analysis of RC Members Based on Machine-Learning-Based SHapley Additive exPlanations (SHAP) Approach.” Engineering Structures 219:110927. https://doi.org/10.1016/j.engstruct.2020.110927.
- Shao, Y., Q. Liu, Z. H. Chen, and P. Zhu. 2001. Experimental Research on Carrying Capacity of Normal Section of Unsymmetrical-Steel Reinforced Concrete Beams. Building Structure. (12):47–49+60. https://doi.org/10.19701/j.jzjg.2001.12.015
- Shen, Y., Experimental Study on Mechanical Behavior of Steel Reinforced Concrete Beams Master’s Thesis, Nanjing University of Science and Technology (in China), 2005.
- Tang H., Li, D.W., Su, Y., Zhao, and J.H., 2015. “Prediction of the Yield Performance of RC Columns by Neural Network.” Journal of Hunan University (Natural Sciences) 42 (11): 17–24. https://doi.org/10.16339/j.cnki.hdxbzkb.2015.11.023
- Tang, C., K. Zhou, and B. Zhang. 2018. “Experimental Study on Flexural Bearing Capacity of Unbonded Prestressed Steel Reinforced Concrete Beams.” Journal of Railway Science and Engineering 15 (5): 1271–1277. https://doi.org/10.19713/j.cnki.43-1423/u.2018.05.024.
- T, Q., B. N, Y. G, J. Kong, C. Zhang, and Z. Kong. 2022. “Experimental and Theoretical Study on Flexural Behavior of High Strength Concrete Encased Steel Beams with Steel Fibers.” Structures 41:1359–1368. https://doi.org/10.1016/j.istruc.2022.05.073.
- Wakjira, T. G., A. Abushanab, U. Ebead, and W. Alnahhal. 2022. “FAI: Fast, Accurate, and Intelligent Approach and Prediction Tool for Flexural Capacity of FRP-RC Beams Based on Super-Learner Machine Learning Model.” Materials Today Communications 33:33. https://doi.org/10.1016/j.mtcomm.2022.104461.
- Wakjira, T. G., Al-Hamrani, A., Ebead, U., and Alnahhal, W. Shear Capacity Prediction of FRP-RC Beams Using Single and Ensenble ExPlainable Machine Learning Models. Composite Structures; 2022; 287. https://doi.org/10.1016/j.compstruct.2022.115381
- Wakjira, T. G., M. Ibrahim, U. Ebead, and M. S. Alam. 2022. “Explainable Machine Learning Model and Reliability Analysis for Flexural Capacity Prediction of RC Beams Strengthened in Flexure with FRCM.” Engineering Structures 255:255. https://doi.org/10.1016/j.engstruct.2022.113903.
- Wang, Z., Study on Cracks and Deflections of Steel Reinforced Concrete Beams Master’s Thesis, Xi ‘an University of Architecture and Technology (in China), 2006.
- Wang, L., S. Nagarajaiah, W. Shi, and Y. Zhou. 2020. “Study on Adaptive-Passive Eddy Current Pendulum Tuned Mass Damper for Wind-Induced Vibration Control.” The Structural Design of Tall & Special Buildings 29 (15). https://doi.org/10.1002/tal.1793.
- Wang, L., S. Nagarajaiah, W. Shi, and Y. Zhou. 2021. “Semi-Active Control of Walking-Induced Vibrations in Bridges Using Adaptive Tuned Mass Damper Considering Human-Structure-Interaction.” Engineering Structures 244:112743. https://doi.org/10.1016/j.engstruct.2021.112743.
- Wang, L., S. Nagarajaiah, W. Shi, and Y. Zhou. 2022. “Seismic Performance Improvement of Base-Isolated Structures Using a Semi-Active Tuned Mass Damper.” Engineering Structures 271:114963. https://doi.org/10.1016/j.engstruct.2022.114963.
- Wang, L., S. Nagarajaiah, Y. Zhou, and W. Shi. 2023. “Experimental Study on Adaptive-Passive Tuned Mass Damper with Variable Stiffness for Vertical Human-Induced Vibration Control.” Engineering Structures 280:280. https://doi.org/10.1016/j.engstruct.2023.115714.
- Wang, L., W. Shi, X. Li, Q. Zhang, and Y. Zhou. 2019. “An Adaptive-Passive Retuning Device for a Pendulum Tuned Mass Damper Considering Mass Uncertainty and Optimum Frequency.” Structural Control and Health Monitoring 26 (7): e2377. https://doi.org/10.1002/stc.2377.
- Wang, L., W. Shi, Q. Zhang, and Y. Zhou. 2020. “Study on Adaptive-Passive Multiple Tuned Mass Damper with Variable Mass for a Large-Span Floor Structure.” Engineering Structures 209:110010. https://doi.org/10.1016/j.engstruct.2019.110010.
- Wang, L., W. Shi, and Y. Zhou. 2019. “Study on Self-Adjustable Variable Pendulum Tuned Mass Damper. the Structural Design of Tall and Special Buildings.” The Structural Design of Tall & Special Buildings 28 (1): e1561. https://doi.org/10.1002/tal.1561.
- Wang, L., W. Shi, and Y. Zhou. 2022. “Adaptive-Passive Tuned Mass Damper for Structural Aseismic Protection Including Soil–Structure Interaction.” Soil Dynamics and Earthquake Engineering 158:158. https://doi.org/10.1016/j.soildyn.2022.107298.
- Wang, L., Shi W, Zhou Y, Zhang Q. 2020. “Semi-Active Eddy Current Pendulum Tuned Mass Damper with Variable Frequency and Damping.” Smart Structures and Systems 25 (1): 65–80. https://doi.org/10.12989/sss.2020.25.1.065.
- Wang, Y., L. Wang, and W. Shi. 2021. “Two-Dimensional Air Spring Based Semi-Active TMD for Vertical and Lateral Walking and Wind-Induced Vibration Control.” Structural Engineering and Mechanics 80 (4): 377–390. https://doi.org/10.12989/sem.2021.80.4.377.
- Wang, J., D. Wu, and W. Zheng. 2009. “Experimental Research on Flexural Mechanical Behavior of Simple Prestressed H-Steel Reinforced Concrete Beam.” Journal of Harbin Institute of Technology 41 (6): 22–27.
- Wang X., YinY., DuM.J., and Song, N. 2015. “Experimental Research on Carrying Capacity of Normal Section of Unsymmetrical-Steel Reinforced Concrete Beams.” Journal of Tianjin University (Natural Science and Engineering Technology) 48 (S1): 17–24. https://doi.org/10.11784/tdxbz201505024
- Wang, L., Y. Zhou, S. Nagarajaiah, and W. Shi. 2023. “Bi-Directional Semi-Active Tuned Mass Damper for Torsional Asymmetric Structural Seismic Response Control.” Engineering Structures 294:294. https://doi.org/10.1016/j.engstruct.2023.116744.
- Wang, L., Y. Zhou, and W. Shi. 2023a. “Seismic Control of a Smart Structure with Semiactive Tuned Mass Damper and Adaptive Stiffness Property.” Earthquake Engineering and Resilience 2 (1): 74–93. https://doi.org/10.1002/eer2.38.
- Wang, L., Y. Zhou, and W. Shi. 2023b. “Seismic Response Control of a Nonlinear Tall Building Under Mainshock–Aftershock Sequences Using Semi-Active Tuned Mass Damper.” International Journal of Structural Stability and Dynamics 2340027. https://doi.org/10.1142/S0219455423400278.
- Yang, B., Experimental Study on Cracks of Prestressed Steel Reinforced Concrete Members Master’s Thesis. Chongqing University (in China), 2007.
- Zhang, B., Experimental research on the flexure performance of unbonded prestressed steel reinforced concrete beams Master’s Thesis, Hunan University(in China), 2013.
- Zhang, J., Y. Sima, and Z. Zhang. 2005. “Test on Flexural Behavior of Steel Reinforced Concrete Beams with Different Steel Ratios.” Building Structure (8):79–80+51. https://doi.org/10.19701/j.jzjg.2005.08.021
- Zu-Qiang L I, Beng-You R E, Jian-Yang X U. 2023. Experimental Study and Finite Element Analysis on Flexural Performance of High-Strength Steel Reinforced Ultra-High Performance Concrete Beam. ENGINEERING MECHANICS 1–15. https://doi.org/10.6052/j.issn.1000-4750.2021.10.0765
Appendix
Table A1. Details of all specimens