
ABSTRACT
In recent years, rapid city development has significantly impacted the microclimate environments in urban blocks. Many studies have shown that varied built-up environmental factors lead to corresponding degrees of influence on microclimate. Urban blocks are one of the most concentrated urban settlements, and their impact on the urban climate and environment cannot be ignored. Taking the Fengtai district in Beijing as an example, using the ArcGIS platform inputted with meteorological data and built-up environment data, this study selected climate-sensitive units in the Fengtai district, of which 746 highly sensitive block units were obtained. SPSS software was used to analyze the correlation between built-up environmental factors and climate elements, and the relationship between the degree of influence and magnitude was analyzed using a regression equation. An optimization strategy for built-up environments on an urban block scale was proposed. A model for improving the climate environment at the urban block scale is summarized. Coupling study between climate environment and influencing factors at the urban block scale is an effective way to deal with the improvement of the urban microclimate environment and refinement transformation in the post-epidemic era.
1. Introduction
A city is an environmental form created by high-density buildings and human aggregation. With the rapid development of city economy and technology, the continuously growing urban built form provides diverse and convenient human living environments. On the other hand, high-intensity development has transformed the natural environment to become man-made, changing the original natural climate environment. This specific urban space which differs from the natural climate environment or building interior spaces has an “urban microclimate” (Yang, Zhang, and Xiuzhang Citation2016). Urban blocks are important for production work, living scope, and social interaction. However, excessive development, such as high built-up density, overweighting of the underlying surface, and intensive road networks, leads to deterioration of the urban microclimate and affects the living environment.
Numerous studies have shown that different types of greening are key factors in thermal environments based on the same green coverage rate (Hongzhong et al. Citation2019). In Beijing, the impermeable road surface temperature within the sixth ring is maintained above 40 °C, which in commercial areas reaches 45 °C in the summer (Liu and Song Citation2018). The influence mechanism of various social factors on the urban thermal environment at the microscale was studied, and the results showed that the influence of decreasing volume on the surface thermal environment was as follows: warehousing land, transportation facilities, industrial land, commercial service land, public management and services, residential land, and municipal public facilities (Zhang, Guo, and Sun Citation2012). In addition, the urban form, height-width ratio of street space, and planting coverage are crucial factors influencing the urban climate environment. Since 2006, Professor Ng En rong’s team at the Chinese University of Hong Kong has been conducting research on urban climate maps for high-density cities, taking into account land use information, terrain, vegetation, and wind environment, as well as information on buildings, streets, and outdoor open spaces. At the same time, the urban environmental map of Hong Kong also delineates “urban climate sensitive areas” (Ren Citation2012).
There have been many theoretical and practical achievements in the study of climate environment at the urban scale in the field of urban planning. In recent years, refined urban climate environment research based on different scales has gradually become a hot topic. Among them, small-scale urban climate environment research mainly focuses on actual analysis and simulation of microclimate. In the context of global climate change, governments and relevant agencies such as the United Nations Environment Programme(UNEP) have made local microclimate change a focus of climate and environmental research, and how to respond to climate change through reasonable urban transformation and management has become a cutting-edge field. Binyi Liu,Deshun Zhang and others studied the microclimate environment and human comfort in urban open spaces such as city squares and waterfront spaces (Liu, Wei, and Shuling Citation2017; Zhang and Wang Citation2017); Ludi Dong et al. conducted measurements and analysis simulations on the microclimate environment of urban outdoor activity spaces in Xi’an region (Dong, Fan, and Dongzhi Citation2016); Wei Wang et al. compare three types of weather datasets, from EPW data, from an urban climate station, and from long-term measurement with a local micro-climate station at Southeast University campus and proposed there are significant gaps between the three weather datasets (Wang et al. Citation2021); Finaeva conducted research on the microclimate environment of urban public spaces in Italy (Finaeva Citation2017); The author conducted actual measurements and simulations on the urban block space in Beijing, and proposed a microclimate environment optimization strategy for the green space pattern of the block (Yang and Duan Citation2018; Yang et al. Citation2022).
This study started with a microclimate change scale, focusing on urban blocks, and exploited the influencing factors and magnitude connections of climate change at the microscale through the influence mechanism of built environment factors on the climate environment by combining surface temperature with meteorological station data. This research drew attention to climate environments under human body sensation as a part of urban living quality, which is of great significance for improving the comfort level of Beijing’s living environment.
2. Data sourcing and processing
2.1. Regional overview
As one of the six central districts of Beijing, the Fengtai District (FTD) is located in the south, occupying approximately 306 square kilometers, the set with characteristic landmarks, such as the agricultural production market, Yongding River cultural belt, and ecological park. The ongoing spotted site impacts the FTD and imperceptibly changes the existing built form as well as the urban climate environment. The current local plan Beijing City Master Plan 2016–2035 carries a spatial strategy: one core, one central zone, one auxiliary area, parallel with two axes, multi-focus points, and one district. The FTD lies along one of the two axes and partially falls into the central zone. As such, the FTD is a strategic urban component for Beijing’s capital city, and climate environmental improvement of the FTD is essential for the sustainable future of Beijing.
2.2. Data preprocessing
2.2.1. Data sourcing
Beijing is characterized as hot, with heavy rain in summer and dry cold in winter. This study focused on the summer climate environment, in which basic meteorological data were obtained in the summers of 2019 and 2020.
The meteorological environment elements mainly include air temperature, wind speed, relative humidity, Air Quality Index (AQI), and surface temperature. Temperature, wind speed, relative humidity, and AQI data were obtained from the Beijing Meteorological Service. Surface temperature data were obtained from LANDSAT8 during the summer of 2019.
Built environmental elements mainly include buildings, roads, vegetation coverage, and land use. The data for buildings and roads were sourced from the Open Street Map, packaged with building boundaries, building distributions, road distributions, and road lengths. Land use data were collated and summarized using GlobeLand30, the latest land cover data in 2020 released by the Ministry of Natural Resources of the People’s Republic of China. The vegetation coverage data, reflecting the vegetation situation in summer, were obtained in July 2020 by Resource Satellite Three (ZY-3), a high-precision remote sensing satellite.
2.2.2. Data analysis of built environment
Spatial data analysis was performed using the ArcGIS and ENVI software platforms. According to the urban characteristics of Beijing central city, land use is divided into five categories: bare farmland, building land, green space (forest, grass, and park), artificial surface (square and road), rivers, and lakes ().
Table 1. Classification statistics of urban land use in Fengtai district.
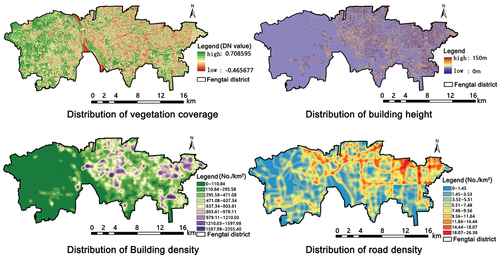
In terms of building classification, based on the Residential Building Design Specification, Design Code for Civil Buildings GB 50,352–2005》, and Fire Prevention Code for Tall Building Design, the building types were divided into low-rise, multi-story, small high-rise, middle high-rise, high-rise, and super high-rise buildings. From the urban road perspective, a highway density map was generated based on the existing road distribution. Vegetation coverage data were extracted from the ZY-3 ().
Figure 1. Classification distribution of building height, building density, road density, and vegetation coverage.
2.2.3. Meteorological element analysis
The temperature, wind speed, and relative humidity data monitored by 15 meteorological stations of FTD were preprocessed by the Radial Basis Function (RBF) interpolation method using the ArcGIS software platform. The AQI, a dimensionless index based on the concentration of six pollutants (SO2, NO2, PM2.5, PM10, CO, and O3) stipulated by the grading limits of《Ambient air quality standards (GB3095–2012), which provides an intuitive description of air quality, was obtained through the RBF interpolation method for distribution. Surface temperature data were processed using Landsat 8 remote sensing satellite images. Basic calculations such as radiometric calibration and atmospheric correction were performed on the original satellite images using the ENVI software. By applying inversion of the atmospheric correction method, a surface temperature distribution map was obtained with a spatial resolution of 30 m × 30 m.
2.2.4. Sensitive mapping of climatic environment
Through data processing of meteorological elements and the built environment, a block-scale distribution map of climate-sensitive units in the FTD was established. The built environment and climate environment elements were analyzed using the Weighted Overlay method. The degree of influence was equivalent, and the sensitive distribution map of meteorological elements was presented using sensitive grades with a spatial resolution was 30 m.
In terms of meteorological elements, a Weighted Overlay analysis was conducted for the varied impacts of the above five indicators on summer climate sensitivity. The air temperature, AQI, and surface temperature had positive effects, whereas the wind speed and relative humidity had negative effects.
For the built environment, the Weighted Overlay method was applied to analyze the varied sensitivity influences of building density, road density, building height, vegetation coverage, and land use on the built environment. Among these, building density, building height, and road density had negative effects on the sensitive areas of the built environment, while vegetation coverage had positive effects. In terms of land use, bare farmland has little effect on the built environment. Parks, rivers, and lakes had a positive impact on the built environment, whereas building land and artificial surfaces (squares and roads) had a negative impact. In such cases, when the weight was assigned, bare farmland was ranked as the 2nd type, parks, rivers, and lakes were ranked as the 1st type, and construction land and artificial surfaces (squares and roads) were the 3rd types.
The combination of urban climate factors and built environment factors affects the sensitivity results of climate environment, but the weights vary. The built environmental factors have a significant potential impact on urban climate. Shuyu Liu et al. summarized that urban built-up areas have a greater impact on climate factors in urban areas compared to rural environments. In terms of temperature, for every 10% increase in construction land area, the temperature increases by 0.3K (heat island intensity index). When 50% of the surface is covered with concrete or asphalt, the temperature increases by 1.5K (Liu, Song, and Wang Citation2014a); George et al. used principal component analysis to compare main factors affecting urban thermal environment, with vegetation coverage contributing the most (Qiao and Tian Citation2014); In a numerical study on the impact of extreme high temperatures in Beijing during summer, Zuofang Zheng et al. verified that urban underlying surfaces have lower reflectivity compared to suburban underlying surfaces (the former is 10%, while the latter reaches 18%), with higher sensible heat absorption (Zheng et al. Citation2012). In summary, based on the research results of multiple scholars, the research defines the weights of the two factors that affect sensitivity of urban climate environment as 80% of the built environment factors and 20% of the climate environment factors.
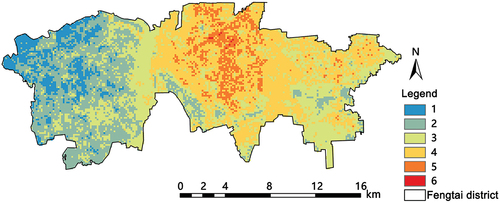
According to the accuracy of the spatial data, the assessment level was divided into six levels, of which level 1 was the region with the optimum climate sensitivity, and level 6 was the region with the least climate sensitivity. The pixel size of the unit was set to 150 m × 150 m, referring to the block scale ().
Figure 2. Climate sensitive map at block scale, FTD.
3. Analysis of built environment elements of climate-sensitive units at block scale
3.1. Selection of sensitive units at block scale
The analysis results of block-scale climate-sensitive units showed that the distribution characteristics of climate-sensitive units were high, concentrated in the center, and low in the periphery. The central high sensitivity degree was approximately levels 5 to 6, containing a total of 746 units. Combined with the geographical satellite map, it was found that the western part was mainly mountainous land with decent quantities of forestry parks and the Yongding River. The vegetation coverage was high, density of buildings and roads was low, and surrounding environment was good. The eastern highly sensitive land was mostly urban built zones, with a small number of residential green spaces. Important traffic stations, urban railway tracks, and intensive urban zones were found in the central area, which contained scattered green spaces and insufficient vegetation coverage.
3.2. Statistics of meteorological parameters and built environment elements
After the selection of 746 highly sensitive unit blocks, the meteorological element data and built environment elements of each block were collected; the main elements are shown in .
Table 2. Calculation method of relevant factor data.
3.3. SPSS correlation analysis
For the coupling study of the urban built environment and climate environment, it is necessary to clarify whether there exists a mathematical correlation between indicators, that is, whether the built environment elements affect the climate at the block scale, and if so, what are the main influencing factors. To reveal the relationship between independent and dependent variables, SPSS software was employed for statistical data analysis, through which correlation analysis of influencing factors was conducted based on the 746 datasets of the highly sensitive units in FTD; the results are shown in .
Table 3. Correlation statistics between built environment elements and meteorological elements.
As a result of the above analysis, we found that significant influences existed between the indicators. Temperature was mainly influenced by the average population(The positive correlation coefficient is 0.280), proportion of green spaces, average building height, and proportion of building area. Wind speed was affected by the proportion of building area(The positive correlation coefficient is 0.143), average population(The negative correlation coefficient is 0.579), average building height, proportion of green space area, proportion of impervious road surface area, road density, and building density. Relative humidity was affected by the proportion of building area(The positive correlation coefficient is 0.109), road density and building density(The negative correlation coefficient is 0.218), average building height, and proportion of impervious road surface areas. In terms of AQI, average population(The positive correlation coefficient is 0.330), proportion of impervious road surface area, road density, building density, and proportion of building area(The negative correlation coefficient is 0.143) were the main influencing factors. Except for the average population indicator, all other factors had significant impacts on land surface temperature.
The correlation analysis showed that the influence of the proportion of building area appeared in each meteorological environment indicator, and the proportion of building area to air temperature showed a negative correlation. A preliminary analysis might be that the projection generated by buildings played a role in reducing the regional air temperature. In terms of wind speed, the proportion of the building area was positively correlated. The larger the proportion of building area, the higher the wind speed, which is likely to be caused by the “street canyon effect” between buildings that strengthened wind speed. Relative humidity and the proportion of building area were positively correlated; that is, the larger the proportion of building area, the greater the relative humidity. In terms of AQI, the proportion of building area was negatively correlated; that is, the proportion of building area was also larger, and the AQI was lower. Surface temperature was positively correlated with the proportion of building area; that is, the larger the proportion of building area, the higher the surface temperature. Therefore, based on the significant correlation analysis above, the climate environment influence degree of the factors at the block scale is prioritized as the proportion of building area > average building height > proportion of impervious road surface area > building density > road density > proportion of green space area > average population.
4. Analysis of the impact degree of block scale built environment elements on climate environmental indicators
4.1. Linear regression analysis
The linear regression method was used to perform a coupling analysis of meteorological environment parameters and built environment indicators at the block scale, in which the independent variables were built environment elements and meteorological environment elements were the dependent variables. The purpose was to study the degree of influence of various built environment elements on the block climate. For linear regression analysis, a large number of data samples were required to clarify the mathematical relationships between independent and dependent variables and to show whether there was a significant influence of variables. It is necessary to measure the fitting degree of the equation and the significance of the regression equation. The closer the fitting degree R2 is to 1, the higher the fitting degree of the equation, which explains most of the relations between the data. The significance P-value of the regression equation was less than 0.05, indicating that the linear relationship between the independent and dependent variables was highly significant.
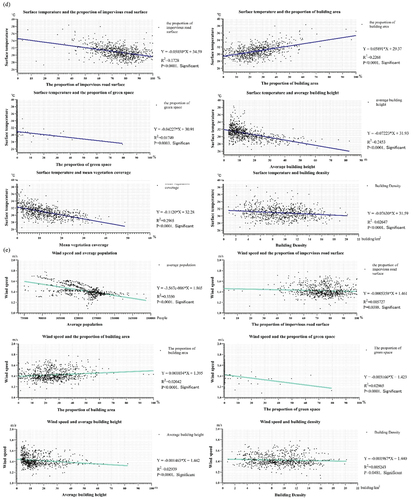
The block scale mainly affected the climate in built environment factors for the proportion of building area, average building height, proportion of impervious road surface area, building density, road density, green space area ratio, and average population. The seven indicators were subjected to linear regression analysis with meteorological elements to obtain regression equations and scatter diagrams( and ).
Figure 3. Scatter regression equation diagram of significant influencing factors. (a) relative humidity; (b) AQI; (c) temperature.
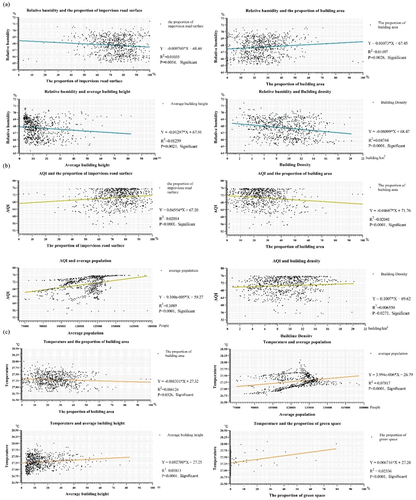
Figure 4. Scatter regression equation diagram of significant influencing factors. (d) surface temperature; (e) wind speed.
4.2. Impact analysis
The regression equation according to the degree of fitting R2, significant P-values, as shown by the surface temperature with the proportion of building area, average building height, and the construction area of impervious surface area ratio, building density, road density, green area ratio, and population average were better fitting degree, R2 was around 0.3, P values were less than 0.05, and the regression equation was significantly higher. The fitting degree of temperature, relative humidity, wind speed, and air quality index was general, R2 was at 0.05, but the regression equation had high significance (P-value was less than 0.05), indicating that there was a significant magnitude relation between independent variables and dependent variables. Through linear regression analysis, the mathematical relationship between the climate environment and building area ratio, average building height, impervious road area ratio, building density, road density, greenspace area ratio, and average population can be obtained. The magnitude relationship is expressed as follows().
Table 4. Magnitude relationship between built environment elements and meteorological elements.
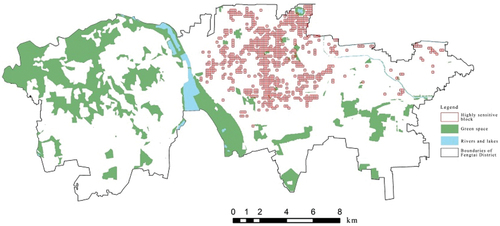
According to the above data, some correlation factors had a relatively abnormal order-of-magnitude relationship, which is contrary to conventional cognition. One of the influencing factors was that the designation of highly sensitive blocks was carried out according to relevant meteorological data and built environment element data without considering the integrity of the functional areas of the blocks. Based on the analysis of the distribution of highly sensitive blocks, it was found that there were potential cooling places with urban green spaces and lakes around some highly sensitive blocks, but there was no green space or water inside the blocks, resulting in the underlying surface of the blocks being calculated within the impervious road area. Excluding this factor, the results of the magnitude analysis remained significant().
Figure 5. Distribution of green land and rivers around high sensitive blocks.
5. Block scale climate environment optimization strategy based on built environment elements
5.1. Analysis of the influence of artificial heat source factors
In the regression analysis and impact magnitude derivation results of the climate environment indicators and built environment factor indicators in the previous step, it can be seen that in addition to factors such as building area ratio, average building height, impervious road area ratio, building density, road density, green space area ratio, the average population value has a significant impact on the local climate environment. At the same time, in the climate sensitive area of FTD, there are many wholesale markets and transportation infrastructure distributed, and from the perspective of land use functions, their artificial heat source emissions are relatively high.
The anthropogenic heat in cities plays a vital role in the environment. In Beijing, the majority of the anthropogenic heat comes from waste heat emitted by automobile exhaust, the energy consumption of industrial production, and various energy consumptions of urban buildings, such as residents’ heating in winter and air conditioning and refrigeration in summer (Hua, Huizhi, and Jianguo Citation0000). A dense urban road network brings convenience to traffic but also releases noise and tail gas. The heat generated by the engines increases the ambient temperature (Liu, Song, and Wang Citation2014b). Road density is the main influencing factor for high-sensitivity unit blocks in FTD. There are also traffic hub stations, such as Liuliqiao, in urban areas, which further expand the scale of heat sources. Therefore, the impact of the urban motor vehicle network on the block climate should be considered during planning. Agricultural trading markets such as Huaxiang, Yuegezhuang, Xinfadi, and other concentrated turnover lands in the distribution of highly sensitive units expand the impervious pavement area to a certain extent, thereby increasing the heat source area. Some scholars believe that stations should be set in crowd-gathering areas, and the space between the two stations can be used as reserved green land to improve the climatic environment of the block. In addition, considering the influence of the underlying urban surface, wherever the motor vehicle speed is limited to less than 30 km/h, the traffic road can be paved without asphalt (Liu, Song, and Wang Citation2014b) to reduce urban heating.
Since urban growth, an increasing number of people pour into Beijing city, while the highly intensive urban built areas accommodate a relatively higher population. Yufeng et al. (Liu et al. Citation2015) found that the population factor was the most closely related to heat island intensity, and it was a comprehensive index that had a prominent influence on the change in heat island intensity. The effect of population density was much larger than that of population scale. Wang Gang et al. (Wang et al. Citation2019) found a high positive correlation between population density, urban ratio, and surface temperature. Overall, in the sixth national census, the total resident population of the FTD was 2,028,708. Compared to the urban types in the standard of permanent resident population, 1 million to 5 million are big cities, 5 million to 10 million are megacities, and more than 10 million are super megacities, FTD population was 2.02 million, matching the standard of big cities. In this case, population is one of the factors leading to an enhanced sensitivity of the urban climate and environment.
Compared with other functional areas, wholesale markets and transportation infrastructure land have the characteristics of low building height, high density, more squares, and low green coverage. Public transportation should be reasonably planned to improve the efficiency of logistics network; The squares adopt eco-friendly materials to reduce reflectivity; Reasonably enrich the planting level of plants and reduce the emission of artificial heat sources; Use green parking lots, temporary potted plants, vertical greening and other ways to increase vegetation coverage.
5.2. Block scale built environment update strategy
The research was carried out on the existing built environment at the block scale; therefore, the optimization and transformation should be combined with the current situation, and there are many restrictions. Utilizing idle land, demolition of illegally built parking lot reconstruction, expansion of green space, and other means to stimulate the microclimate cycle in the block can promote the sustainable development of the urban living environment. Based on the above study, a spatial optimization model of the built environment at the FTD block scale was proposed to be 2.25hm2. According to thePlanning & Design Code for Urban Residential Areas (GB50180–2018), the scale of the proposed model is in line with the residential neighborhood level. Because Beijing is located in building climate zone II, the minimum proportion of green spaces should be 35%. However, based on statistics, the average land use ratio of the highly sensitive units in FTD is as follows:25.65% of the building area, 0.69% of the green spaces, 73.66% of the impervious road areas, and 12.47% of the vegetation coverage. The proportion of green spaces was far below the minimum rate set in the code. Therefore, in an ideal world, the remaining buildings remain unchanged and the proportion of green spaces and impervious road areas should be adjusted to reach a green rate of 35%, which means that the proportion of impervious road areas should be reduced to 39.35%. Multilevel planting on impervious road surfaces can improve vegetation coverage, which can also optimize the climate environment inside the block.
The main influencing factors and their quantitative relations of high-sensitivity units at the block scale were analyzed in the preceding paragraph. The spatial layout of an ideal block built environment plays a role in alleviating the sensitivity of the climate environment. The specific numerical changes are shown in . The data show that the optimized spatial structure of the built environment can effectively alleviate the surface temperature and reduce the heat generation of impervious pavements. Meanwhile, when the relative humidity is balanced, the wind speed is improved, the airflow is accelerated, and the air quality index decreases, which is conducive to the diffusion of pollutants. The material of the urban underlying surface should be floor tiles with low reflectivity and good permeability as far as possible. For squares and other lands that cannot improve vegetation coverage, sunshade devices can be used to alleviate the thermal environment of the blocks.
Table 5. Change value of meteorological elements after spatial optimization of the built environment (“- ‘is decline;’+” is promotion).
5.3. Summary of climate environment improvement model at block scale
At present, many countries have carried out urban space construction oriented by the urban climate environment, providing various strategies to alleviate climate sensitivity. At the urban level, it is the “source” of climate optimization to specify the reserved land for environmental protection, improve the transportation system, and integrate urban functional areas through the formulation of planning policies. To block the scale, preventing the spread of bad weather and processing of the terminal influence is the main purpose. Because the climate environment block is inevitably affected by urban space form, human activities, and other elements, improving the climate environment at the block scale through planning and design methods is critical and urgent. presents an improvement and optimization strategy for the climate environment at the block scale to provide suggestions for sustainable city development.
Figure 6. Climate environment improvement model at block scale.
In view of the characteristics of the built-up environment with high road network density, high building density and low vegetation coverage, the transportation hub area should give priority to improving the greening of roads and three-dimensional transportation, increasing the vegetation coverage, and then increasing the green roof and vertical greening of transportation infrastructure to alleviate the heat island effect in the transportation hub area. Summarize the refined transformation strategy and mode of block scale renewal, including planning level, architectural level and landscape level.
6. Conclusion and discussion
This study has several limitations. Firstly, the basic research data were selected for the summer of July 2020, and the results represent the specific time and space of summer in FTD, Beijing. This has led to a relatively abnormal magnitude relationship between some related factors, which is due to the presence of potential cooling places such as urban green spaces and lakes around some high sensitivity neighborhoods. Future research should continue to focus on annual climate change data on the one hand, and consider the overall functional area of the block on the other hand, in order to further verify these conclusions. Secondly, the proposed ideal spatial model of the built environment to be decentralized or centralized has not been further discussed. In the next step, the amount of data sampling will be increased to deepen research in the time and space dimensions.
Based on an urban block scale, this study established the Beijing Fengtai district climate sensitivity distribution, selected 746 highly sensitive blocks in the built environment and meteorological indicators, and calculated the built environmental indicators of the impact of climate change and the order of magnitude at the block scale through correlation regression. The results showed that the proportions of building area, average building height, impervious road surface area, building density, road density, green space area, and average population in the built environment all showed significant correlations with air temperature, wind speed, relative humidity, air quality index, and surface temperature. Built environment elements at the block scale have a vital impact on the microclimate environment. Second, through a double regression analysis of built environment elements and meteorological indicators, the magnitude relation of the impact was obtained. In particular, if the building area increases by 16–21%, the surface temperature increases by 1 °C, and the air quality index decreases by 1 point. An increase in green land area by approximately 23% can reduce the surface temperature by 1 °C. These quantitative analysis results provide an effective reference value for urban climate-sensitive development in FTD at the block scale. Third, the statistical analysis based on 476 sets of data shows that micro-scale climate environment research cannot be separated from the urban environmental impact of the upper level, and the relevant conclusions need to be corrected by placing urban blocks in the regional environment. Based on the above conclusions, this study proposes an ideal block-scale built environment spatial layout model for FTD climate-sensitive areas and summarizes climate improvement strategies.
Disclosure statement
No potential conflict of interest was reported by the authors.
Additional information
Funding
References
- Dong, L., Y. Fan, and L. Dongzhi. 2016. “An Analysis of Summer Microclimate Survey for Crown Dome Space Under Two-Row Crown-Closure Alee-Trees on Urban Street in Xi’an.” Chinese Landscape Architecture 32 (1): 10–17.
- Finaeva, O. 2017. “Role of Green Spaces in Favorable Microclimate Creating in Urban Environment (Exemplified by Italian Cities).” IOP Conference Series: Materials Science & Engineering 262 (9): 1–6. https://doi.org/10.1088/1757-899X/262/1/012141.
- Hongzhong, L., C. Jinsong, Y. Han, and Z. Yannan. 2019. “Study on the Influencing Factors of the Urban Thermal Environment at the Microscale: A Case Study of Luohu District, Shenzhen City.” Journal of Ecology and Environment 28 (8): 1622–1631.
- Hua, T., L. Huizhi, and S. Jianguo. 2004. “Hu Fei.” Climate and Environmental Research 2004 (3): 409–421. in Chinese.
- Liu, H., and D. Song. 2018. “Research on the Thermal Environment of High-Density Urban Residential Areas with Green Types.” Building Science 34 (2): 66–73.
- Liu, S., F. Song, and S. Wang. 2014a. Contemporary German Construction Guidance Planning Under the Guidance of Urban Climate Problem Solving [M]. Xiamen: Xiamen University Press.
- Liu, S., F. Song, S. Wang. 2014b 12. Contemporary German Construction Guidance Planning Under the Guidance of Urban Climate Problem Solving [M]. Xiamen: Xiamen University Press.
- Liu, B., D. Wei, and L. Shuling. 2017. “A Study of Thermal Comfort at Shanghai Guoge Square.” Chinese Landscape Architecture 33 (4): 5–11.
- Liu, Y. F., Z. H. Yuan, W. KONG, B. Sun, and B. AN. 2015. “Variation Trend and Influencing Factors of Urban Heat Island Effect Intensity in Xi ‘An Urban Area from 1993 to 2012.” Journal of Natural Resources 30 (6): 974–985.
- Qiao, Z., and G. Tian. 2014. “Spatiotemporal Diversity and Regionalization of the Urban Thermal Environment in Beijing.” Journal of Remote Sensing 18 (3): 715–734. https://doi.org/10.11834/jrs.20143030.
- Ren, C. 2012. Enrong Wu, Urban Environmental Climate Map: A Tool for Supporting Information Systems in Sustainable Urban Planning[m], 35–65. Beijing: China Architecture & Building Press.
- Ren, C. 2018 12. Exploration of Sustainable High-Density Urban Development – Contemporary Hong Kong Urban Planning and Design Practice[m]. Beijing: China Architecture and Architecture Press.
- Wang, W., L. Shengguo, S. Guo, M. Min, S. Feng, and L. Bao. 2021. “Benchmarking Urban Local Weather with Long-Term Monitoring Compared with Weather Datasets from Climate Station and EnergyPlus Weather (EPW) Data.” Energy Reports 11 (7): 6501–6514. https://doi.org/10.1016/j.egyr.2021.09.108.
- Wang, G., Q. Zhang, R. Xiao, and D. Guan. 2019. “Effects of Land Use, Population Density, and Altitude on Urban Heat Island.” Journal of Yunnan University (Natural Science) 41 (1): 82–90.
- Yang, X., and J. Duan. 2018. Microclimate Adaptable City: Optimization Method for Green Space Pattern of Urban Blocks in Beijing[m], 100–114. Beijing: China Architecture & Building Press.
- Yang, X., W. Gao, F. Fan, and L. Sha. 2022. “Environment Sensitivity in Urban Administrative Regions—A Case Study of Fengtai District in Beijing.” Chinese Landscape Architecture 38 (6): 51–56.
- Yang, J., T. Zhang, and F. Xiuzhang. 2016 10. Coupling Mechanism and Optimization Design of Wind Environment and Spatial Form in Urban Center [M]. Nanjing: Southeast University Press.
- Yuan, M. 2019 07. Urban Spatial Form and Air Pollution Control [M]. Beijing: China Architecture and Building Press.
- Zhang, D., H. Guo, and Z. Sun. 2012. “Estimating surface characteristic parameters in the megacities and the research on their effects towards the urban heat environment.” Remote Sensing Technology and Application 27 (1): 51–57. https://doi.org/10.11873/j.issn.1004-0323.2012.1.51.
- Zhang, D., and Z. Wang. 2017. “Micro-Climate Effect and Human Thermal Comfort of Square Canopy in Dense Habitat—A Case Study of Shanghai Knowledge and Innovation Community Square.” Chinese Landscape Architecture 33 (4): 18–22.
- Zheng, Z., H. Gao, Z. Wang, and L. Weidong. 2012. “Numerical Simulation for the Urbanization Effects on a Heat Wave Event Around Beijing City.” Ecology and Environmental Sciences 21 (10): 1689–1694.