
 ?Mathematical formulae have been encoded as MathML and are displayed in this HTML version using MathJax in order to improve their display. Uncheck the box to turn MathJax off. This feature requires Javascript. Click on a formula to zoom.
ABSTRACT
Urban green spaces exert beneficial effects on both individuals and communities. However, as urban sprawl intensifies, socioeconomic disparities widen, and populations burgeon, the concepts of green fairness and environmental justice confront substantial hurdles. The daily exposure to greenery emerges as a crucial determinant of these factors, yet no comprehensive methodologies currently exist to gauge the levels of daily accessible urban greenery or to probe the distribution of green inequities. In this research, we harness the capabilities of Spatial Design Network Analysis (sDNA) to scrutinize spatial choice and integration, using the metropolis of Chengdu as a case study. Three indicators representing daily accessed urban greenery are utilized, including the Green View Index (GVI) at the street level, the assessment of green spaces based on the Normalized Differential Vegetation Index (NDVI), and the level of greenery within the visible range of buildings. Green Accessibility Index (GAI) was further proposed and calculated for three states of commuting, recreation, and work to synthesize the accessibility and greenness levels. The distribution of green unfairness in the study area are evaluated using bivariate local spatial autocorrelation. Our findings reveal that (1) frequent expressway commuting and existing greenery does not satisfy urban fairness needs. (2) Significant differences in unfair areas of building visible greenery (3) Unfair areas are concentrated in high-income neighborhoods (4) Severe unfairness between greenery and population in large cities, where most people do not enjoy the benefits of adequate greenery. We provide recommendations based on these findings, thereby offering actionable insights to optimize the spatial distribution of green unfairness through enhanced accessibility of urban greenery.
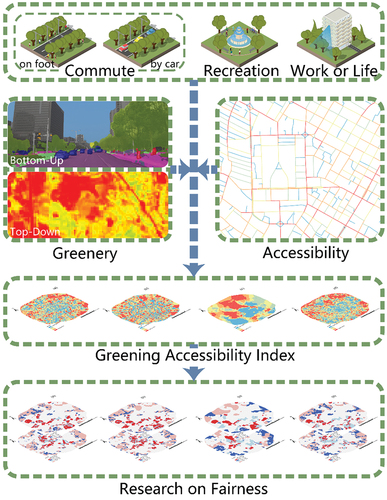
GRAPHICAL ABSTRACT
1. Introduction
Urbanization, a paramount global concern, is projected to encompass approximately 68% of the global populace residing in urban locales by 2050 (Klein and William Citation2021). Over the past two decades, China has witnessed the most dramatic surge in urban built-up areas (Sun et al. Citation2020). In the context of the United Nations’ Sustainable Development Goals (SDGs), this urban expansion underscores the imperative of fostering sustainable cities and communities and ensuring social equality (Bexell and Jönsson Citation2017). Nevertheless, this rapid urbanization has precipitated a plethora of issues concerning existing urban greenery schemes (Wang Citation2009). The scarcity, subpar quality, and inequitable distribution of greenery culminate in a significant portion of the population being deprived of the benefits of greenery (Barbosa et al. Citation2007), highlighting the pressing need to address the SDG targets of creating inclusive, safe, resilient, and sustainable urban spaces (Bexell and Jönsson Citation2017). Consequently, accommodating an increasing number of inhabitants in the future poses a formidable challenge for urban greenery planning (Wolch, Byrne, and Newell Citation2014).
Green spaces, an integral facet of urban landscapes, have garnered escalating attention in recent years due to their multifaceted positive impacts on individuals, encompassing health, economic, environmental, and social aspects (Fam et al., Citation2019; Lee and Maheswaran Citation2011). These benefits span noise reduction (Dzhambov and Dimitrova Citation2014), air pollution mitigation (Hewitt, Ashworth, and MacKenzie Citation2020), enhancement of environmental comfort (Georgi and Dimitriou Citation2010), health improvement (Maas Citation2006), mitigation and cooling of heat island effects (Shen et al. Citation2022), crime rate reduction (Branas et al. Citation2011), provision of recreational and social venues (Roberts Citation2017), potential economic gains (van Zoest and Hopman Citation2014), urban decarbonization and property value improvement (Zhang and He Citation2021). However, from a human-centric perspective, the realization of these benefits hinges on both the quality of the green space and its accessibility, a crucial attribute of greening (Wan and Shen Citation2015). Green spaces with limited accessibility may fail to deliver their full benefits, irrespective of their greenery levels. Existing research substantiates that enhanced accessibility of green spaces positively impacts overall human health (Maas Citation2006), fosters mental well-being (Zhang et al. Citation2015), and optimizes urban vitality (Lopes and Camanho Citation2013). Furthermore, green spaces with high accessibility prove more efficacious in disaster prevention and mitigation (Liu et al. Citation2022) and also yield higher social and economic benefits (Zhou and Parves Rana Citation2012). Therefore, a more comprehensive evaluation of greenery quality necessitates the integration of greenery levels and spatial accessibility (de la Barrera, Reyes-Paecke, and Banzhaf Citation2016).
As the array of greenery evaluation indicators diversifies (Ekkel and de Vries Citation2017), an increasing cadre of scholars have incorporated accessibility into their assessment frameworks (Chen, Yue, and La Rosa Citation2020; Ma Citation2020; Zhang et al. Citation2021). Urban greening inequality often arises from intensified urban sprawl and widening socioeconomic disparities, leading to marginalized areas in urban planning, especially those with lower economic status. The lack of adequate funding and resources allocated to greenery initiatives in these areas further exacerbates inequality (Liotta et al. Citation2020). However, scant research has been conducted that amalgamates both greenery levels and accessibility to holistically evaluate overall greenery quality. Although a Green Accessibility Index (GAI) has been proposed (Fan et al. Citation2017), the weighting calculations are contingent on expert scoring, rendering the process somewhat subjective. Daily accessible greenery refers to the urban greenery that city residents can directly observe, interact with, and appreciate in their daily lives, which has been shown to exert the most tangible positive effects on residents’ well-being (Ye et al. Citation2019). It encompasses all types of urban greenery, but its distinction lies in measuring the level of greenery on a human scale, differing from traditional methods of urban greenery assessment.
Consequently, enhancing the fairness of exposure to daily accessible greenery constitutes an effective approach to promoting environmental justice and generating increased benefits.
In urban contexts, the majority of individuals engage in daily activities such as commuting, working, and recreating, potentially resulting in three scenarios of daily green exposure: 1) Commuting: Amid escalating urbanization and population growth, commuting time has been on the rise (Travisi, Camagni, and Nijkamp Citation2010), rendering street greenery a crucial aspect of perceived green spaces. 2) Recreation: Individuals frequently visit nearby green spaces for recreational, leisure, and sports activities (Neuvonen et al. Citation2007). However, factors such as a limited quantity, low greenery rates, and uneven distribution of green spaces (Shen, Sun, and Che Citation2017), exacerbate green unfairness. 3) Work: Often overlooked is the greenery observed from building windows during work or residential activities. Proximity to greenery has a strong positive effect on individuals (J. Zhang, Cheng, Li, et al., Citation2021), and since people spend most of their time indoors (Hewitt et al. Citation2012), they are more likely to benefit from greenery by looking out of windows (Bi et al. Citation2022). These three are the most crucial and representative scenarios, which are enough to cover the main activities in daily life and are a visual mapping of the four main functions of the city. Consequently, research should encompass accessible street greenery, green spaces, and visible greenery from buildings.
Simultaneously, urban greenery has become a scarce resource, particularly in high-density cities (Haaland and van den Bosch Citation2015; Halecki et al. Citation2023). Many large cities exhibit inequitable distributions of daily accessible greenery and severe green gentrification (Anguelovski et al. Citation2018, Citation2022; Curran and Hamilton Citation2012), exacerbating environmental injustice. This inequity manifests in higher-income groups enjoying greater access to and benefits from greenery, while lower-income, less educated, high-unemployment, and minority communities often experience insufficient greenery (Anguelovski Citation2016; Rigolon and Németh Citation2020; Wolch, Byrne, and Newell Citation2014). Additionally, increased greenery improves the human environment but also drives up regional housing prices (Mansfield et al. Citation2005), rendering housing unaffordable for local low-income populations, who are consequently displaced, further amplifying green unfairness (Schinasi et al. Citation2021; Wolch, Byrne, and Newell Citation2014). In some areas, green spaces may be abundant but underutilized, whereas high-population-density communities may lack adequate green spaces, both situations contributing to green unfairness (Zhong et al. Citation2020). Green inequalities are particularly acute in China due to rapid urbanization and income disparities (Song et al. Citation2021; Wei Citation2017; Wu and Kim Citation2021), and the demand for greenery is increasing as society develops (Song et al. Citation2018; Song, Chen, and Kwan Citation2020; Zhang et al. Citation2021).
Consequently, mitigating green inequalities in urban areas has emerged as a pressing issue in urban planning. However, no study has conducted a comprehensive assessment of the inequitable status of everyday accessible green spaces in cities, leaving several critical questions unaddressed: 1) How can we evaluate greenery based on both its quality and accessibility? 2) How can daily accessible green spaces be assessed comprehensively to encompass all scenarios encountered in the daily lives of city dwellers? 3) How can we accurately measure the inequitable distribution of daily accessible greenery to reflect the true nature of green unfairness? To illuminate these questions, this study endeavors to meet the following objectives: 1) To propose an index and analytical framework for the assessment of daily accessible greenery; 2) To measure daily accessible green spaces across various dimensions, including commuting, recreation, and work; and 3) To investigate the distribution of the inequitable status of daily accessible green spaces. The ultimate goal is to inform the optimization of design strategies for urban green spaces, thereby aiding in the mitigation of green unfairness in cities.
2. Literature review
2.1. Multiscale measurement review of greenery
Traditional manual measurement methods are not suitable for assessing urban greenery due to their high costs. The widespread availability of satellite and remote sensing imagery has provided an alternative means of measuring urban greenery. Initially, visual interpretation of remote sensing imagery and computer scanning were the primary methods; however, they were time-consuming and required increased accuracy. The advent of high-resolution imagery and spectral analysis techniques has improved efficiency (Shahtahmassebi et al. Citation2021; Shojanoori and Shafri Citation2016), and the use of the Normalized Difference Vegetation Index (NDVI) to explore urban greenery quality has become one of the most efficient approaches (Pettorelli et al. Citation2005). However, using NDVI to examine urban greenery quality through satellite remote sensing images is a top-down approach that only partially reflects human perception, especially for street greenery, which is narrower and more challenging to observe. The widespread availability of streetscape imagery offers an alternative perspective (Yang et al. Citation2009) that enables human-scale perception of street greenery to be visualized by calculating green visibility from street imagery.
Significant progress has been made in calculating the Green View Index (GVI) of streetscapes, with data sources evolving from the original random sampling using field photos (Yang et al. Citation2009) to the use of map street views such as Google or Baidu (Chen et al. Citation2019; X.; Li, Saphores, and Gillespie Citation2015), resulting in improved efficiency and data volume. The GVI calculation method has also advanced from counting green pixels (Yang et al. Citation2009) to incorporating deep learning-based semantic segmentation models such as SegNet (Ye et al. Citation2019) and Deeplab (Gou, Zhang, and Wang Citation2022). Currently, the method of calculating street view GVI is well-established. Therefore, combining satellite remote sensing imagery and street view imagery data allows for a more comprehensive and efficient measurement of urban greenery using both top-down and bottom-up strategies.
2.2. A literature review on measuring accessibility
Initially, scholars predominantly employed Euclidean distance to measure accessibility, as greater distances implied less frequent use (Coombes, Jones, and Hillsdon Citation2010). Closer greenery was associated with more significant benefits (Sturm and Cohen Citation2014). However, the Euclidean distance approach oversimplifies spatial accessibility, neglecting the relationship between supply and demand and disregarding the structure of urban space, leading to numerous issues with the results.
The two-step floating catchment area method (2SFCA) was proposed to enhance accessibility measurement (Luo and Wang Citation2003), considering the interaction between supply and demand and effectively reflecting residents’ choices regarding green space access (Xing et al. Citation2018). This method has been extensively applied to assess green space accessibility (Li, Huang, and Ma Citation2021), and many refined models have been improved (Dai Citation2011; Ke et al. Citation2023; Zhang, Cheng, and Zhao Citation2021). Nonetheless, numerous shortcomings still exist, including the fact that the urban spatial structure is not adequately considered, and the results primarily focus on integration to greenery without evaluating the “pass-through” nature of roads.
Spatial syntax is a quantitative analysis of spatial connectivity between roads and the rest of the road network. By employing spatial segmentation, the subspaces formed through segmentation serve as graph nodes, converting the entire network into a spatial connectivity graph. Various morphological analysis variables are derived using graph theory methods to describe the structural characteristics of space (Hillier and Iida Citation2005). This method can be employed to estimate street accessibility and predict movement flows, focusing more on urban spatial morphology. Spatial syntax offers numerous indicators to measure different street attributes, compensating for other models’ shortcomings and providing a better tool for this study. It has also been widely utilized to assess green accessibility and fairness (Ma Citation2020; Ye et al. Citation2019). The main tools to implement spatial syntactic analysis are Depthmap and spatial design network analysis (sDNA) (Cooper and Chiaradia Citation2015), where sDNA has better performance in analyzing spatial patterns at larger scales.
2.3. Exploring the progress of green fairness
Green fairness is a crucial aspect of environmental justice (Jennings, Gaither, and Gragg Citation2012). Numerous studies have investigated the current state of green fairness in cities. Some research has qualitatively analyzed and reviewed cases of regional green unfairness from historical and policy perspectives (Anguelovski Citation2016; Rutt and Gulsrud Citation2016). More studies have used quantitative analysis, with early studies using greenspace averages to measure green fairness, but providing only limited conclusions (Matthew McConnachie and Shackleton Citation2010). Models such as spatial lagged regression can explore the correlation between greenness and other urban attributes, but cannot provide a spatially heterogeneous picture (You Citation2016). Recent studies highlight that the scale and distribution of parks, in tandem with population density and socioeconomic factors, play a crucial role in shaping green fairness. Such research underscores the need to account for multiple determinants, such as accessibility per capita park area, Gini coefficient, vegetation density, and socioeconomic metrics (Diao, Hu, and He Citation2021). Some new indices can efficiently calculate the unfairness of green exposure, but cannot comprehensively measure the daily accessible green exposure of urban residents (Yu et al. Citation2023). Bivariate local spatial autocorrelation is used to explore the high and low clustering of greenery with other elements (e.g., housing prices or population size) (Anselin Citation2003). This approach can better reflect the pattern of green fairness and has been applied in relevant studies (Chen, Yue, and La Rosa Citation2020; Zhu, Li, and Chen Citation2023).
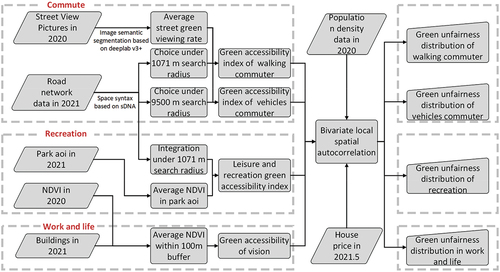
Building on existing research, this study (1) measured the level of visible greenery during commuting, recreation, and working life in the study area by combining top-down remote sensing data and bottom-up streetscape data. (2) Subsequently, the degree of integration and choice of urban streets was calculated based on the sDNA method. (3) Additionally, a Green Accessibility Index (GAI) was developed to comprehensively measure the level of greenery. (4) Lastly, bivariate local spatial autocorrelation was employed to examine the spatial distribution and regional disparities in green unfairness in the study area by incorporating housing price and population count data. This analysis aims to provide a reference for urban green spatial planning and the enhancement of environmental justice. The study’s flow chart is depicted in .
Figure 1. Research stream.
3. Study area and data source
3.1. Study area
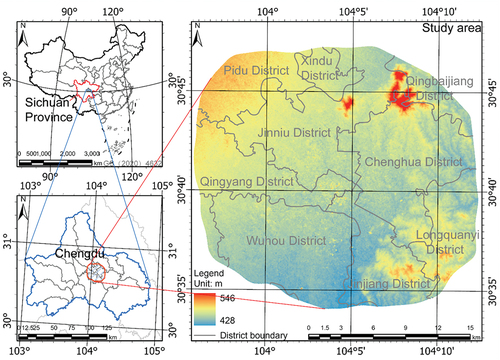
Chengdu, the capital of Sichuan Province in southwest China, is situated in the western part of the Sichuan Basin. As the political, economic, industrial, scientific, and cultural center of Sichuan Province, Chengdu ranks among China’s most important cities (Qin Citation2015). By the end of 2021, the city’s resident population reached 21,192,000, making it the sixth most populous in China. Rapid urbanization (Qu, Zhao, and Sun Citation2014), unbalanced economic development (Chen and Gao Citation2011), and a large influx of people (Qin and Yang Citation2020), have resulted in an extremely uneven distribution of urban greenery within Chengdu (Song et al. Citation2021). As a “park city” demonstration area, the city is placing greater emphasis on green construction. The central urban area of Chengdu primarily encompasses the region within the Fourth Ring Road (Beltway) as depicted in . Spanning approximately 540 km2, this area represents Chengdu’s economic center and most densely populated zone, exhibiting the highest demand for greening and its equitable distribution. Consequently, selecting the central urban area of Chengdu as the study area holds significant research value.
Figure 2. Study area.
3.2. Data source
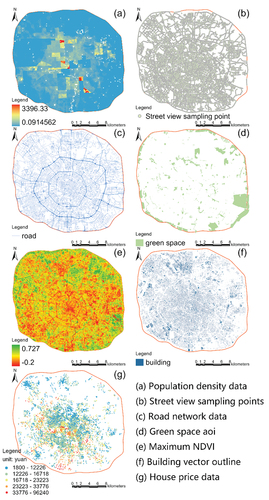
The data utilized for this study are illustrated in . Population counts data, sourced from Worldpop 2020 with a spatial resolution of 100 m, represent the highest resolution population data available (Lloyd, Sorichetta, and Tatem Citation2017). Road map data were obtained from Baidu Map (map.baidu.com). Streetscape data, which include front, back, left, and right streetscape images from 69,649 sampling points, were also obtained from Baidu Map (map.baidu.com) through web scraping. The road network data and building vector outline data were acquired from the Chengdu City Smart City Spatio-temporal Big Data and Cloud Platform (www.chengdumap.cn) and updated in the third quarter of 2021. The green spatial data area of interest (AoI) was sourced from AutoNavi Map (m.amap.com). AutoNavi Maps can provide high-precision and real-time geographic information data. Accurate and timely green space data is of great significance in evaluating the level of green space(Liu et al., (Citation2019)). NDVI data were obtained from the 2000–2020 China 30 m annual maximum NDVI dataset, provided by the Land Use and Global Change Remote Sensing Team at the Institute of Geographical Sciences and Resources, Chinese Academy of Sciences (www.nesdc.org.cn), for the year 2020. House price data for May 2021 were collected from Anjuke (www.anjuke.com), one of China’s largest property transaction platforms.
Figure 3. Study data.
4. Method
4.1. Assessment of greenery level
4.1.1. Street green view index
Baidu Street View covers most major cities in China, offering detailed street information and has been extensively employed for urban street greenery monitoring (Yu et al. Citation2022) DeepLabV3+ integrates the Atrous Spatial Pyramid Pooling (ASPP) module with an encoding-decoding architecture (Chen et al. Citation2018) and modifies the standard convolution used in the network to atrous convolution and depth-separable convolution (Chen et al. Citation2017). This modification effectively enhances the model’s segmentation accuracy and generalization capabilities. The model demonstrates a significant advantage in parsing urban built environments, surpassing traditional semantic segmentation models, and has been widely adopted (Li, Yabuki, and Fukuda Citation2022; Xia, Yabuki, and Fukuda Citation2021). Consequently, this study employs the DeepLabV3+ model to extract street GVI from 69,649 collected Baidu Street View images and conducts training and testing based on the Cityscapes dataset (Cordts et al. Citation2016).
4.1.2. Green space greenery level
NDVI is an effective indicator of vegetation density, health, and vigor (Li, Saphores, and Gillespie Citation2015; Pettorelli et al. Citation2005), and has been widely applied in urban green space assessments (Fung and Siu Citation2001; Hatton MacDonald et al. Citation2010). Consequently, the average NDVI within the specified range was extracted using the AoI vector boundary data of green spaces from AutoNavi Maps. This extraction enabled the measurement and comparison of the greenness levels of different green spaces and facilitated further analysis.
4.1.3. Building visible greenery
In high-density urban environments, estimating an individual’s field of vision is challenging due to factors such as building shading, terrain undulation, varying building floors, window orientations, building usage times, and weather conditions (Wang et al. Citation2019). Investigating the level of visible greenery of buildings at the urban scale on a large scale and with accuracy is difficult. However, due to the perspective relationship, greenery near the building comprises a larger proportion of the greenery in the field of view. Therefore, the average NDVI within a 100 m radius around each building was extracted as an indicator to compare the greenery levels in the fields of view of different buildings. This approach can reflect the relative differences in visible greenery of buildings.
4.1.4. Accessibility assessment
Based on the road network within the fourth ring of Chengdu city, road accessibility and choice were calculated using sDNA, with angle selected as the analysis metric. To improve the accuracy of edge data calculations, a 20 km buffer zone was created based on the fourth ring of Chengdu city as the chosen road network data range, which is larger than the calculated maximum radius.
Network Quantity Penalized by Distance (NQPD) indicates how closely a space is connected to all other spaces in a spatially grouped system.
Among them, the and
are the geodesic endpoints; and
is the distance from the link within the radius of the network
the set of polylines.
is the polyline
the weights of the polylines.
is the scale of any dash line y within the radius.
is the origin polyline
and the end polyline
the shortest topological distance between them.
is the metric that defines this distance.
and
default to 1. Nqpdn and nqpdd are indices that adjust for numerator and denominator effects. Under this research, both parameters are set to 1 (Cooper Citation2016).
Two-phase betweenness (TPBt) assesses the ability of movement through and through the road network, focusing on the probability of a spatial node being passed.
represents the starting point and end point, and the
and
are the endpoints of the geodesic lines.
is the set of fold lines in the global spatial system.
is the distance
defines the set of links within the radius.
is the weight of the polyline z.
is the scale of any fold line z within the radius.
is the distance within the radius from each polyline
the total weight of the polyline.
According to the “Commuting Monitoring Report of Major Cities in China” released by Baidu Map and the “Traffic Analysis Report of Major Cities in China” released by AutoNavi Map over the past three years, the average walking commuting distance for megacities at the same level as Chengdu is approximately 1071 meters. The average daily car commuting distance in Chengdu is about 9500 meters, so 1071 meters and 9500 meters are selected as the two search radii for TPBt calculation, representing street walking and driving choices. On the other hand, the “15-minute walking circle” is an essential measure of the degree of public services in a community. Therefore, the 15-minute walking distance, which equates to 1200 meters, is utilized as the search radius of NQPD to indicate the degree of integration.
4.2. Green accessibility index (GAI)
After the greenery index calculation and spatial syntax analysis, the TPBt analyzed in sDNA was assigned to the green visibility point data. The average NQPD of all roads within 50 meters was assigned to the green space vector data after extracting the average NDVI. These are the roads most likely to have entry points into the green space. If there was no road within 50 m, the NQPD of the road with the shortest distance was assigned. Then, greenery was categorized into four types based on accessibility (NQPD or TPBt) and greenness (greenery rate or NDVI). High accessibility and high greenness were considered the best case, as it serves more people and provides a stronger positive effect of greenness; high accessibility and low greenness represented the worst case, as more people use it but experience poor spatial quality; low accessibility-high greenness and low accessibility-low greenness were the middle cases, with the former being slightly better than the latter. A Green Accessibility Index (GAI) was proposed, to combine the two results into one index in the order described for subsequent analysis. First, the greenness index was normalized to [−1, 1], and accessibility was normalized to [0, 1] using the following normalization equation.
is the normalized value, and
is the lower limit of the normalized value, and
is the upper limit.
is the maximum value of the original data, and
is the minimum value. Normalization will change the value but not the distribution of the data, so its trend remains unchanged. Further, after normalizing the NQPD and TPBt to [0,1] and the greenery level to [−1, 1], the Green Accessibility Index GAI is calculated as follows.
At this point, the data has been sorted by high accessibility-high greenness, low accessibility-high greenness, low accessibility-low greenness, and high accessibility-low greenness, with higher values indicating better green accessibility.
To reflect the continuous spatial variation of the data, point data is interpolated into continuous raster images. Further, a hexagonal grid with a side length of 100 meters was created in the study area. The average value of the data within the grid was extracted for the next step of the analysis.
4.3. Unfairness situation analysis
The local spatial autocorrelation assessed by the local Moran index explored the spatial clustering relationship of the geographical variables themselves and represented the specific clustering situation distribution spatially (Anselin Citation1995). The binary local Moran index based on this can measure the spatial clustering relationship between two variables. Its formula is as follows,
of which and
refer to the global and local bivariate Moran’s I, respectively, and
refers to the total number of lattices, and
is a measure of the number of grid squares
and
the spatial weight matrix of spatial correlation, and
refers to the first
standardized house value and population of the first grid, and
refers to the normalized first
GAI of the first grid.
Low GAI-low housing prices are the basis of green unfairness, and high GAI-high housing prices exacerbate this unfairness because it reflects the fact that income level is an essential criterion for enjoying greenness. High GAI-low house prices are a more desirable situation that allows more people to enjoy the positive aspects of greenery. Low GAI-high house prices may be due to the influence of other explanatory variables that make house prices higher, such as accessibility or commercial agglomeration, which will not be discussed in this study. Similarly, a bivariate local spatial autocorrelation analysis was conducted between GAI and population. Low GAI-high population indicates that a large population will have difficulty accessing greenery, which is one of the green inequities. The p-value threshold was set at 0.05 in the study.
5. Result
5.1. Greenery level assessment
5.1.1. Street green vision
displays the average green view rate for each sampling point, with most rates being less than 40%. The green view rate of main traffic roads is notably lower than that of other roads. However, secondary roads within neighborhoods have a slightly higher green view rate. Additionally, some roads along the river or near green areas exhibit higher green view rates. In general, suburban areas have higher green view rates compared to urban areas, particularly in the southeastern suburbs where numerous high green view sampling points are present.
Figure 4. Street view green ratio.
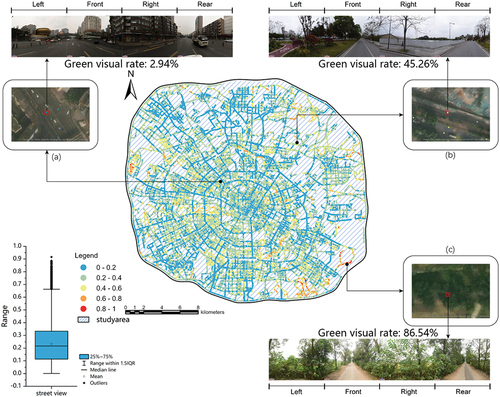
Sampling point (a) of is situated on a broader road with nearly half of the overall visibility area being roads. Surrounded by buildings and fewer street trees, this location has a low green view rate. Sampling point (b) of is on a narrower road, with the left side and front side being part of a strip park, while the right side and rear side are dominated by a site fence. As a result, this location has a medium overall green view rate. Sampling point (c) of is located within a forest path and is surrounded by closer and more trees, leading to a high overall green view rate.
displays the average NDVI within all green spaces in the study area, with most values ranging between 0.25 and 0.4. There are some green spaces in the center and the eastern edge of the study area with lower NDVI values. Green spaces closer to the center of the study area are smaller in area and have a more significant difference in mean NDVI. In contrast, green spaces along the outer side are larger in area, and all have moderate to high mean NDVI values.
Figure 5. Green space NDVI.
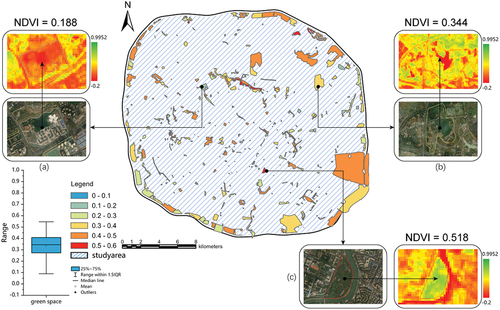
In location (a) of , the southern side is dominated by plazas, representing Paving spaces, while water bodies dominate the northern side. Due to the recent construction, the internal artificial green space has not yet reached a large scale, resulting in a very low NDVI. Location (b) of has good vegetation coverage on the northernmost side, and the southern side also features green space of a particular scale. However, the central water body occupies a large area, leading to a medium average NDVI. Location (c) of is a waterfront green space, but the site does not include water bodies. With less artificial construction and very high vegetation cover, the average NDVI in this location is very high.
5.1.2. Building visible greenery level
shows the average NDVI around the buildings in the study area, which generally ranges between 0.2 and 0.35. The buildings in the center of the study area and the outer side of several urban sub-centers have less visible greenery, especially the buildings near the main traffic roads, which have the lowest visible greenery. In contrast, the more upscale residential areas on the west and south sides and the buildings in the suburbs have more visible greenery.
Figure 6. Building visual NDVI.
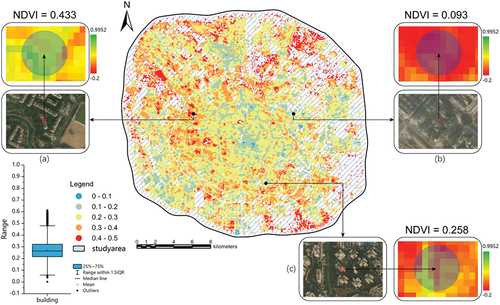
Location (a) of has more waterfront green space on the southwest side, and the northeast side also features more greenery, resulting in a high amount of visible green. Location (b) of has little artificial green space nearby, and the area is mainly covered in hard pavement. The high density of buildings in this location contributes to the low amount of visible green. In location (c) of , the west side has good greenery, while the east side has less greenery, leading to a moderate amount of visible greenery.
5.2. Accessibility analysis results
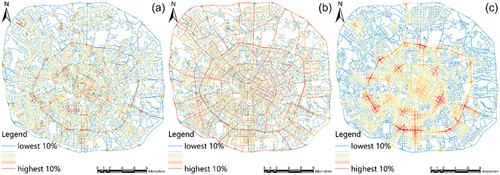
displays the results of the sDNA analysis for 1071 m TPBt, 9500 m TPBt, and 1200 m NQPD in the study area. For 1071 m TPBt, high-value areas are primarily concentrated within the third ring in the center of the study area, with the road arterials being the main high-value roads. Low-value areas are mostly secondary roads within the neighborhoods. In the 9500 m TPBt analysis, ring and radial expressways that connect the whole city serve as high-value roads, while minor roads within the neighborhoods are low-value. There are no obvious areas of high-value concentration in this analysis. For the 1200 m NQPD analysis, high-value road sections are concentrated within the third ring of the study area, decaying outward from the city center and the intersection of the ring and main radial roads. These high-value sections are primarily located in areas with denser road networks.
Figure 7. (a) 1071 m TPBt, (b) 9500 m TPBt, (c) 1200 m NQPD.
5.3. Green accessibility index analysis
delineates the Green Accessibility Index (GAI) and building-visible Normalized Differential Vegetation Index (NDVI) for pedestrian commuting, vehicular commuting, and green space recreation. For both commuting modalities, the distribution pattern manifests a low-value core surrounded by a high-value periphery, predominantly situated near secondary roads within neighborhoods boasting commendable greenery levels. Conversely, the low-value region expands radially from the center outward. However, this distribution is less pronounced in pedestrian commuting compared to vehicular commuting. The GAI of vehicular commuting reveals that the low-value regions coincide with the circular and radially oriented primary thoroughfares.
Figure 8. (a) pedestrian commuting GAI, (b) vehicular commuting GAI, (c) green space recreation GAI, (d) building visible greenery NDVI.
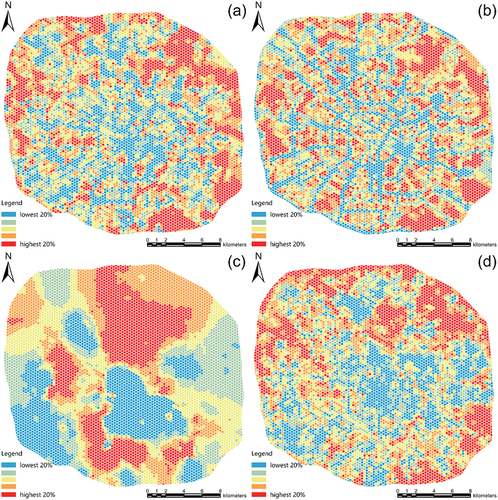
Regarding the GAI of green space, the variation is more modest, exhibiting a lower GAI south of the study area’s center and on the eastern and western fringes, and a higher GAI predominantly on the northern side, with high-value regions also prevailing on the southern side. For the visible NDVI of buildings, the high-value regions are still clustered at the periphery of the study area, with a greater number of high-value regions on the western and northern sides. Low-value regions dominate the center, east, and south sides of the study area.
Overall, the GAI and building-visible NDVI in all three scenarios across the study area demonstrate high values at the periphery and low values at the center, with high values predominantly on the western, southern, and northern sides.
5.4. Green unfairness analysis
As depicted in , the cluster analysis concerning housing prices exhibits similarities between walking and car commuting modalities. The southern and western regions predominantly feature high GAI-high house price clusters. Conversely, high GAI-low house price clusters are mainly concentrated along the eastern and northern peripheries. When compared to walking, car commuting demonstrates a marginally increased proportion of high GAI-high house price clusters and a slightly diminished share of low GAI-low house price clusters.
Figure 9. (A) pedestrian commuting GAI- house price clustering (b) vehicular commuting GAI- house price clustering (c) green space GAI- house price clustering (d) building visibility NDVI- house price clustering.
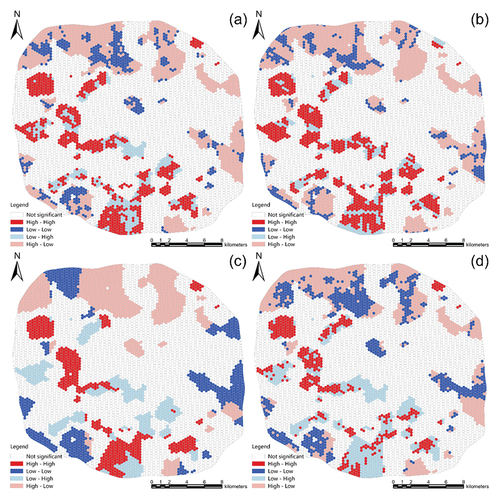
Regarding recreational activities in green spaces, both high and low GAI-high house price clusters continue to be distributed across the western and southern areas. Clusters characterized by low GAI-low house prices are primarily located in the southwest, while those with high GAI-low house prices are mainly observed in the northern region. In the context of visible greenery, high NDVI-high house price clusters are predominantly situated in the western portion of the study area, whereas high NDVI-low house price clusters prevail along the study area’s boundaries.
In summary, high-high and low-high clusters are more frequently observed in the western and southern regions, while low-low and high-low clusters are more prevalent along the peripheral areas.
illustrates the clustering analysis of the GAI and population, highlighting that the central region is predominantly characterized by high GAI-high population and low GAI-low population clusters in both walking and car commuting scenarios. The peripheries, in contrast, are primarily composed of high GAI-low population clusters.
Figure 10. (a) pedestrian commuting GAI-population clustering (b) vehicular commuting GAI-population clustering (c) green space GAI-population clustering (d) building visible NDVI-population clustering.
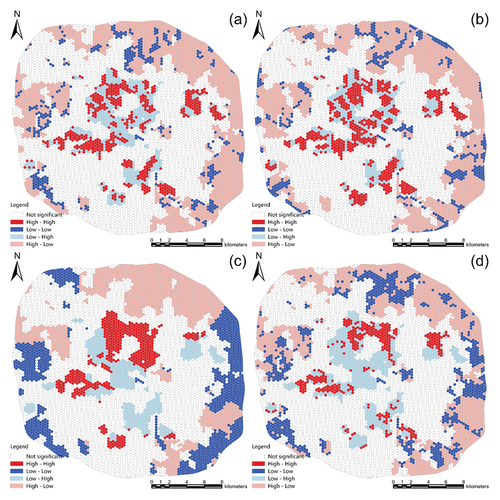
In the context of green space recreation, clusters of high GAI-high population are found in the areas north and west of the study area’s center. The eastern, western, and southern boundaries are predominantly occupied by low GAI-low population clusters. With regard to visible greenery, certain regions north and west of the study area’s center exhibit high NDVI-high population clusters. Nevertheless, the peripheries continue to be dominated by high NDVI-low population clusters.
Overall, the analysis reveals that the central region of the study area serves as the primary distribution zone for low GAI-high population clusters, while the fringe areas are mostly characterized by high GAI-low population clusters.
6. Discussion
6.1. The status of daily accessible greenery in the central city of Chengdu
For commuter greenery, main roads in the study area exhibit low greenness but high choice, resulting in low GAI areas for car commuting that almost overlap with the main roads. Additionally, the choices of some low greenery sub-roads in pedestrian commuting are also higher, so the high and low values of GAI are distributed between. The overall GAI is higher in peripheral areas due to their higher greenness, despite slightly fewer choices.
In terms of green space, the northern part of the study area benefits from higher vegetation cover and accessibility, leading to higher GAI. While the central city offers higher accessibility, it suffers from low quantity and quality of green spaces, yielding a low GAI. The western and southern parts feature green spaces with higher vegetation cover and accessibility, resulting in better green accessibility.
Regarding building-visible green, the center of the study area is predominantly occupied by artificial surfaces and buildings, causing the level of building-visible green to be very low. In contrast, the western and northern areas have better levels of building-visible greenery. In the peripheral areas, development intensity is lower, natural vegetation is better preserved, and the level of building-visible greenery is higher.
Overall, urbanization has led to vegetation destruction, a smaller area of artificial green space, and a larger area of man-made surfaces and buildings. Many high-intensity development areas within the city lack daily accessible green spaces, while suburban areas maintain better preservation of original vegetation and offer more daily accessible green spaces.
6.2. Fairness of the current situation of daily accessible greenery in the central city of Chengdu
In terms of the distribution of unfairness, housing prices are higher in the western and southern parts of central Chengdu. The level of greenery is also better, and residents enjoy more green space, and green gentrification is more severe. On the other hand, many areas in the southwestern, eastern and, northern parts of the city are located in neighborhoods with lower housing prices. They have difficulties becoming greener for commuting, recreation, work and, living, which is related to the southern focus of urban construction and the lack of large-scale development in the north. There are also areas in the northern part of the study area with higher levels of greenery and lower house prices, where people enjoy the same benefits of greenery despite not being wealthy.
In terms of population, the edges of the study area have higher levels of greenery and lower population densities, allowing residents to enjoy more greenery. This is related to the low intensity of development and low level of urbanization here, which preserves the original vegetation. In contrast, due to the high population and more construction land in the urban center, there are many cases of high population but less greenery available on a daily basis, especially the lack of greenery within the visible range of buildings.
In general, the study area has relatively well-constructed street green spaces and small parks, and the roads are well-greened. The quantity and quality of medium and large green spaces vary greatly, and some areas lack high vegetation cover green spaces. High-grade residential areas pay attention to greenery, while the quantity and quality of greenery in ordinary residential areas are poor. There is insufficient greenery in high population areas in urban centers. These factors lead to inequitable distribution of green space.
6.3. A framework for analyzing the green fairness of daily urban accessibility
Everyday Accessible Greenery introduces a comprehensive analysis of “everyday” and “accessible” greenery into traditional green space analysis. Everyday greenery focuses on green spaces that interact with daily living conditions, covering most greenery exposure scenarios for ordinary people. Accessible greenery adopts a human-centered perspective, considering the actual radius of greenery services to people and thus more accurately measuring the potential positive effects of greenery on individuals. The analytical framework of this study can be replicated in other areas of research.
For the level of greenness itself, the bottom-up approach more intuitively reflects the actual greenness perceived by people, while the top-down approach can efficiently assess the level of greenness within a given area. Therefore, a combination of both data can be used in the study.
Daily greenery can be discussed concerning different life scenarios. Commuting, recreation, and work are the most dominant life states for the average person, and the resulting visible greenery of streets, accessible greenery of green spaces, and visible greenery of buildings are the most frequent greenery exposures for individuals.
For greenery accessibility, spatial syntax theory has achieved good results and wide acceptance in accessibility assessment. Thus, applying spatial syntax, such as sDNA, can better assess accessibility in terms of both integration and choice to measure “passing” and “arriving” states. Moreover, the GAI proposed in this study can integrate accessibility and greenery levels for further analysis.
Green fairness in rapidly urbanizing cities is threatened in two ways: (1) green gentrification due to economic level imbalances. (2) increased demand for green space due to population growth, while urban development has reduced the quantity and quality of green space. Therefore, green unfairness can be examined concerning house prices and population counts. Bivariate spatial autocorrelation offers a better understanding of the distribution of greenery levels and house prices or population by exploring the clustering patterns of the variables to assess the degree of unfairness across regions.
6.4. Urban daily accessible green fairness characteristics and optimization strategies
The case of the central city of Chengdu can reveal the following characteristics of green fairness in similar cities: (1) The city’s expressways are areas with high numbers and frequencies of commuters, and the current greenery is not yet sufficient to meet the overall fairness of the city. (2) The unfairness of building-visible greenery features higher regional differences. The gap in perceived greenery in buildings is more significant in high and low-income communities, as these areas have fewer public attributes of greenery and are more influenced by community circumstances. (3) The main areas of unfairness are concentrated in higher-income inner-city neighborhoods, as most of these neighborhoods have better access to greenery. Although some low-income neighborhoods struggle to access sufficient green space, the higher level of green space in suburban areas with better preserved natural vegetation and lower housing prices tends to mitigate green space unfairness. (4) Greenery unfairness in big cities concerning population is more severe, as most people live in city centers where the quality and quantity of greenery are often insufficient, leaving a large part of the population unable to enjoy adequate greenery benefits. Based on these observations, the following optimization strategies are proposed: (1) For street greenery, the construction of central green belts and green ribbons on major roads should be strengthened to improve green perception when driving and walking. (2) For green spaces, emphasis should be placed on the quantity and quality of green spaces in low-income communities, which also tend to have larger populations and need more green spaces to meet the needs of more people or improve the accessibility of green spaces and expand their scope of services. (3) For building-visible greenery, the construction of green spaces attached to buildings should be strengthened, especially in older communities, low-income communities, and communities with high building density. At the same time, rooftop greenery and vertical greenery can also be explored.
6.5. Shortcomings and prospects
Firstly, the calculation of NQPD and TPBt simplifies people’s decision-making in choosing paths, while at the same time it does not sufficiently analyse complex road and traffic conditions, as if the street network were static. Secondly, the choice of variables to be analysed, the spatial weighting matrix and the determination of p-value thresholds may be influenced by the subjective views of the researcher. On remote sensing and streetscape data, large urban green spaces mapped through remote sensing may not match what residents actually see on the ground and in buildings, while the GSV API does not provide time stamps for specified locations, which may result in GSV imagery from different seasons having an impact on the results of the analyses. For building-visible greenery, selecting 100 m near the building as the calculation radius is still insufficient. Therefore, a set of indices for building-visible greenery has been developed to explore the visible area of the building better (Wang et al. Citation2019). In the next study, these indices will be used to perform large-scale operations at the urban scale to obtain building-visible greenery results with higher accuracy.
In addition to green spaces, blue spaces (e.g., sky and water bodies) also have positive effects on people, and subsequent studies can introduce a bottom-up measure of sky openness into street maps (Zeng et al. Citation2018) and add a top-down normalized water body index (NDWI) (Gao Citation1996). The calculation of NDWI is based on this study, which integrates the quantity and quality of blue and green spaces to assess the positive effects of urban habitats on people comprehensively.
7. Conclusion
This study employs Spatial Design Network Analysis (sDNA) to delve into spatial accessibility, utilizes Deeplab v3+ to examine street greenery, and applies the Normalized Differential Vegetation Index (NDVI) to evaluate the greenness within the visible range of green areas and buildings, using the fourth ring road of Chengdu city as the exemplar. Additionally, the Green Accessibility Index (GAI) is proposed and computed across three everyday scenarios, including commuting, recreation, and work, to provide a comprehensive measure of accessibility and greenness levels. This facilitates a nuanced exploration of perceived greenness at the human scale. Finally, the distribution of green inequity in the study area is assessed using bivariate local spatial autocorrelation, with recommendations proffered for potential remediation.
Specifically, the accessibility of daily green spaces is found to be suboptimal near primary urban thoroughfares during commuting, while it is superior within most neighborhoods and on the periphery of the study area. The northern and southern sectors of the study area demonstrate greater accessibility of recreational green spaces. For work scenarios, building-visible greenery is more abundant on the edges of the study area, with less prevalence in the center.
In terms of the equity of daily accessible green space, the western and southern parts of the study area fare better but at a higher cost, thereby exacerbating green inequity. Conversely, the eastern and northern sectors, along with some peripheral areas, feature more natural vegetation and lower housing prices, promoting green equity. The center of the study area, being the most densely populated, currently falls short in meeting the needs of many individuals for daily accessible green space, thereby intensifying green inequity.
In conclusion, strategic planning of green spaces in new areas, decongestion of the city center, prioritizing green construction in low-income, high-density, and older neighborhoods, and enhancing the level and accessibility of green spaces are all effective strategies that can mitigate green inequity in daily accessibility. The “Park City” initiative proposed by Chengdu City also serves as an effective policy instrument. The green accessibility assessment framework and equity assessment framework adopted in this study hold potential for application to other cities, thereby enabling future studies and comparisons across different urban contexts to yield more extensive insights.
Acknowledgements
We want to thank the editor and anonymous referees for their valuable comments and guidance.
Disclosure statement
No potential conflict of interest was reported by the authors.
Additional information
Notes on contributors
Jiaxin Zhang
Jiaxin Zhang received his Ph.D. degree in Engineering from the Graduate School of Engineering, Osaka University, Japan. His research focuses on computer-aided architectural and urban design.
Jinyu Hu
Jinyu Hu is studying at Nanjing Forestry University. His research focuses on urban green space exposure.
Xinyu Zhang
Xinyu Zhang is studying at Nanjing Forestry University. Her research focuses on urban green space and landscape design.
Yunqin Li
Yunqin Li received her Ph.D. degree in Engineering from the Graduate School of Engineering, Osaka University, Japan. Her research focuses on urban perception and environmental behavior.
Jingyong Huang
Jingyong Huang is an associate professor at the Architecture and Design College, Nanchang University. His research focuses on urban renewal.
References
- Anguelovski, I. 2016. “From Toxic Sites to Parks as (Green) LULUs? New Challenges of Inequity, Privilege, Gentrification, and Exclusion for Urban Environmental Justice.” Journal of Planning Literature 31 (1): 23–36. https://doi.org/10.1177/0885412215610491.
- Anguelovski, I., J. J. T. Connolly, H. Cole, M. Garcia-Lamarca, M. Triguero-Mas, F. Baró, N. Martin, et al. 2022. “Green Gentrification in European and North American Cities.” Nature Communications 13 (1). Article 1. https://doi.org/10.1038/s41467-022-31572-1.
- Anguelovski, I., J. J. T. Connolly, L. Masip, and H. Pearsall. 2018. “Assessing Green Gentrification in Historically Disenfranchised Neighborhoods: A Longitudinal and Spatial Analysis of Barcelona.” Urban Geography 39 (3): 458–491. https://doi.org/10.1080/02723638.2017.1349987.
- Anselin, L. 1995. “Local Indicators of Spatial Association—LISA.” Geographical Analysis 27 (2): 93–115. https://doi.org/10.1111/j.1538-4632.1995.tb00338.x.
- Anselin, L. 2003. An Introduction to Spatial Autocorrelation Analysis with GeoDa. Urbana, Illinois: Spatial Analysis Laboratory, University of Illinois, Champagne.
- Barbosa, O., J. A. Tratalos, P. R. Armsworth, R. G. Davies, R. A. Fuller, P. Johnson, and K. J. Gaston. 2007. “Who Benefits from Access to Green Space? A Case Study from Sheffield, UK.” Landscape and Urban Planning 83 (2): 187–195. https://doi.org/10.1016/j.landurbplan.2007.04.004.
- Bexell, M., and K. Jönsson. 2017 January. “Responsibility and the United Nations’ Sustainable Development Goals.” In Forum for Development Studies, 13–29. Vol. 44. No. 1. Routledge. https://doi.org/10.1080/08039410.2016.1252424
- Bi, W., X. Jiang, H. Li, Y. Cheng, X. Jia, Y. Mao, and B. Zhao. 2022. “The More Natural the Window, the Healthier the Isolated People—A Pathway Analysis in Xi’an, China, During the COVID-19 Pandemic.” International Journal of Environmental Research and Public Health 19 (16): 10165. Article 16. https://doi.org/10.3390/ijerph191610165.
- Branas, C. C., R. A. Cheney, J. M. MacDonald, V. W. Tam, T. D. Jackson, and T. R. Ten Have. 2011. “A Difference-In-Differences Analysis of Health, Safety, and Greening Vacant Urban Space.” American Journal of Epidemiology 174 (11): 1296–1306. https://doi.org/10.1093/aje/kwr273.
- Chen, A., and J. Gao. 2011. “Urbanization in China and the Coordinated Development Model—The Case of Chengdu.” The Social Science Journal 48 (3): 500–513. https://doi.org/10.1016/j.soscij.2011.05.005.
- Chen, X., Q. Meng, D. Hu, L. Zhang, and J. Yang. 2019. “Evaluating Greenery Around Streets Using Baidu Panoramic Street View Images and the Panoramic Green View Index.” Forests 10 (12): 1109. Article 12. https://doi.org/10.3390/f10121109.
- Chen, L.-C., G. Papandreou, F. Schroff, and H. Adam. 2017. Rethinking Atrous Convolution for Semantic Image Segmentation. arXiv:1706.05587). arXiv. https://doi.org/10.48550/arXiv.1706.05587
- Chen, Y., W. Yue, and D. La Rosa. 2020. “Which Communities Have Better Accessibility to Green Space? An Investigation into Environmental Inequality Using Big Data.” Landscape and Urban Planning 204:103919. https://doi.org/10.1016/j.landurbplan.2020.103919.
- Chen, L.-C., Y. Zhu, G. Papandreou, F. Schroff, and H. Adam 2018. Encoder-Decoder with Atrous Separable Convolution for Semantic Image Segmentation. p. 801–818. https://openaccess.thecvf.com/content_ECCV_2018/html/Liang-Chieh_Chen_Encoder-Decoder_with_Atrous_ECCV_2018_paper.html.
- Coombes, E., A. P. Jones, and M. Hillsdon. 2010. “The Relationship of Physical Activity and Overweight to Objectively Measured Green Space Accessibility and Use.” Social Science & Medicine 70 (6): 816–822. https://doi.org/10.1016/j.socscimed.2009.11.020.
- Cooper, C. 2016. Spatial Design Network Analysis (sDNA) software version 3.4.5.
- Cooper, C., and A. J. Chiaradia. 2015. “sDNA: How and Why We Reinvented Spatial Network Analysis for Health, Economics and Active Modes of Transport”. In Figshare, In edited by N. Malleson, 122–127. https://doi.org/10.6084/m9.figshare.1491375.v3.
- Cordts, M., M. Omran, S. Ramos, T. Rehfeld, M. Enzweiler, R. Benenson, U. Franke, S. Roth, and B. Schiele 2016. The Cityscapes Dataset for Semantic Urban Scene Understanding. 3213–3223. https://openaccess.thecvf.com/content_cvpr_2016/html/Cordts_The_Cityscapes_Dataset_CVPR_2016_paper.html.
- Curran, W., and T. Hamilton. 2012. “Just Green Enough: Contesting Environmental Gentrification in Greenpoint, Brooklyn.” Local Environment 17 (9): 1027–1042. https://doi.org/10.1080/13549839.2012.729569.
- Dai, D. 2011. “Racial/Ethnic and Socioeconomic Disparities in Urban Green Space Accessibility: Where to Intervene?” Landscape and Urban Planning 102 (4): 234–244. https://doi.org/10.1016/j.landurbplan.2011.05.002.
- de la Barrera, F., S. Reyes-Paecke, and E. Banzhaf. 2016. “Indicators for Green Spaces in Contrasting Urban Settings.” Ecological Indicators 62:212–219. https://doi.org/10.1016/j.ecolind.2015.10.027.
- Diao, Y., W. Hu, and B.-J. He. 2021. “Analysis of the Impact of Park Scale on Urban Park Equity Based on 21 Incremental Scenarios in the Urban Core Area of Chongqing, China.” Advanced Sustainable Systems 5 (10): 2100171. https://doi.org/10.1002/adsu.202100171.
- Dzhambov, A. M., and D. D. Dimitrova. 2014. “Urban Green spaces’ Effectiveness as a Psychological Buffer for the Negative Health Impact of Noise Pollution: A Systematic Review.” Noise and Health 16 (70): 157. https://doi.org/10.4103/1463-1741.134916.
- Ekkel, E. D., and S. de Vries. 2017. “Nearby Green Space and Human Health: Evaluating Accessibility Metrics.” Landscape and Urban Planning 157:214–220. https://doi.org/10.1016/j.landurbplan.2016.06.008.
- Fam, D., E. Mosley, A. Lopes, L. Mathieson, J. Morison, and G. Connellan. 2019. “Irrigation of Urban Green Spaces: A Review of the Environmental, Social and Economic Benefits.”
- Fan, P., L. Xu, W. Yue, and J. Chen. 2017. “Accessibility of Public Urban Green Space in an Urban Periphery: The Case of Shanghai.” Landscape and Urban Planning 165:177–192. https://doi.org/10.1016/j.landurbplan.2016.11.007.
- Fung, T., and W.-L. Siu. 2001. “A Study of Green Space and Its Changes in Hong Kong Using NDVI.” Geographical and Environmental Modelling 5 (2): 111–122. https://doi.org/10.1080/13615930120086032.
- Gao, B.-C. 1996. “NDWI—A Normalized Difference Water Index for Remote Sensing of Vegetation Liquid Water from Space.” Remote Sensing of Environment 58 (3): 257–266. https://doi.org/10.1016/S0034-4257(96)00067-3.
- Georgi, J. N., and D. Dimitriou. 2010. “The Contribution of Urban Green Spaces to the Improvement of Environment in Cities: Case Study of Chania, Greece.” Building and Environment 45 (6): 1401–1414. https://doi.org/10.1016/j.buildenv.2009.12.003.
- Gou, A., C. Zhang, and J. Wang. 2022. “Study on the Identification and Dynamics of Green Vision Rate in Jing’an District, Shanghai Based on Deeplab V3 + model.” Earth Science Informatics 15 (1): 163–181. https://doi.org/10.1007/s12145-021-00691-6.
- Haaland, C., and C. K. van den Bosch. 2015. “Challenges and Strategies for Urban Green-Space Planning in Cities Undergoing Densification: A Review.” Urban Forestry & Urban Greening 14 (4): 760–771. https://doi.org/10.1016/j.ufug.2015.07.009.
- Halecki, W., T. Stachura, W. Fudała, A. Stec, and S. Kuboń. 2023. “Assessment and Planning of Green Spaces in Urban Parks: A Review.” Sustainable Cities and Society 88:104280. https://doi.org/10.1016/j.scs.2022.104280.
- Hatton MacDonald, D., N. D. Crossman, P. Mahmoudi, L. O. Taylor, D. M. Summers, and P. C. Boxall. 2010. “The Value of Public and Private Green Spaces Under Water Restrictions.” Landscape and Urban Planning 95 (4): 192–200. https://doi.org/10.1016/j.landurbplan.2010.01.003.
- Hewitt, C. N., K. Ashworth, and A. R. MacKenzie. 2020. “Using Green Infrastructure to Improve Urban Air Quality (GI4AQ).” Ambio 49 (1): 62–73. https://doi.org/10.1007/s13280-019-01164-3.
- Hewitt, K. M., C. P. Gerba, S. L. Maxwell, S. T. Kelley, and J. Ravel. 2012. “Office Space Bacterial Abundance and Diversity in Three Metropolitan Areas.” PLOS ONE 7 (5): e37849. https://doi.org/10.1371/journal.pone.0037849.
- Hillier, B., and S. Iida. 2005. “Network and Psychological Effects in Urban Movement.” In Spatial Information Theory, edited by A. G. Cohn and D. M. Mark, 475–490. Springer. https://doi.org/10.1007/11556114_30.
- Jennings, V., C. J. Gaither, and R. S. Gragg. 2012 February 17. “Promoting Environmental Justice Through Urban Green Space Access: A Synopsis (140 Huguenot Street, 3rd Floor New Rochelle, NY 10801 USA).” [Review-article]. https://Home.Liebertpub.Com/Env; Mary Ann Liebert, Inc. 140 Huguenot Street, 3rd Floor New Rochelle, NY 10801 USA. https://doi.org/10.1089/env.2011.0007.
- Ke, X., D. Huang, T. Zhou, and H. Men. 2023. “Contribution of Non-Park Green Space to the Equity of Urban Green Space Accessibility.” Ecological Indicators 146:109855. https://doi.org/10.1016/j.ecolind.2022.109855.
- Klein, T., and William, R. L. A. 2021. “A vast increase in heat exposure in the 21st century is driven by global warming and urban population growth.” Sustainable Cities and Society 73:103098. https://doi.org/10.1016/j.scs.2021.103098.
- Lee, A. C. K., and R. Maheswaran. 2011. “The Health Benefits of Urban Green Spaces: A Review of the Evidence.” Journal of Public Health 33 (2): 212–222. https://doi.org/10.1093/pubmed/fdq068.
- Li, X., Y. Huang, and X. Ma. 2021. “Evaluation of the Accessible Urban Public Green Space at the Community-Scale with the Consideration of Temporal Accessibility and Quality.” Ecological Indicators 131:108231. https://doi.org/10.1016/j.ecolind.2021.108231.
- Liotta, C., Y. Kervinio, H. Levrel, and L. Tardieu. 2020. “Planning for Environmental Justice—Reducing Well-Being Inequalities Through Urban Greening.” Environmental Science & Policy 112:47–60. https://doi.org/10.1016/j.envsci.2020.03.017.
- Li, W., J.-D. M. Saphores, and T. W. Gillespie. 2015. “A Comparison of the Economic Benefits of Urban Green Spaces Estimated with NDVI and with High-Resolution Land Cover Data.” Landscape and Urban Planning 133:105–117. https://doi.org/10.1016/j.landurbplan.2014.09.013.
- Liu, J., J. Xiao, H. Cao, and J. Deng. 2019. “The Status and Challenges of High Precision Map for Automated Driving.” In China Satellite Navigation Conference (CSNC) 2019 Proceedings, edited by J. Sun, C. Yang, and Y. Yang, 266–276. Springer. https://doi.org/10.1007/978-981-13-7751-8_27.
- Liu, W., H. Xu, J. Wu, W. Li, H. Hu, and Y. Benetreau. 2022. “Measuring Spatial Accessibility to Refuge Green Space After Earthquakes: A Case Study of Nanjing, China.” PLOS ONE 17 (6): e0270035. https://doi.org/10.1371/journal.pone.0270035.
- Li, Y., N. Yabuki, and T. Fukuda. 2022. “Exploring the Association Between Street Built Environment and Street Vitality Using Deep Learning Methods.” Sustainable Cities and Society 79:103656. https://doi.org/10.1016/j.scs.2021.103656.
- Lloyd, C. T., A. Sorichetta, and A. J. Tatem. 2017. “High Resolution Global Gridded Data for Use in Population Studies”. Scientific Data 4(1). Article 1. https://doi.org/10.1038/sdata.2017.1.
- Lopes, M. N., and A. S. Camanho. 2013. “Public Green Space Use and Consequences on Urban Vitality: An Assessment of European Cities.” Social Indicators Research 113 (3): 751–767. https://doi.org/10.1007/s11205-012-0106-9.
- Luo, W., and F. Wang. 2003. “Measures of Spatial Accessibility to Health Care in a GIS Environment: Synthesis and a Case Study in the Chicago Region.” Environment and Planning B: Planning and Design 30 (6): 865–884. https://doi.org/10.1068/b29120.
- Ma, F. 2020. “Spatial Equity Analysis of Urban Green Space Based on Spatial Design Network Analysis (sDNA): A Case Study of Central Jinan, China.” Sustainable Cities and Society 60:102256. https://doi.org/10.1016/j.scs.2020.102256.
- Maas, J. 2006. “Green Space, Urbanity, and Health: How Strong is the Relation?” Journal of Epidemiology & Community Health 60 (7): 587–592. https://doi.org/10.1136/jech.2005.043125.
- Mansfield, C., S. K. Pattanayak, W. McDow, R. McDonald, and P. Halpin. 2005. “Shades of Green: Measuring the Value of Urban Forests in the Housing Market.” Journal of Forest Economics 11 (3): 177–199. https://doi.org/10.1016/j.jfe.2005.08.002.
- Matthew McConnachie, M., and C. M. Shackleton. 2010. “Public Green Space Inequality in Small Towns in South Africa.” Habitat International 34 (2): 244–248. https://doi.org/10.1016/j.habitatint.2009.09.009.
- Neuvonen, M., T. Sievänen, S. Tönnes, and T. Koskela. 2007. “Access to Green Areas and the Frequency of Visits – a Case Study in Helsinki.” Urban Forestry & Urban Greening 6 (4): 235–247. https://doi.org/10.1016/j.ufug.2007.05.003.
- Pettorelli, N., J. O. Vik, A. Mysterud, J.-M. Gaillard, C. J. Tucker, and N. C. Stenseth. 2005. “Using the Satellite-Derived NDVI to Assess Ecological Responses to Environmental Change.” Trends in Ecology & Evolution 20 (9): 503–510. https://doi.org/10.1016/j.tree.2005.05.011.
- Qin, B. 2015. “City Profile: Chengdu.” Cities 43:18–27. https://doi.org/10.1016/j.cities.2014.11.006.
- Qin, B., and J. Yang. 2020. “Access of Low-Income Residents to Urban Services for Inclusive Development: The Case of Chengdu, China.” In Governance for Urban Services: Access, Participation, Accountability, and Transparency, edited by S. Cheema, 209–236. Springer. https://doi.org/10.1007/978-981-15-2973-3_9.
- Qu, W., S. Zhao, and Y. Sun. 2014. “Spatiotemporal Patterns of Urbanization Over the Past Three Decades: A Comparison Between Two Large Cities in Southwest China.” Urban Ecosystems 17 (3): 723–739. https://doi.org/10.1007/s11252-014-0354-3.
- Rigolon, A., and J. Németh. 2020. “Green Gentrification or ‘Just Green enough’: Do Park Location, Size and Function Affect Whether a Place Gentrifies or Not?” Urban Studies 57 (2): 402–420. https://doi.org/10.1177/0042098019849380.
- Roberts, H. V. 2017. “Using Twitter Data in Urban Green Space Research: A Case Study and Critical Evaluation.” Applied Geography 81:13–20. https://doi.org/10.1016/j.apgeog.2017.02.008.
- Rutt, R. L., and N. M. Gulsrud. 2016. “Green Justice in the City: A New Agenda for Urban Green Space Research in Europe.” Urban Forestry & Urban Greening 19:123–127. https://doi.org/10.1016/j.ufug.2016.07.004.
- Schinasi, L. H., H. V. S. Cole, J. A. Hirsch, G. B. Hamra, P. Gullon, F. Bayer, S. J. Melly, K. M. Neckerman, J. E. Clougherty, and G. S. Lovasi. 2021. “Associations Between Greenspace and Gentrification-Related Sociodemographic and Housing Cost Changes in Major Metropolitan Areas Across the United States.” International Journal of Environmental Research and Public Health 18 (6): 3315. Article 6. https://doi.org/10.3390/ijerph18063315.
- Shahtahmassebi, A. R., C. Li, Y. Fan, Y. Wu, Y. Lin, M. Gan, K. Wang, A. Malik, and G. A. Blackburn. 2021. “Remote Sensing of Urban Green Spaces: A Review.” Urban Forestry & Urban Greening 57:126946. https://doi.org/10.1016/j.ufug.2020.126946.
- Shen, Y., F. Sun, and Y. Che. 2017. “Public Green Spaces and Human Wellbeing: Mapping the Spatial Inequity and Mismatching Status of Public Green Space in the Central City of Shanghai.” Urban Forestry & Urban Greening 27:59–68. https://doi.org/10.1016/j.ufug.2017.06.018.
- Shen, Z.-J., B.-H. Zhang, R.-H. Xin, and J.-Y. Liu. 2022. “Examining Supply and Demand of Cooling Effect of Blue and Green Spaces in Mitigating Urban Heat Island Effects: A Case Study of the Fujian Delta Urban Agglomeration (FDUA), China.” Ecological Indicators 142:109187. https://doi.org/10.1016/j.ecolind.2022.109187.
- Shojanoori, R., and H. Shafri. 2016. “Review on the Use of Remote Sensing for Urban Forest Monitoring.” Arboriculture & Urban Forestry 42 (6). https://doi.org/10.48044/jauf.2016.034.
- Song, Y., B. Chen, H. C. Ho, M.-P. Kwan, D. Liu, F. Wang, J. Wang, et al. 2021. “Observed Inequality in Urban Greenspace Exposure in China.” Environment International 156:106778. https://doi.org/10.1016/j.envint.2021.106778.
- Song, Y., B. Chen, and M.-P. Kwan. 2020. “How Does Urban Expansion Impact People’s Exposure to Green Environments? A Comparative Study of 290 Chinese Cities.” Journal of Cleaner Production 246:119018. https://doi.org/10.1016/j.jclepro.2019.119018.
- Song, Y., B. Huang, J. Cai, and B. Chen. 2018. “Dynamic Assessments of Population Exposure to Urban Greenspace Using Multi-Source Big Data.” Science of the Total Environment 634:1315–1325. https://doi.org/10.1016/j.scitotenv.2018.04.061.
- Sturm, R., and D. Cohen. 2014. “Proximity to Urban Parks and Mental Health.” The Journal of Mental Health Policy and Economics 17 (1): 19. https://doi.org/10.1186/1476-072X-12-26.
- Sun, L., J. Chen, Q. Li, and D. Huang. 2020. “Dramatic Uneven Urbanization of Large Cities Throughout the World in Recent Decades”. Nature Communications 11(1). Article 1. https://doi.org/10.1038/s41467-020-19158-1.
- Travisi, C. M., R. Camagni, and P. Nijkamp. 2010. “Impacts of Urban Sprawl and Commuting: A Modelling Study for Italy.” Journal of Transport Geography 18 (3): 382–392. https://doi.org/10.1016/j.jtrangeo.2009.08.008.
- van Zoest, J., and M. Hopman. 2014. “Taking the Economic Benefits of Green Space into Account: The Story of the Dutch TEEB for Cities Project.” Urban Climate 7:107–114. https://doi.org/10.1016/j.uclim.2014.01.005.
- Wang, X.-J. 2009. “Analysis of Problems in Urban Green Space System Planning in China.” Journal of Forestry Research 20 (1): 79–82. https://doi.org/10.1007/s11676-009-0014-2.
- Wang, W., Z. Lin, L. Zhang, T. Yu, P. Ciren, and Y. Zhu. 2019. “Building Visual Green Index: A Measure of Visual Green Spaces for Urban Building.” Urban Forestry & Urban Greening 40:335–343. https://doi.org/10.1016/j.ufug.2018.04.004.
- Wan, C., and G. Q. Shen. 2015. “Salient Attributes of Urban Green Spaces in High Density Cities: The Case of Hong Kong.” Habitat International 49:92–99. https://doi.org/10.1016/j.habitatint.2015.05.016.
- Wei, F. 2017. “Greener Urbanization? Changing Accessibility to Parks in China.” Landscape and Urban Planning 157:542–552. https://doi.org/10.1016/j.landurbplan.2016.09.004.
- Wolch, J. R., J. Byrne, and J. P. Newell. 2014. “Urban Green Space, Public Health, and Environmental Justice: The Challenge of Making Cities ‘Just Green Enough.” Landscape and Urban Planning 125:234–244. https://doi.org/10.1016/j.landurbplan.2014.01.017.
- Wu, L., and S. K. Kim. 2021. “Exploring the Equality of Accessing Urban Green Spaces: A Comparative Study of 341 Chinese Cities.” Ecological Indicators 121:107080. https://doi.org/10.1016/j.ecolind.2020.107080.
- Xia, Y., N. Yabuki, and T. Fukuda. 2021. “Development of a System for Assessing the Quality of Urban Street-Level Greenery Using Street View Images and Deep Learning.” Urban Forestry & Urban Greening 59:126995. https://doi.org/10.1016/j.ufug.2021.126995.
- Xing, L., Y. Liu, X. Liu, X. Wei, and Y. Mao. 2018. “Spatio-Temporal Disparity Between Demand and Supply of Park Green Space Service in Urban Area of Wuhan from 2000 to 2014.” Habitat International 71:49–59. https://doi.org/10.1016/j.habitatint.2017.11.002.
- Yang, J., L. Zhao, J. Mcbride, and P. Gong. 2009. “Can You See Green? Assessing the Visibility of Urban Forests in Cities.” Landscape and Urban Planning 91 (2): 97–104. https://doi.org/10.1016/j.landurbplan.2008.12.004.
- Ye, Y., D. Richards, Y. Lu, X. Song, Y. Zhuang, W. Zeng, and T. Zhong. 2019. “Measuring Daily Accessed Street Greenery: A Human-Scale Approach for Informing Better Urban Planning Practices.” Landscape and Urban Planning 191:103434. https://doi.org/10.1016/j.landurbplan.2018.08.028.
- You, H. 2016. “Characterizing the Inequalities in Urban Public Green Space Provision in Shenzhen, China.” Habitat International 56:176–180. https://doi.org/10.1016/j.habitatint.2016.05.006.
- Yu, X., Y. Her, W. Huo, G. Chen, and W. Qi. 2022. “Spatio-Temporal Monitoring of Urban Street-Side Vegetation Greenery Using Baidu Street View Images.” Urban Forestry & Urban Greening 73:127617. https://doi.org/10.1016/j.ufug.2022.127617.
- Yu, Z., W. Ma, S. Hu, X. Yao, G. Yang, Z. Yu, and B. Jiang. 2023. “A Simple but Actionable Metric for Assessing Inequity in Resident Greenspace Exposure.” Ecological Indicators 153:110423. https://doi.org/10.1016/j.ecolind.2023.110423.
- Zeng, L., J. Lu, W. Li, and Y. Li. 2018. “A Fast Approach for Large-Scale Sky View Factor Estimation Using Street View Images.” Building and Environment 135:74–84. https://doi.org/10.1016/j.buildenv.2018.03.009.
- Zhang, J., Y. Cheng, H. Li, Y. Wan, and B. Zhao. 2021. “Deciphering the Changes in Residential Exposure to Green Spaces: The Case of a Rapidly Urbanizing Metropolitan Region.” Building and Environment 188:107508. https://doi.org/10.1016/j.buildenv.2020.107508.
- Zhang, J., Y. Cheng, and B. Zhao. 2021. “How to Accurately Identify the Underserved Areas of Peri-Urban Parks? An Integrated Accessibility Indicator.” Ecological Indicators 122:107263. https://doi.org/10.1016/j.ecolind.2020.107263.
- Zhang, G., and B.-J. He. 2021. “Towards Green Roof Implementation: Drivers, Motivations, Barriers and Recommendations.” Urban Forestry & Urban Greening 58:126992. https://doi.org/10.1016/j.ufug.2021.126992.
- Zhang, Y., T. van Dijk, J. Tang, and A. Berg. 2015. “Green Space Attachment and Health: A Comparative Study in Two Urban Neighborhoods.” International Journal of Environmental Research and Public Health 12 (11): 14342–14363. https://doi.org/10.3390/ijerph121114342.
- Zhang, J., W. Yue, P. Fan, and J. Gao. 2021. “Measuring the Accessibility of Public Green Spaces in Urban Areas Using Web Map Services.” Applied Geography 126:102381. https://doi.org/10.1016/j.apgeog.2020.102381.
- Zhang, Y., T. Zhang, Y. Zeng, C. Yu, and S. Zheng. 2021. “The Rising and Heterogeneous Demand for Urban Green Space by Chinese Urban Residents: Evidence from Beijing.” Journal of Cleaner Production 313:127781. https://doi.org/10.1016/j.jclepro.2021.127781.
- Zhong, J., Z. Li, Z. Sun, Y. Tian, and F. Yang. 2020. “The Spatial Equilibrium Analysis of Urban Green Space and Human Activity in Chengdu, China.” Journal of Cleaner Production 259:120754. https://doi.org/10.1016/j.jclepro.2020.120754.
- Zhou, X., and M. Parves Rana. 2012. “Social Benefits of Urban Green Space: A Conceptual Framework of Valuation and Accessibility Measurements.” Management of Environmental Quality: An International Journal 23 (2): 173–189. https://doi.org/10.1108/14777831211204921.
- Zhu, Z., J. Li, and Z. Chen. 2023. “Green Space Equity: Spatial Distribution of Urban Green Spaces and Correlation with Urbanization in Xiamen, China.” Environment Development and Sustainability 25 (1): 423–443. https://doi.org/10.1007/s10668-021-02061-0.