
ABSTRACT
This exploratory study presents, for the first time, an analysis of how residential satisfaction (RS) can be related to earthen building materials. The study utilizes an ongoing world-renowned project in Auroville, India, which aims to promote the environmentally friendly Compressed Stabilized Earth Block (CSEB) as a substitute for non-ecological fired-brick. The research employs the semantic differential (SD) method as a means to examine satisfaction. It seeks to explain the limitations of CSEB usage compared to fired-brick and compares satisfaction levels among different groups of residents. For the first time, it has been proven through our findings that CSEB has a significant positive impact on RS, while fired-brick demonstrates no influence on RS. The restricted use of CSEB cannot solely be attributed to its level of house-building-material satisfaction (HBMS), as CSEB surpasses fired-bricks in HBMS rating. Despite this, houses constructed with CSEB offer equivalent levels of RS to those constructed with fired-bricks, sparking a resourceful discussion on various interpretations related to RS theories. One perspective posits that CSEB technology may not be widely adopted, while others emphasize the importance of supporting its development despite the anticipated positive behavior toward it.
1. Introduction
Satisfaction is the feeling of contentment resulting from the evaluation of new stimuli and influenced by prior experiences (Tse and Wilton’s, Citation1988; Yang & Zhu, Citation2006). It involves comparing obtained outcomes with expectations or personal values (Parker & Mathews, Citation2001). Satisfaction can be viewed as both an outcome and a process (Aigbavboa and Thwala Citation2018). While the term “satisfaction” is relevant in various fields, it has particularly impacted the marketing domain (Parker & Mathews, Citation2001; Aigbavboa and Thwala Citation2018). In the context of housing, satisfaction, commonly known as residential satisfaction (RS), refers to the subjective assessment of housing quality, encompassing various dimensions (Pellenbarg & Van Steen, Citation2005; Ge and Hokao Citation2006). Enhancing RS can involve addressing bothersome vibrations, such as through the incorporation of structural vibration control devices (Wang et al., Citation2022; Wang et al., Citation2023; Zhang et al., Citation2023).
Hellard (Citation1993) emphasized the importance of customer satisfaction in construction projects for achieving profitability. James and Carswell (Citation2008) found that RS directly affects the well-being of inhabitants and dissatisfaction often serves as a catalyst for residential mobility. Schachter (Citation2001) reported that over half (52%) of residential relocations in the United States are motivated by a desire for more satisfactory housing. Multifamily property managers in the housing sector frequently rely on RS as a key measure of success (Varady & Carrozza, Citation2000). Harmon and McKenna-Harmon (Citation1994) demonstrated in their article “The hidden costs of resident dissatisfaction” that, in the for-profit industry, the indirect expenses resulting from dissatisfied residents are nearly as significant as the lost income from vacancies. Furthermore, current resident satisfaction plays a role in attracting new residents (James and Carswell Citation2008). Glaeser et al. (Citation2002) established that residential dissatisfaction has broader societal implications, negatively impacting social capital investment and accumulation. Consequently, RS is critical for the formulation of housing policies at the national level. Thus, investigating RS provides a valid approach for evaluating the overall performance of the housing system (Aigbavboa and Thwala Citation2018). RS surveys aim to comprehend residents’ preferences, guiding technological decision-making (Nish & Chatelain, Citation1981).
Compressed Stabilized Earth Blocks (CSEB), also known as CEB, are a type of earthen building system used for structural and non-structural wall systems. Alongside other earth-based building technologies such as adobe, rammed earth, cob, and cast earth, these techniques offer lower environmental impact and require less energy compared to conventional alternatives (Standard, Citation2016). The demand for eco-friendly building materials has been reinforced by the widespread adoption of Sustainable Development Goals (SDGs) by numerous countries (UN, Citation2023) and their commitment to national programs aimed at reducing carbon emissions, energy consumption, and waste by 2030 (Ministère de la Transition Écologique, Citation2018). The SDGs serve as a call for organizations and individuals to engage in environmentally responsible practices (Oskamp, Citation2000) and address the adverse effects of climate change (UN, Citation2022). Given that buildings and construction materials consume significant energy and resources (Berge Citation2009; OCDE, Citation2003), the use of CSEB contributes to environmental sustainability, aligning with the SDGs and mitigating the building sector’s negative impact on the environment (Kollmuss & Agyeman, Citation2002). The adoption of SDGs is the primary driver behind the demand for CSEB. Comparative studies conducted by Schroeder (Citation2016) and Fernandes et al. (Citation2019) indicate that promoting CSEB as a sustainable building alternative is advantageous due to its lower primary energy intensity (Reddy et al., Citation2014), reduced energy consumption (Reddy & Jagadish, Citation2003; Shadravan et al. Citation2017; Schroeder, Citation2016), recyclability (Fernandes et al. Citation2019, Schroeder, Citation2016), and significant decrease in carbon emissions (Maini & Thautam, Citation2013; Riza et al., Citation2010, Schroeder, Citation2016). Consequently, CSEB aligns with the definition of ecological building materials provided by Luo et al. (Citation2014).
This study capitalizes on a long-term project initiated in 1989, examining the significant efforts of the Auroville Earth Institute (AVEI) in India to incorporate clean technologies into construction projects. The AVEI has actively employed earth-based building methods, particularly emphasizing CSEB housing, for over 25 years to introduce innovative construction technologies to the public. The primary objective of this initiative is to encourage the widespread adoption of clean technologies in residential construction (Kebaili, Citation2017, 122). The novelty of this study lies in its focus on investigating the correlation between RS and HBMS.
2. RS and the building technology
“Satisfaction” has been extensively studied since the 1940s and finds applications in various fields such as housing, marketing, landscape architecture, and medical disciplines (Potter et al., Citation2001). The number of studies on satisfaction has notably increased over time, with over a million studies conducted to date (Aigbavboa and Thwala Citation2018). Scholars primarily investigating satisfaction come from the field of social psychology. The concept of satisfaction has been explored through different theoretical approaches, particularly focusing on “positive disconfirmation” or satisfaction and “negative disconfirmation” or dissatisfaction (Aigbavboa and Thwala Citation2018). In this study, satisfaction is referred to as levels of satisfaction. The theoretical framework originates from social and applied psychology and can be divided into two subgroups: (a) theories linking satisfaction to post-use or post-occupancy evaluation and (b) theories linking satisfaction to worth. The first subgroup includes the Assimilation Theory, Contrast Theory, Assimilation-Contrast Theory, Negativity Theory, Expectancy Disconfirmation Paradigm, and Gap Analysis Theory, which conceptualize satisfaction as an evaluation process between expectations and perceived performance. The second subgroup consists of the Value-Percept Disparity Theory and Equity Theory, which view satisfaction as an evaluative process involving the comparison of an object to its perceived value or assessing input/output balance relative to others, respectively (Aigbavboa and Thwala Citation2018; Anderson Citation1973; Bitner Citation1987; Jaafar and Hasan Citation2005; Oliver, Citation1989; Parker and Mathews, Citation2001; Peyton et al., Citation2003).
Most empirical studies on RS have focused on understanding how housing, neighborhood, and household characteristics influence residents’ levels of satisfaction (Bonnes, Bonaiuto, and Ercolani Citation1991; Lu, Citation1999). Aigbavboa and Thwala (Citation2018) note that all RS studies aim to measure the discrepancy between current satisfaction levels and residents’ expectations. The overarching objective is to gain a comprehensive understanding of residents’ well-being, bridge the satisfaction gap, and identify the determinants and evaluation process involved (Aigbavboa and Thwala Citation2018).
RS is a subjective measure influenced by individual perception, and the factors contributing to satisfaction can vary. Determinants of satisfaction include employment status, personal history, age, financial status, and gender differences, which can influence factors such as safety (Amerigo Citation1990; Amérigo and Aragones Citation1997; Potter et al., Citation2001). RS is influenced by various social, behavioral, cultural, and environmental factors, in addition to housing engineering components (Onibokun, Citation1974; Aigbavboa and Thwala Citation2018). Key contributors to RS are housing characteristics, neighborhood characteristics, and household characteristics (Amerigo Citation1990; Sirgy & Cornwell, Citation2002; Phillips et al., Citation2005; Paris and Kangari, Citation2005; He Citation2009). Social factors, economic features of the neighborhood, and physical features like infrastructure, lighting, noise levels, and green areas also impact RS (Weidemann et al. Citation1982; Bruin and Cook Citation1997; Dahmann Citation1983; Bonnes, Bonaiuto, and Ercolani Citation1991; Gomez-Jacinto and Hombrados-Mendieta Citation2002; Turner, Citation2005). Other factors associated with RS include personal characteristics of occupants, marital status, family size, socio-economic status, education, employment, physical features of the house, satisfaction with house condition and management services, social engagement, prior living conditions, and future plans to move (Varady & Carrozza, Citation2000; Theodori, Citation2001; Varady et al., Citation2001). The components of RS are not universally agreed upon. A conceptual framework by Aigbavboa and Thwala (Citation2018) proposes six latent factors: dwelling unit features, neighborhood features, building quality features, government-provided services, beneficiary participation, and housing occupants’ needs and expectations. Building quality features encompass various variables related to different building parts, impacting RS (Aigbavboa and Thwala Citation2018; Salleh et al., Citation2011; Kain & Quigley, Citation1970; Elsinga and Hoekstra Citation2005; Ukoha & Beamish, Citation1997; Onibokun, Citation1974; McCray & Day, Citation1977).
Two key observations can be made regarding research on RS. Firstly, there is a lack of comprehensive studies that encompass all relevant factors influencing RS. Secondly, a notable omission in the variables examined is the consideration of construction materials. This observation is supported by the findings of James and Carswell (Citation2008), who identified no mention of building technology in their extensive analysis of tenants’ satisfaction across 464,280 feedback submissions spanning seven years. This research presents an opportunity to shed light on a previously overlooked aspect in the study of RS. The current study aims to investigate the psychological barriers that impede the adoption of CSEB technology.
3. An investigation of RS with CSEB housing in Auroville: a survey
3.1. Case study
India is actively promoting eco-friendly construction practices, including earth-based building techniques (EBT) and CSEB, to mitigate the environmental impact of the construction industry (Manna & Banerjee, Citation2019). The Bureau of Indian Standards (BIS) has developed multiple standards for CSEB and EBT structures, with recent additions such as IS 17,165:2020 (IS 2110 Citation1981; Standard, Citation1993, Citation2013; Standards, Citationn.d.). The National Building Code of India includes specific sections on CSEB (BIS Citation2016). To encourage the use of CSEB, the BIS has established a technical committee, CED 30, dedicated to CSEB and actively promotes these construction methods. AVEI is located in Auroville, Pondicherry, a city known for its CSEB buildings (Ali and Natarajan Citation2022) such as the Visitor center (cf. ) and Vikas residential community (cf. ) (AVEI Citationn.d.). AVEI is a key organization involved in promoting EBTs since 1989 and is a member of UNESCO Chair Earthen Architecture. AVEI conducts various activities to raise awareness and provide training on the restoration of ancient earthen structures and the design and development of CSEB buildings (AVEI, Citationn.d.). Auroville, with its multinational and multicultural population, of about 7200 inhabitants, actively participates in policies promoting sustainable technologies in housing (Kebaili and Kehila, Citation2017).
Figure 1. Visitors centre. This project received the international award “Hassan Fathy, architecture for the poor” in 1992 (source AVEI).
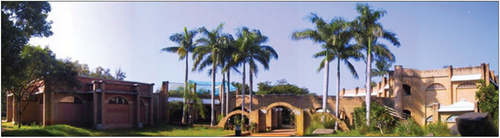
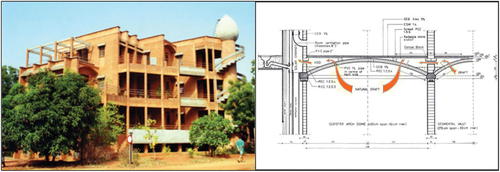
Figure 2. The modern aesthetic of the vikas residential community comprising 23 apartments, along with the depiction of the intricate details of the passive cooling system. This project has been selected as a finalist for the world habitat award 2000. Broadly speaking, within Auroville, the architectural design of apartments prioritizes sustainability, eco-friendliness, and energy efficiency, emphasizing the utilization of natural materials and passive cooling systems. CSEB houses are typically furnished with contemporary conveniences, including solar water heaters, rainwater harvesting systems, and composting toilets. (source AVEI).
Auroville exclusively utilizes locally available raw materials in the production of CSEBs. For good CSEBs, the soil should possess the right combination of clay, silt, sand, and gravel while being free from organic matter, salts, and other contaminants. It is recommended to conduct soil tests to determine its chemical and physical properties, including particle size distribution, plasticity index, and pH level. CSEBs are made by compacting a soil-stabilizer mixture, typically containing around 5% cement or 6% lime, into blocks that are cured in the shade. The addition of stabilizers ensures the strength and durability of the blocks (AVEI, Citationn.d.).
When comparing CSEBs to structures made of reinforced concrete or fired-bricks in the Indian building industry, it has been observed that CSEBs consume significantly less energy. Specifically, CSEBs consume 62% less energy than reinforced concrete structures and 45% less energy than fired-brick structures, according to Reddy and Jagadish’s study in 2003. Additionally, CSEBs have excellent conductivity coefficients (λ) ranging from 0.22 W/m°C to 0.3 W/m°C, compared to fired-bricks, which have conductivity coefficients ranging from 0.37 W/m°C to 0.44 W/m°C (Riza et al., Citation2010). This property of CSEBs can help reduce energy consumption for heating and cooling in buildings.
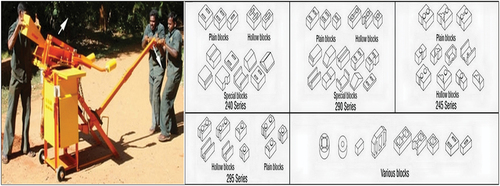
CSEBs are produced using a range of specialized equipment. The Auram equipment used in Auroville includes block presses, mixers, crushers, and other machines for soil preparation, block production, and building construction. The Auram equipment is designed to be low-cost, easy to use, and environmentally friendly, using manual or electric power and requiring minimal maintenance. AVEI also provides training programs on the use of Auram equipment and CSEB production techniques, as well as technical assistance and support for building projects (cf. ) (AVEI, Citationn.d.).
Figure 3. The Auram 3000 press and the many shapes of CSEB. The auram 3000 press is utilized for block production. It is a hydraulic block press capable of manufacturing up to 3000 CSEBs per day. The auram 3000 press is operated manually. With its wide range of molds, almost 70 different shapes of CSEBs can be produced, facilitating the accommodation of various architectural designs for buildings (source: AVEI).
Fired-brick is the traditional building material used around Auroville, but the process of firing the bricks in country kilns is not very efficient. It requires a lot of wood, which leads to pollution and poor quality building materials. Villagers around Auroville burn about 100 tons of wood for 250,000 fired-bricks. However, good quality fired-bricks are also available from factories, and are known as wire cut bricks (AVEI, Citationn.d.). The use of fired-brick results in more than twice the embodied energy and at least eight times the amount of carbon emissions when compared to CSEB. Specifically, fired-brick has an embodied energy of 10.01 MJ/Unit and carbon emissions of 642.87 KgCO2/m3 while CSEB has an embodied energy of 4.6 MJ/Unit and carbon emissions of 79.84 KgCO2/m3 (Maini & Thautam, Citation2013).
CSEB housing exhibits a diverse range of architectural styles in Auroville, including collective apartments and individual houses, and can be found throughout the city. Until fairly recently, people in the area constructed their own houses without much involvement from architects. However, since the 1990s, there has been a shift towards professional design, with architects taking a more prominent role in designing houses and contractors being responsible for their construction (AVEI, Citationn.d.).
As shown in CSEB housing constitutes only 10.1% of the housing stock in Auroville as of the time of this investigation. This is in stark contrast to the prevalence of fired-brick housing, which comprises 70.2% of the total. This finding is consistent with Kulshreshtha et al. (Citation2020) research, which highlights the prevailing use of fired-brick building technology in India. The substantial disparity between the two is statistically significant (χ2 (2) = 200.22, p < .001) and indicates the limited use of CSEB technology in the city (Kebaili & Kehila, Citation2017). The study’s focus is notably aimed at elucidating the rationale for continuing efforts to promote CSEB technology, particularly in light of a long-standing and dedicated commitment. Thus, this survey research aims to comprehend the predilections of residents toward CSEB technology to facilitate informed technological decision-making (Nish & Chatelain, Citation1981). This is why an investigation of both RS and HBMS is sought in the city. The investigation was carried out between June and August of 2014, utilizing a team of three trained investigators who administered and collected survey forms. The investigators conducted the survey by traversing public streets and neighborhoods, approaching individuals and passers-by to solicit voluntary participation after providing a clear explanation of the study’s aims. The survey garnered a total of 347 participants. summarizes participants’ house-building materials. This survey allowed for an accuracy measurement of 5.4%, a highly acceptable percentage given that the uncertainty rate was 0.31, further reinforcing the credibility and confidence of the results (Ardilly Citation2006, 57–78). Under these favorable research conditions, the study was able to proceed with a high degree of assistance.
Table 1. Participants’ house-building materials summary.
3.2. Research method
National customer satisfaction indices, such as the American Customer Satisfaction Index (ACSI), standardize satisfaction measurement across various fields but struggle to effectively assess the construction industry. The ACSI’s shortcomings in construction have led to a search for alternative evaluation methods (Hackl and Westlund Citation2000, Aigbavboa and Thwala Citation2018). We were inspired by the social psychology methods that study evaluative tendencies of objects with a certain degree of favor or disfavor of people (Eagly and Chaiken Citation1998). These evaluations are based on the experiences individuals had (Allport Citation1935). A variety of common approaches to studying evaluative tendencies were available, including description, measurement, content analysis, opinion polling, and face-to-face interviews (Oskamp & Schultz, Citation2005). The current study utilizes a methodology specifically drawing on the communication theory of Osgood et al. (Citation1957), which has previously been employed in marketing and opinion surveys to predict campaign outcomes and has proven to be effective. This study seeks to extend the use of this theory to the domains of housing and construction for the first time. The study views satisfaction as a product of evaluation, where the evaluated objects belong to the same semantic space and are therefore comparable. To facilitate these evaluations, the study employs the “semantic differential” (SD) measurement tool (Kebaili et al., Citation2023). This theory enables the measurement and comparison of satisfaction levels across different types of housing and building materials without limitations. SD avoids both the problem of social desirability generated by direct questions (Campbell, Converse, and Rodgers Citation1976; Argyle Citation2013) such as: … How satisfied are you with … and the confusion causing low validity of research with indirect questions (Aigbavboa and Thwala Citation2018).
The SD is a type of closed-ended, multiple-choice survey questions, which are commonly used in RS research (James and Carswell Citation2008). Our decision to use this method was influenced by two factors. Firstly, our objective is not to delve into the complexities of RS (Romano et al., Citation2003, 215). Secondly, addressing the question of construction material in an open questionnaire is challenging. The study by James and Carswell (Citation2008) failed to capture any mentions of building technology using an open-ended questionnaire methodology, and discussions about homes can involve various dimensions, such as social, economic, technological, and psychological (Kebaili & Bensalem, Citation2007). Therefore, we opted for a tried-and-true closed-form approach (Smith, Citation1987). The SD method is chosen for its ease of scale preparation and the ability to allow multiple comparisons. Furthermore, it is worth noting that this method has been successfully applied in various cultures and subcultures (Oskamp & Schultz, Citation2005, p. 53).
As with previous studies on RS (Aigbavboa and Thwala Citation2018), our research endeavors to collect genuine subjective measurements pertaining solely to the residential units and building materials under investigation, rather than all residential attributes. The research methodology is designed to examine how changes in building material technology impact RS, while allowing for the separate study of these two attributes without completely isolating them from the effects of other variables such as neighborhood variables, government-provided services, and other pertinent exogenous variables (Aigbavboa and Thwala Citation2018). Therefore, RS is typically regarded as an outcome, with one aspect being linked to the technology of the building material, and the other aspect being associated with the satisfaction with the technology of the building material. For the first aspect, the RS of two groups of residents who live in homes made with CSEB and fired-brick will be compared. The research will determine whether there are significant levels differences in RS between the two groups. For the second aspect, the relationship between RS and HBMS will be verified. A comparison of the two groups of residents will elucidate this relationship.
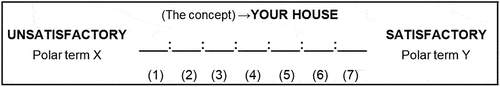
RS and HBMS are both measured on a seven-point Likert scale, with 1 being “extremely unsatisfied” and 7 being “extremely satisfied” (Osgood & Tannenbaum, Citation1955), which can be viewed in two ways. Firstly, as an experienced feeling that reflects people’s perception of how well their requirements have been met, which can be high or low (Hill, Self, and Roche Citation2007). Secondly, as an expected feeling that reflects people’s anticipation of how well their requirements will be met. The research team used the SD according to the methodology suggested by Osgood et al. (Citation1957). The scale has been designed as shown in in which the participant is going to mark an X on the extent of satisfaction he or she feel with the concept. Instructions to correctly fill out the questionnaire form were provided.
Figure 4. Semantic differential scale layout. The concept at the top (your house) is evaluated on an adjectival scale with two opposite poles. The X pole (UNSATISFACTORY) and the Y pole (SATISFACTORY) are separated by seven steps; (1) for extremely unsatisfactory, (2) for quite unsatisfactory, (3) for slightly unsatisfactory, (4) for neutral, (5) for slightly satisfactory, (6) for quite satisfactory, and (7) for extremely satisfactory.
Classical statistical exploratory techniques are used (Aigbavboa and Thwala Citation2018) to describe, analyze, and verify the hypotheses. Additionally, each single analysis we performed has generated its statistical conditions. This will be visible in the presentation of the results. As is commonly practiced in RS searches (Aigbavboa and Thwala Citation2018), a multiple regression analysis is employed to assess the relationship between the HBMS and the RS. SPSS version 20 was used to analyze data. Presenting data and writing the results aligns with the APA guidelines (Field Citation2013, 57).
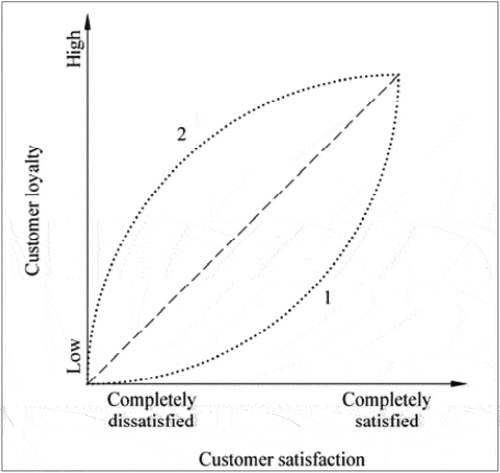
This study is based on the conventional wisdom that in markets where customers have choices, satisfaction and loyalty have a simple, linear relationship, with loyalty increasing as satisfaction increases as shown in (Yang & Zhu, Citation2006). Consequently, the prevalence of building technology is linked to people’s satisfaction with their homes constructed using that technology. This means that the more satisfied people are with their homes, the more widespread the use of the technology will be, and vice versa.
Figure 5. The impact of customer satisfaction on customer loyalty (source: Yang & Zhu, Citation2006).
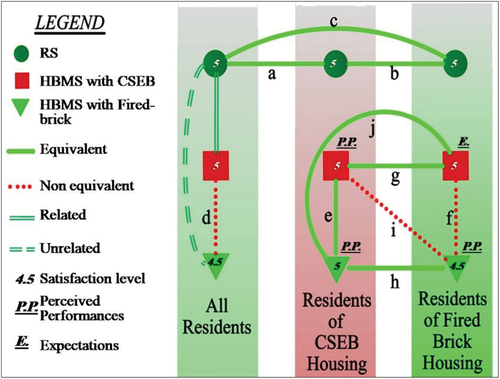
The initial hypothesis pertains to the correlation between HBMS and RS. It postulates that a negative level of HBMS with CSEB has an adverse impact on RS, thus elucidating the limitations associated with the utilization of CSEB. If the aforementioned correlation fails to be substantiated, the investigation will solely focus on evaluating HBMS with CSEB as a means to comprehend the constraints surrounding its usage (cf. ). This approach stems from the understanding that RS is inevitably influenced by various factors beyond the realm of construction materials, which currently lie beyond the scope of this article (cf. section 2).
Figure 6. Hypothesis testing for the limitation of use of CSEB in Auroville. The outcomes of the statistical tests, whether positive or negative, lead to distinct explanations. In the absence of any relationship between RS and HBMS, the limitations surrounding the use of CSEB can be attributed to one of two possible scenarios: (1) an unsatisfactory CSEB or (2) a comparatively lower level of satisfaction with CSEB when juxtaposed with fired-bricks. The third scenario (3), wherein CSEB elicits greater satisfaction compared to fired-bricks, indicates that user satisfaction alone cannot account for the limitations of CSEB usage when compared to fired-bricks. Consequently, there must be additional factors at play that elucidate why CSEB is utilized less frequently than fired-bricks, despite offering a higher level of satisfaction to users. In such instances, alternative hypotheses must be proposed to expound upon the limitations of CSEB usage. It is worth noting that in this instance, the assessment of satisfaction regarding CSEB housings vis-à-vis fired-brick housings is deemed unnecessary, as the construction material does not constitute a determinant of satisfaction. The aforementioned rationale led us to validate the third hypothesis immediately.
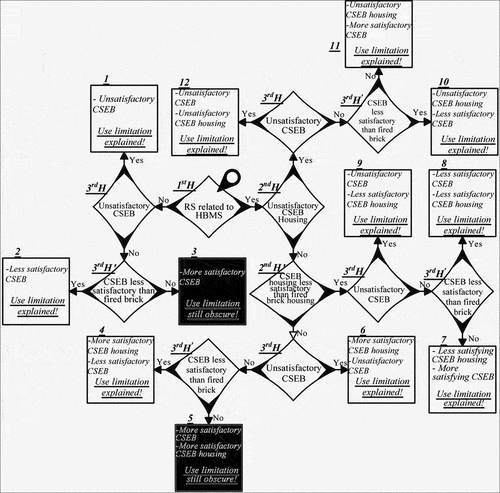
In the first scenario, the research will exclusively examine two hypotheses, as depicted in . Conversely, in the second scenario where a correlation between HBMS and RS exists, an additional hypothesis related to RS with CSEB housing will be tested. However, due to the substantial number of variables associated with RS, it is anticipated that the correlation will not exhibit a significant magnitude. In this context, a small relationship refers to a scenario in which a change in one variable has minimal or negligible impact on the other variable. To accurately reflect this association, a correlation test will be conducted in accordance with Field (Citation2013, 458). The relationship model will incorporate the interaction between HBMS with CSEB technology and HBMS with fired-brick technology. Moreover, the correlation between HBMS with fired-brick technology and RS with fired-brick housing will be examined to facilitate comparative analysis.
The second hypothesis is about the overall RS level of individuals who reside in the CSEB housing units. It suggests that their RS rate level is negative, falling into one of the three negative classifications on the SD scale (namely, levels 1, 2, and 3). This assumption is used to justify why the distribution of CSEB housing units in Auroville is limited. To validate this assumption, the average RS rate of residents living in CSEB homes will be determined using the DS scales, and it will be one of these three negative scores. If no direct negative rate score of 1, 2, or 3 is gathered, a comparison will be made to show a lower rate score than the RS rate of residents living in homes made with fired-bricks. In this latter scenario, the RS rate level of CSEB homes will be viewed as relative to the RS rate level of homes constructed with fired-bricks and not as an absolute negative rate.
The third and final hypothesis is related to the HBMS with CSEB technology level of residents and assumes that it is negative (falling on level 1, 2, or 3 of the SD scale) or less than that with fired-brick technology marked as 3rdH and 3rdH’ respectively on . To verify this hypothesis, the mean HBMS rates of the recorded data will be compared. It is imperative to highlight that this hypothesis remains unverified in the event that the recorded average level of HBMS with CSEB is positive and surpasses that with fired-brick. Under such circumstances, the inference drawn would be that HBMS with CSEB does not explain the observed use limitation pertaining to CSEB compared to fired-brick.
depicts the diverse pathways that the demonstration presented herein might take to explain the use limitations of CSEB. The approach provides for a variety of possible responses, but only one response can accurately represent the Auroville case. Two of the twelve paths produce rather problematic outcomes. We begin with the 1st hypothesis (1stH), which states that there is a relationship between the RS and HBMS. This hypothesis can be confirmed (Yes) or rejected (No) based on the results of the statistical test. If it is rejected, we proceed to the left case, where we test the third hypothesis (3rdH) which states that the limitation of use of CSEB is due to dissatisfaction with the material. This hypothesis can also be confirmed or rejected based on the results of the statistical test. If it is rejected, we proceed to the lower case, where we test the third hypothesis BIS (3rdH’) which states that the limitation of use of CSEB is due to a lower level of HBMS with the material compared to the level of HBMS with fired-bricks. This hypothesis can also be confirmed or rejected based on the results of the statistical test.
If 3rdH’ is rejected, then the limitation of use of CSEB cannot be explained by the hypotheses tested. This is because the result of this hypothesis would indicate that the inhabitants are more satisfied with CSEB than with fired-bricks, which is inconsistent with the observation that CSEB is less used than fired-bricks. However, if 3rdH’ is confirmed, then the limitation of use of CSEB can be explained by the hypotheses tested. This is because the result of this hypothesis would indicate that the inhabitants are less satisfied with CSEB than with fired-bricks, which is perfectly consistent with the observation that CSEB is less used than fired-bricks. This is how we explore the different paths to determine which of these cases applies to the CSEB in Auroville. It is important to note that if the test result of the 1stH is not verified, then there is no need to test the two second hypothesis, 2ndH and 2ndH’, as there would be no relationship between HBMS with CSEB and RS with CSEB housing.
4. RS with CSEB housing in Auroville
We conducted statistical tests to examine the status of RS in relation to CSEB housing in Auroville. Our approach adhered to the framework depicted in . We thoroughly assessed the significance of the results and their applicability to the wider population of Auroville.
4.1. Relationship between RS with CSEB housing and HBMS with CSEB technology
A multinomial logistic regression was performed to improve the model of the relationship between the predictor variables of the HBMS with both technologies (CSEB and fired-brick) and the seven classes of RS (extremely unsatisfied, quite unsatisfied, slightly unsatisfied, neutral, slightly satisfied, quite satisfied, and extremely satisfied). Stepwise terms were chosen to inform which of the two variables significantly improve the model’s ability to predict the outcome categories. The fit between the model containing only the intercept and data improved with the addition of the predictor variable of the HBMS with CSEB technology. HBMS with fires brick variable was removed, χ2 (df = 6, N = 347) = 24.065, p = .001. The Cox and Snell measure (0.067) and Nagelkerke’s adjusted value (0.069) are reasonably similar values and represent very small-sized effects. details the overall effects and shows individual parameter estimates for each level of RS. summarizes the analysis. After the all effects were entered (model 0), the HBMS with fired-brick technology (HBMSFB) was removed (model 1). The chi-square statistics for step 1 is not significant, indicating that this variable do not significantly improve the model’s ability to predict the outcome of the RS. The AIC gets smaller as this term is removed from the model, indicating that the fit of the model is improving. The BIC shows a similar pattern.
Table 2. Results of the multinomial logistic regression analysis examining the relationship between the predictor variables of the satisfaction with the building technology and the seven classes of satisfaction with the homes.
Table 3. Step summary.
presents a comprehensive overview of the effects resulting from increasing HBMS with the CSEB by one level on each level of RS in Auroville. Consequently, heightening HBMS with the CSEB by one level leads to a 1.62-fold increase in the likelihood of experiencing extreme positive level of RS of 7, relative to extreme negative level of RS of 1. Additionally, it results in a 0.62-fold reduction (which is the inverse of the value (-) 1.62 indicated in , for changes in reference to level 7) in the probability of encountering extreme negative level of RS of 1, compared to extreme positive level of RS of 7. In general, it can be argued that enhancing HBMS with the CSEB exclusively leads to an elevation in RS.
Figure 7. Effects of HBMS with CSEB technology on RS in Auroville. Every arrow originates from a particular level and terminates at another level. Positive relationships are denoted by arrows pointing from the reference level to the target level, which are also marked with a (+) sign. Conversely, negative relationships are represented by arrows pointing from the target level to the reference level, which are also marked with a (-) sign. The coefficient of probability change remains consistent for positive relationships, while it is reversed for negative relationships.
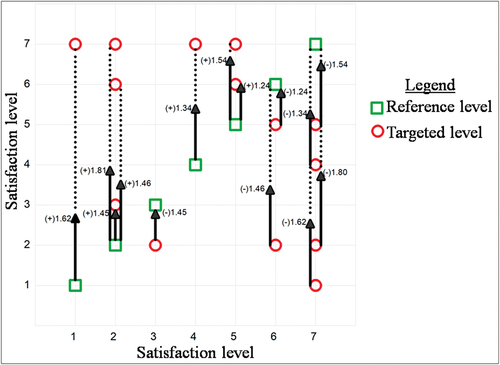
Hence, within the context of Auroville, the RS towards CSEB housing exhibits a significant relationship with HBMS levels specific to CSEB. Consequently, this relationship prompts us to investigate and determine the extent of RS pertaining to CSEB housing, which is marked as 2ndH on the diagram of . It is noteworthy, however, that in the case of fired-brick housing, the conducted test revealed a lack of relationship between RS and HBMS.
4.2. RS with CSEB housing in Auroville
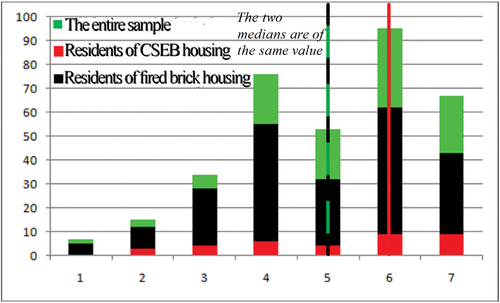
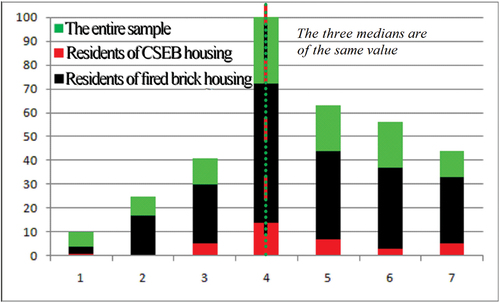
The levels of satisfaction obtained for the concept of “My house” under investigation are distributed across the seven levels offered by the SD in a discernible manner, as depicted in . It can be observed that a majority of the RS levels expressed are positive, irrespective of the type of housing.
Figure 8. Distribution of RS levels among Auroville residents.
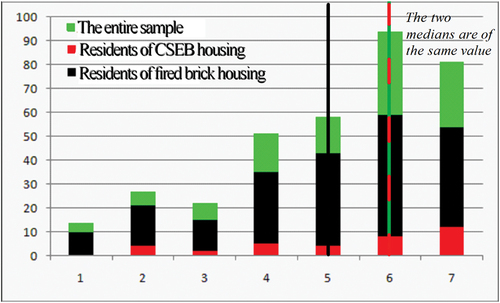
The results indicate that the mode, which represents the most frequently occurring level of RS, for residents living in houses constructed with CSEB, is 7, indicating an extremely satisfied response. Conversely, the mode for both the entire sample and residents living in houses constructed with fired-brick is 6, indicating a quite satisfied response, as illustrated in . Additionally, the observed medians demonstrate higher level of RS with CSEB housing compared to that with fired-brick housing and equivalent level of RS compared to the overall housing.
As depicted in , the observed central tendency of RS of houses constructed with CSEB surpasses that of houses built with fired-bricks. Moreover, the RS of houses constructed with CSEB is comparable to that of houses constructed using various construction technologies. This observation implies that our initial hypothesis, which posited that houses built with CSEB would exhibit lower RS than those built with fired-bricks, is incorrect.
To facilitate the generalization of this result to all residents of the town, the recorded median will be compared with the two values that immediately follow in the up and down directions in the SD scale, which are 6 and 4, respectively (cf. ). In order to obtain a precise estimate of the median value, a supplementary test was conducted involving a comparison with the intermediate level degree, specifically with regard to the value of 5. The comparison was performed using the Wilcoxon signed rank test, in accordance with its prescribed terms of use, and yielded the following results:
Figure 9. Auroville residents’ satisfaction with their homes and building materials (N = 347).
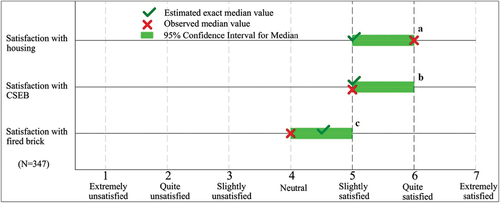
Comparison with the value of the “quite satisfied” level at 6 yielded a significant difference from the recorded median of the level of RS for the studied sample (Mdn = 6.00), with a z-score of -9.12, p-value of .000, and effect size of r = .49. Similarly, a significant difference was observed when comparing the recorded median with the value of the “neutral” level at 4 (Mdn = 4.00), with a z-score of 9.50, p-value of .000, and effect size of r = .51. In contrast, no significant difference was found when comparing the recorded median with the value of the “slightly satisfied” level at 5 (Mdn = 5.00), with a z-score of 1.34, p-value of .180, and effect size of r = .07.
This finding enables generalizations to be drawn regarding the level of RS in Auroville, indicating it to be slightly positive. These insights will be further explored with a focus on CSEB housing. It is worth noting that the sample size for this time is limited to N = 35, as only 35 individuals residing in CSEB houses participated in the survey.
Based on the data presented in , the observed median level of RS with CSEB housing is Md = 6, indicating a positive level of RS that is higher than the exact median level estimated for the general population of Auroville. To extend this finding to the broader population of individuals residing in CSEB housing in the town, the observed median will be compared with the two values that immediately follow it in the up and down directions on the DS scale, which are 7 and 5, respectively. Supplementary tests were performed to obtain a precise estimate of the median value, involving comparisons with neighboring level degrees, specifically values 6 and 4. Similar to the aforementioned procedures, the Wilcoxon signed rank test was used to conduct these comparisons, resulting in the following outcomes:
Figure 10. Auroville residents’ satisfaction with their CSEB housing and building materials (N = 35).
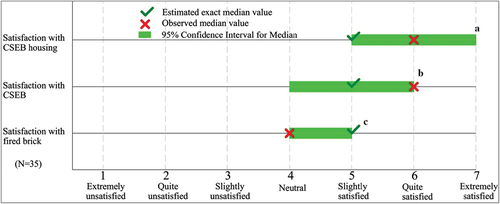
comparing the recorded median of the level of RS with CSEB housing for the studied sample (Mdn = 6.00) with the value of the “extremely satisfied” level at 7, a significant difference was observed, with a z-score of -4.228, p-value of .000, and effect size of r = -.71. Similarly, a significant difference was found when comparing the recorded median with the value of the “quite satisfied” level at 6 (Mdn = 6.00), with a z-score of -2.146, p-value of .032, and effect size of r = -.36. In contrast, a significant difference was also noted when comparing the recorded median with the value of the “neutral” level at 4 (Mdn = 4.00), with a z-score of 3.669, p-value of .000, and effect size of r = .62. However, no significant difference was found when comparing the recorded median with the value of the “slightly satisfied” level at 5 (Mdn = 5.00), with a z-score of 1.08, p-value of .280, and effect size of r = .18.
The results indicate that the average level of RS with CSEB housing in Auroville is slightly positive, which contradicts the initial hypothesis that it would be negative. This finding partially refutes the 2nd hypothesis and suggests that the level of RS with CSEB housing in Auroville is comparable to the average level recorded for housing in the general city.
2 We come now to verify the second hypothesis BIS, which requires following the path marked 2ndH’ in the diagram of . It is worth noting that the sample size for this time is N = 237, as 237 individuals residing in fired-brick houses participated in the survey (cf. ).
display the observed median level of RS with fired-brick housing, which is Md = 5.00, indicating a positive level of RS that is comparable to the exact median level estimated for the general population of Auroville. To extend this finding to the broader population of individuals residing in fired-brick houses, the observed median will be compared with the two values that immediately follow it in the up and down directions on the SD scale. Subsequently, the following results were obtained:
Figure 11. Auroville residents’ satisfaction with their fired-brick housing and building materials (N = 237).
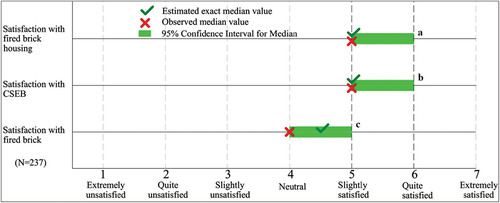
When comparing the recorded median of the level of RS with fired-brick housing for the studied sample (Mdn = 5.00) with the value of the “quite satisfied” level at 6, a significant difference was observed, with a z-score of 7.897, p-value of .000, and effect size of r = .51.Similarly, a significant difference was found when comparing the recorded median with the value of the “neutral” level at 4 (Mdn = 4.00), with a z-score of 7.364, p-value of .000, and effect size of r = .48. However, no significant difference was found when comparing the recorded median with the value of the “slightly satisfied” level at 5 (Mdn = 5.00), with a z-score of .41, p-value of .685, and effect size of r = .03.
Based on our findings, we can generalize and conclude that the average level of RS with fired-brick housing in Auroville is also slightly positive, similar to the overall level of RS in the city. However, one question remains to be answered – whether there is a significant difference in RS between CSEB housing and fired-brick housing. The results of the comparison test indicate that there is no significant difference in the level of RS between CSEB housing and fired-brick housing, with a χ2 (1) value of .747 and a p-value of .387 (cf. ).
This findings have disconfirmed both parts, 2ndH and 2ndH’of the second hypothesis. As RS with CSEB housing is neither negative nor lower than that with homes built with fired-brick. Thus, the statement that affirms the slight level of RS in Auroville regardless of the building technology remains plausible. We now turn our attention to verifying the third hypothesis, 3rdH, regarding HBMS with CSEB technology.
4.3. HBMS with CSEB technology in Auroville
The levels of HBMS obtained for the concepts of “CSEB” under investigation are distributed across the seven levels offered by the SD in a discernible manner, as shown in . It can be observed that the majority of the HBMS levels expressed are positive, namely levels 5, 6, and 7, regardless of whether the inhabitants live in CSEB, fired-brick, or any other type of housing. The inhabitants of CSEB housing exhibit a bimodal distribution of levels of HBMS with CSEB technology, as shown in . The modes of this distribution are 6 and 7. Similarly, the mode of the distribution of levels of HBMS with CSEB technology for both the entire sample and residents of fired-brick housing is 6.
Figure 12. Distribution of levels of HBMS with CSEB technology among Auroville residents.
As a result of the bimodal distribution of HBMS with CSEB among units residing in CSEB housing, in order to properly evaluate this observation, it becomes imperative to conduct comparative analyses of these observations with the respective medians. Consistent with our previous approach, we begin by comparing the observations before generalizing. As indicated in , the observed median level of HBMS with CSEB technology of the entire sample (N = 347) is Md = 5.00. When comparing the recorded median of the level of HBMS with CSEB for the studied sample (Mdn = 5.00) with the value of the “quite satisfied” level at 6, a significant difference was observed, with a z-score of -10.44, p-value of .000, and effect size of r = -.56. Similarly, a significant difference was found when comparing the recorded median with the value of the “neutral” level at 4 (Mdn = 4.00), with a z-score of 10.34, p-value of .000, and effect size of r = .56.However, no significant difference was found when comparing the recorded median with the value of the “slightly satisfied” level at 5 (Mdn = 5.00), with a z-score of .96, p-value of .336, and effect size of r = .05.
When comparing the recorded median (cf. ) of the level of HBMS with CSEB for residents of CSEB housing (N = 35) in the studied sample (Mdn = 6.00) with the value of the “quite satisfied” level at 6, a significant difference was observed, with a z-score of -2.91, p-value of .004, and effect size of r = -.49. Similarly, a significant difference was found when comparing the recorded median with the value of the “neutral” level at 4 (Mdn = 4.00), with a z-score of 3.42, p-value of .001, and effect size of r = .58.However, no significant difference was found when comparing the recorded median with the value of the “slightly satisfied” level at 5 (Mdn = 5.00), with a z-score of .44, p-value of .659, and effect size of r = .07.
When comparing the recorded median (cf. ) of the level of HBMS with CSEB for residents of fired-brick housing (N = 237) in the studied sample (Mdn = 5.00) with the value of the “quite satisfied” class at 6, a significant difference was observed, with a z-score of -9.17, p-value of .000, and effect size of r = -.6. Similarly, a significant difference was found when comparing the recorded median with the value of the “neutral” class at 4 (Mdn = 4.00), with a z-score of 7.86, p-value of .000, and effect size of r = .51.However, no significant difference was found when comparing the recorded median with the value of the “slightly satisfied” class at 5 (Mdn = 5.00), with a z-score of -.39, p-value of .698, and effect size of r = -.03.
Based on these findings, it can be concluded that HBMS with CSEB technology is not negative. CSEB technology is slightly satisfactory, at the fifth level of HBMS of the SD, whether for the entire population of Auroville, for residents of CSEB housing, or for residents of fired-brick housing. Furthermore, contrary to our expectations, the level of HBMS with CSEB technology is not significantly different between residents of CSEB housing and residents of fired-brick housing, with a χ2 (1) value of .625 and a p-value of .543 (cf. ).
Figure 13. Comparison of resident satisfaction levels between groups. The satisfaction levels are the estimated exact median values. Note: RS: residential satisfaction, HBMS : house-building-material satisfaction.
These findings prompt us to conduct a comparative analysis of the HBMS with fired-brick levels. The observed medians demonstrate higher levels of HBMS with CSEB technology compared to those of fired-brick technology (cf. ). The main tendency of HBMS with the CSEB technology is of higher level than that of the fired-brick technology. The following analysis aims to corroborate the hypothesis denoted as “3rdH’” on the diagram presented in . To begin with, it is imperative to ascertain the representativeness of the observed results concerning HBMS with fired-brick technology. The test results are summarized as follows:
The levels of HBMS obtained for the concepts of “Fired-brick” under investigation are distributed across the seven levels offered by the DS in a discernible manner, as shown in . It can be observed that both central tendencies, the mode and the median, are on the neutral level of HBMS, namely the fourth level on the DS scale, regardless of whether the inhabitants live in CSEB, fired-brick, or any other type of housing.
Figure 14. Distribution of levels of HBMS with fire brick technology among Auroville residents.
When comparing the recorded median of the level of HBMS with fired-brick (cf. ) for the entire sample (N = 347, Mdn = 4.00) with the value of the “quite satisfied” level at 6, a significant difference was observed, with a z-score of -13.31, p-value of .000, and effect size of r = -.71. Similarly, a significant difference was found when comparing the recorded median with the value of the “neutral” level at 4 (Mdn = 4.00), with a z-score of 6.12, p-value of .000, and effect size of r = .33.However, no significant difference was found when comparing the recorded median with the value of the midpoint between the “neutral” and “slightly satisfied” level at 4.5 (Mdn = 4.00), with a z-score of .48, p-value of .631, and effect size of r = .03.
When comparing the recorded median of the level of HBMS with fired-brick (cf. ) for residents of CSEB housing (N = 35) in the studied sample (Mdn = 4.00) with the value of the “quite satisfied” level at 6, a significant difference was observed, with a z-score of -4.40, p-value of .000, and effect size of r = 0.74. Similarly, a significant difference was found when comparing the recorded median with the value of the “neutral” level at 4 (Mdn = 4.00), with a z-score of 2.3, p-value of .022, and effect size of r = .39.However, no significant difference was found when comparing the recorded median with the value of the “slightly satisfied” level at 5 (Mdn = 5.00), with a z-score of -1.49, p-value of .135, and effect size of r = -.25.
When comparing the recorded median of the level of HBMS with fired-brick (cf. ) for residents of fired-brick housing (N = 237) in the studied sample (Mdn = 4.00) with the value of the “quite satisfied” level at 6, a significant difference was observed, with a z-score of -10.84, p-value of .000, and effect size of r = -.7. Similarly, a significant difference was found when comparing the recorded median with the value of the “neutral” level at 4 (Mdn = 4.00), with a z-score of 5.64, p-value of .000, and effect size of r = .37.However, no significant difference was found when comparing the recorded median with the midpoint value between the “neutral” and “slightly satisfied” level at 4.5 (Mdn = 4.00), with a z-score of .87, p-value of .384, and effect size of r = .06.
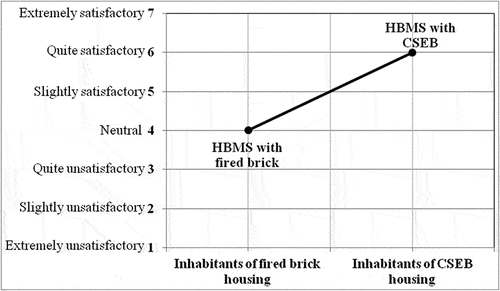
Contrary to our initial expectation, the recorded level of HBMS with CSEB technology (Mdn = 5) was found to be significantly higher than the level of HBMS with fired-brick technology (Mdn = 4) among the entire residents of Auroville, with a z-score of 4.466, p-value of .000, and effect size of r = .24 (cf. ). However, this was not the case for residents of CSEB housing, where no significant difference was observed between the level of HBMS with CSEB technology (Mdn = 6) and that with fired-brick (Mdn = 4), with a z-score of 1.544, p-value of .123, and effect size of r = .261 (cf. ). In contrast, a significant difference was observed among residents of fired-brick housing, with a z-score of 2.608, p-value of .009, and effect size of r = .169, between the level of HBMS with CSEB technology (Mdn = 5) and that with fired-brick (Mdn = 4) (cf. ). As a result, the third hypothesis is disconfirmed at this stage of the study. This discovery contradicts the research postulates, as it suggests that the less satisfactory technology of fired-brick is less limited in use than the more satisfactory technology of CSEB. Furthermore, the results indicate that residents of CSEB housing exhibit significantly higher level of HBMS when compared to those residing in fired-brick housing, as evidenced by a χ2 (1) value of 5.776 and a p-value of .026 (cf. ). However, it should be noted that the HBMS with fired-brick technology of residents of CSEB housing does not significantly differ from the HBMS with CSEB technology of residents of fired-brick housing, as indicated by a χ2 (1) value of 2.656 and a p-value of .147 (cf. ). It is worth noting that, similar to HBMS with CSEB technology (cf. ), the level of HBMS with fired-brick technology was not found to be significantly different between residents of CSEB housing and residents of fired-brick housing, with a χ2 value of .336 and a p-value of .590 (cf. .
Figure 15. Levels of HBMS with CSEB among residents of fired-brick housing.
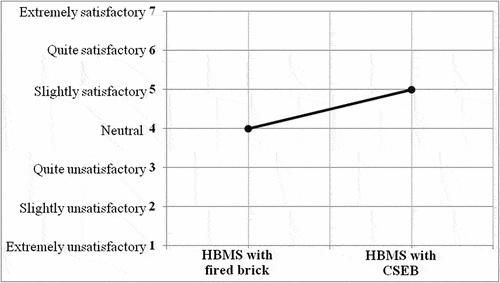
Figure 16. Homeowners’ house-building-materials satisfaction. HBMS with CSEB technology of residents of CSEB housing is higher than HBMS with fired-brick technology of residents of fired-brick housing. Note: SAWCSEB: HBMS with CSEB, SAWFB: HBMS with fired-brick.
The analysis of RS and HBMS in Auroville reveals a much more complex situation than anticipated by the research. The level of RS with CSEB housing is equivalent to other RS in Auroville, but also varying levels of HBMS with CSEB technology depending on whether it pertains to the entire population of the city, residents of CSEB housing, or residents of fired-brick housing. The discussion in Section 5 will shed some light on these findings.
5. Interpretation and discussion
For the purpose of comparison, it is assumed that the residents of the CSEB houses belong to the most extensive population that have encountered or acquired certain beliefs regarding fired-brick houses and fired-brick technology (Aigbavboa and Thwala Citation2018, 157). If the HBMS level with CSEB were to exceed the level of HBMS with fired-brick among the residents of CSEB housing, it would be deemed normative, indicating that the expectations of the residents are congruent with the experienced performance. In Auroville, unfortunately, this situation is not as straightforward, as it can be understood in many different ways. Here are some interpretations based on commonly used perspectives in satisfaction research.
Viewed through the lens of the Expectancy Disconfirmation Paradigm Theory, the slight satisfaction level of RS with CSEB housing, that is similar to fired-brick housing and to any other housing in Auroville, suggests that the performance of CSEB houses falls within the typical range (Oliver, Citation1989, Jaafar and Hasan Citation2005). These findings provide some degree of reassurance about the quality of CSEB housing.This theory suggests conducting further investigation into other potential factors, which may not necessarily be of a psychological nature, as all factors seen on Section 2, in order to achieve a comprehensive understanding of the observed disparities.
Based on Tse and Wilton’s (Citation1988) models of consumer satisfaction formation, we noticed that occupants of CSEB housing are not more satisfied than those residing in fired-brick houses (cf. ). It is essential that expectations of residents of CSEB homes are similar to those of fired-brick homes, indicating that the RS level offered by CSEB homes is insufficient to build loyalty towards this type of housing. This observation provides a better understanding of the current situation in Auroville, where fired-brick houses are the norm and residents perceive switching to CSEB houses as requiring additional effort without any added benefits. Almost similarly, the Value-Percept Disparity Theory by Parker and Mathews (Citation2001) suggests that the perceived value of CSEB houses is similar to that of houses made with fired-bricks and other types of homes in the city. Accordingly, selecting a CSEB house does not confer any additional value compared to other housing alternatives available in the city. This suggests that the lack of preference for CSEB housing may stem from a perception that it does not offer any unique advantages or benefits to its occupants, leading to a preference for more conventional housing options. Thus, these two models underscore the urgency of exploring strategies to stimulate interest and acquisition of CSEB houses.
The finding above provides further reassurance regarding the perceived value of CSEB products. The degree of reassurance is heightened by the clear demonstration of the advantages of CSEB over fired-brick, as evidenced by its superior performance in reaching better favorability of both the general populace and residents of fired-brick houses (cf. ). Unfortunately, residents of CSEB housing show equivalent levels of HBMS with CSEB and fired-brick (cf. ). It is noteworthy that occupants of CSEB houses assess the perceived performance of theCSEB in relation to their overall level of satisfaction, whereas those in other housing types evaluate their expectations. Referring to the Cognitive Dissonance Theory (Festinger Citation1957), the residents of CSEB housing compared their expectations about CSEB with the perceived CSEB performance. This comparison led to a perceived discrepancy, which caused dissonance or negative disconfirmation. This perspective assumes that the residents of the CSEB housing were previously like all the residents of the city more satisfied with CSEB than with fired-brick (cf. ), and then exposed to their post-occupancy evaluations. They showed then the assimilation effect (Anderson Citation1973). To avoid dissatisfaction, the residents of CSEB housing adjusted their perceptions to bring it more in line with their expectations. They mitigated the dissatisfaction arising from the disparity between expectations and perceived performance of CSEB by adjusting the level of HBMS with fired-brick to match that of HBMS with CSEB (cf. ). As observed, dissatisfaction is not an outcome of the post-occupancy evaluation process, but we can see that residents of CSEB housing, as part of the general population with a greater appreciation of CSEB technology, raised their satisfaction levels with fired-brick to match their level of satisfaction with CSEB (cf. ). This, can be also inferred through satisfaction equivalence (cf. ), as a new product typically aims to increase satisfaction levels. substantiates our hypothesis regarding the residents of CSEB housing and their origin from an identical population, similar to residents of fired-brick housing, as evidenced by their comparable values of HBMS with fired-brick. Any contrary outcome would have posed significant challenges. provide evidence indicating that the implemented modification on HBMS with Fired-brick, depicted in , does not effectively differentiate residents of CSEB housings from the remaining population.Additionally, the emergence of the assimilation effect, as demonstrated by the adjustment of satisfaction levels with fired-brick, highlights the challenges faced by residents of CSEB housing when evaluating the performance of CSEB technology. Consequently, the transition to this preferred technology may take longer than anticipated. Alternatively, the city may need to explore strategies that facilitate the population’s evaluation of this technology in order to expedite the transition process.
We must remember that the HBMS with CSEB technology among residents of fired-brick housing represents expectations because the disconfirmation process has no perceived performances to deal with. In contrast, the HBMS with fired-brick among residents of CSEB housing deals most likely with perceived performances during the disconfirmation process. Despite this, HBMS with CSEB technology among residents of fired-brick housing is equivalent to HBMS with fired-brick technology among residents of CSEB housing (cf. ). Assuming that the residents of CSEB housing belong to the same population group as the residents of fired-brick housing, namely the Auroville community, and therefore shared similar expectations of CSEB technology, it can be inferred that the perceived performance of the CSEB technology did not contribute positively to their satisfaction levels. This, in turn, resulted in a negative disconfirmation, as discussed previously.For the CSEB industry, this suggests that additional investment will be necessary to enhance the persuasiveness of the product.
Dissatisfaction may arise when the perceived performance of a product falls short of expectations, or when it exceeds expectations, as postulated by the Negativity Theory. This is because users with strong expectations are inclined to respond negatively to any form of disconfirmation, as they perceive a discrepancy between their expectations and the actual performance of the product (Anderson Citation1973). Viewed this way, there are no strong expectations for CSEB technology from the residents of CSEB housing and the other residents of Auroville as they did not show dissatisfaction (Aigbavboa and Thwala Citation2018). This theory is of particular interest as it draws attention to a specific segment of the population that exhibits clear dissatisfaction. In-depth future analysis of the expectations held by this demographic may facilitate further research and improvements in the performance ofCSEB technology, ultimately leading to enhanced outcomes and surpassing the current level of performance that has contributed to the current situation.Because residents’ perceptions and beliefs of the physical environment are a function of the physical environment itself, Marans and Spreckelmeyer (Citation1981) established that residents’ satisfaction is influenced by these factors.
When the equivalence in levels of HBMS is observed (cf. ), it suggests that CSEB does not offer any additional benefits to the population.The observations made regarding CSEB housing equally apply to the CSEB itself. The performance of both CSEB and fired-brick can be deemed to fall within the realm of normalcy. CSEB technology does not confer a higher degree of HBMS upon Auroville inhabitants. The expectations of the inhabitants towards CSEB are comparable to those towards fired-brick. Consequently, it can be inferred that the HBMS level provided by CSEB technology is inadequate to engender loyalty towards the said technology.
Similarly, the perceived value held by CSEB is equivalent to that of fired-brick.Fornell already stated (Fornell Citation1992) [that the impact of customer satisfaction for repeat business and customer loyalty is not the same for all [technologies]. Loyal customers are not necessarily satisfied customers, but satisfied customers tend to be loyal customers].On this basis we can distinguish the two technologies studied here, one enjoying positive satisfaction while the other approaching the neutral satisfaction level. This is another advantage of CSEB technology, because researchers differentiate between true and false loyalty based on their association with positive or neutral satisfaction, respectively (Yang & Zhu, Citation2006).With respect to the two technologies studied here, this assertion by Fornell (Citation1992) will stimulate future studies, as it did up to date (Gures, Arslan, and Tun Citation2014), that predict moments when customer loyalty does not return from false to true loyalty. Because among residents of CSEB housing, we see very well their return to a real loyalty to fired-brick (cf. ).However, this situation does not offer a resolution for them, as they find themselves experiencing an ambivalent attitude (Kassin et al., Citation2019), characterized by uncertainty regarding which option to select and to which they should pledge their loyalty.
Because the relationship satisfaction-customer loyalty is also affected by the degree (High and Low) of competitiveness of a market as expressed by Jones (Citation1995), it is worth noting that the observed slowness shown by CSEB in surveying the Auroville building technology market and the limit of customer loyalty towards CSEB, which corresponds to the usage limit of this technology, are indicative of the highly competitive nature of the building materials market in Auroville. This market seems to be biased toward fired-brick technology.
The inhabitants residing in CSEB housing, a subset of the city’s population, are evaluating their expectations of CSEB in relation to its daily perceived performance. Should they exhibit a higher level of HBMS with CSEB compared to fired-brick, they would serve as credible and reliable sources (Kassin et al., Citation2019) for disseminating their positive experiences to the broader urban populace. It is a widely acknowledged phenomenon that expectations are transmitted through past experiences and acquaintances, as stated by Aigbavboa and Thwala (Citation2018). It can be confirmed that the positive expectations of the city’s residents, namely HBMS, (cf. ) are likely to originate from sources beyond their personal experiences and acquaintances. We hope this matter will be further investigated in future research.
The relationship between RS and HBMS with both building materials under study is found to be small. This finding is consistent with the results reported by Choi et al. (Citation2016), which highlight that satisfaction with physical choices is less significant than other aspects of RS. Based on our analysis, it can be inferred that residents of Auroville express slightly positive levels of satisfaction with their homes, regardless of the construction technology employed, be it CSEB or fired-brick. This observation justifies the current state of affairs in Auroville, indicating that there is no compelling reason to substitute one material, fired-brick, for another, CSEB, if the outcome is comparable. If these findings are corroborated by additional research, it would imply that HBMS alone is insufficient to improve overall RS levels. Auroville’s policy of promoting clean construction technologies necessitates then the implementation of supplementary measures. The city should proactively seek and implement requisite measures that can effectively ensure a significant impact on the residential satisfaction (RS) of its inhabitants at a holistic level.
In light of the low participation of HBMS with CSEB in overall RS, it is imperative to strengthen this participation. The Habitability Model (Onibokun, Citation1974) provides a framework for opening up research perspectives on what can differentiate and, therefore, favor CSEB housing over other types of housing in order to reinforce and enhance the contribution of HBMS with building technology to RS. This framework takes into account the variables that influence the level of satisfaction with a residential unit, including the internal area, structural integrity, household amenities, available facilities, and the quality of the internal environment. These different elements make up various subsystems of the unit. For a city seeking to encourage CSEB, it is required to complement this new construction technology with a significant improvement in at least one of the subsystems that influence RS, such as the external environment, management, or dwelling unit subsystems. The Hourihan Model (Hourihan Citation1984) and the Housing Adjustment Model (Morris & Winter, Citation1978) as cited by Aigbavboa and Thwala(Citation2018), both focus on studying people’s personal characteristics, housing norms, values, and cultural background in relation to their levels of RS with CSEB housing and HBMS with CSEB technology. These models recognize the role of these characteristics in shaping RS and preferences. Understanding the preferences of residents is crucial in directing future research towards the unique features that must accompany the introduction of CSEB technology.
6. Conclusion
In summary, the first key-finding of this analysis indicates that the relationship between HBMS and RS varies depending on the building materials employed. In the context of Auroville, HBMS with CSEB plays a positive role in enhancing RS with CSEB housing. However, the level of HBMS with fired-brick does not exhibit a significant relationship with RS with fired-brick housing. This relationship has only been verified for the entire population. For residents of CSEB housing or fired-brick housing, this relationship has not been established. Future research may need to address this question with a larger number of participants in order to provide further clarification.
The second key-finding indicates that the CSEB presents a higher level of HBMS compared to fired-brick, despite the latter’s widespread usage. This situation would typically be considered normal if CSEB were a recently introduced technology in Auroville. However, it is important to note that CSEB has been in existence in the city for over 25 years, a significant timeframe that calls for a reevaluation of the prevailing perception regarding its recent introduction in Auroville. Taking this into account prompts us to challenge the conventional wisdom that suggests the most widespread technique is the one that achieves the highest level of satisfaction. The fact that CSEB outperforms fired-brick in terms of satisfaction despite its use limitation challenges this notion. The longevity of CSEB’s presence in Auroville indicates that it has withstood the test of time and has proven its effectiveness and desirability. This warrants a reconsideration of the prevailing perception and recognizes CSEB as a viable and satisfactory construction material in its own right. Hence, the superiority of CSEB over fired-brick in terms of satisfaction contradicts the traditional belief that the most widespread technique is inherently the most satisfying.
The unexpected last key-finding indicates that CSEB housing is equally as satisfactory as fired-brick housing. Fortunately, we averted a more complex scenario (depicted by point 5 in ) in which satisfaction would not, in any way, and even partially explain the limited use of CSEB. Because the RS with CSEB housing and the HBMS with CSEB are related, both would be positive and at higher levels, respectively than the RS with fired-brick housing and the HBMS with fired-brick. This situation would rule out both RS and HBMS as a rationale for the limited use of CSEB, as both would be neither negative nor lower than the RS with fired-brick housing and the HBMS with fired-brick. This latter situation would have perfectly explained the case of Auroville if it had occurred. The equality of RS with CSEB housings and fired-brick housings suggests at least one reason why a change from fired-brick to CSEB has not yet occurred. It suggests that the population perceives no incentive to expend the energy to change building material technology, as they will ultimately only attain the same level of RS.
The low level of RS with CSEB housing, and its equivalence with the RS with fired-brick housing level, do not constitute a significant enough demand for residents to aspire to a house built with CSEB, according to Michelson’s integrated model (Citation1977; as cited in Aigbavboa and Thwala Citation2018). Future research that observes the behavior of residents living in CSEB housing has the potential to provide valuable insights into the supportive or restrictive characteristics of CSEB technology (Hashim Citation2003). Such research is particularly critical, given that residents of CSEB housing display significantly higher levels of HBMS with the technology compared to those living in fired-brick housing. Observations of behavior within the framework of this theory can help clarify this issue. A return to conventional building materials (such as fired-brick) would clearly demonstrate the failure of the CSEB project, which is unlikely given the city’s encouragement of ecological change. Studies have shown that people who feel supported tend to persist in their choices even after experiencing setbacks (Deci and Ryan Citation2008). Concurrently, the city ought to seek the necessary support to facilitate enhanced feelings of autonomy, competence, and connectedness among residents of CSEB housing. This emphasis on support aligns with the principles of the Self-Determination Theory framework. The Inclusive Model (Marans and Spreckelmeyer, Citation1981) is consistent with the Integrated Model and emphasizes the importance of observing the behavior of residents to assess their acceptability of CSEB technology. According to this model, human behavior is a reflection of the satisfactory outcomes of the relationships formed through the interaction between residents and their environment; CSEB technology and CSEB housing in this case. The primary hypothesis posits that a positive level of both RS with CSEB housing and HBMS with CSEB technology leads to a positive conduct (Behloul Citation2018), highlighting the corresponding behavior in response to the observed levels of satisfaction.
Based on empirical evidence, we have confirmed a significant relationship between RS and the level of HBMS. This relationship appears to be particularly strong for new building technologies compared to commonly used ones. However, in future similar research studies, the status of the inhabitant in relation to their residence must be taken into account.This suggests that open questionnaires may be more suitable for self-builders, real estate developers, building materials companies, and other key players in the building sector to explore the relationship between RS and HBMS. In fact, the utilization of a questionnaire with SDs allows for a more accurate measurement of satisfaction compared to open-ended questionnaires. Previous research by Kebaili and Bensalem (Citation2007) found that only 26.66% of self-builders openly mention the building material they used, while James and Carswell’s (Citation2008) study focused solely on tenants. Additionally, Aigbavboa and Thwala (Citation2018) suggest that employing a minimum of four items in the investigation of RS yields more reliable results than using a single item. However, given the exploratory nature of this research, we have proceeded with a single item in the expectation of conducting future research with a broader range of items and more dependable outcomes.
Ultimately, the current project in Auroville has demonstrated a path towards achieving RS through the use of ecological technology, which is not accessible through conventional construction technologies. This could elucidate why it has not been considered as a factor influencing RS up until now. If this finding is replicated and confirmed through further research on HBMS with other ecological technologies in the future, it would suggest that initiatives aimed at promoting environmentally friendly technologies can enhance RS and contribute to the overall well-being of city inhabitants.
Acknowledgements
We would like to thank Mr. Satprem Maïni and the staff working with him. We thank the residents of Auroville who participate in this research. We thank our colleagues at the University of Laghouat who helped us complete this work.
Disclosure statement
No potential conflict of interest was reported by the author(s).
Data availability statement
The data that support the findings of this study are available from the corresponding author, N. K., upon reasonable request.
Additional information
Funding
Notes on contributors
Nourredine Kebaili
Nourredine Kebaili is an Assistant Professor at Ammar Telidji University of Laghouat, Algeria. He holds a Magistère degree in Architecture from Ecole Polytechnique d'Architecture et d'Urbanisme of Algiers (2006). His research focuses on attitudes towards earthen architecture in Algeria and worldwide, and he has presented his work at international conferences. Nourredine Kebaili supervises graduate students and collaborates on research projects. He is committed to scientific outreach, participating in public lectures, workshops, and science communication initiatives.
Mohamed Saci
Mohamed Saci is a Lecturer at Amar Thelidji University in Laghouat, Algeria, with over 16 years of teaching experience. He has taught at several Algerian universities and institutes. His specialization lies in regional development and geography. He has made numerous contributions and participated in scientific seminars, as well as published articles on cities, sustainable urbanism, and the preservation of architectural heritage. He serves as an academic advisor to local authorities in planning and ecological housing projects. Additionally, he contributes to the training and supervision of postgraduate students.
Youcef Kehila
Youcef Kehila is a Professor at the Ecole Polytechnique d'Architecture et d'Urbanisme of Algiers. With a Ph.D. in Geophysics and Geomechanics from the Université Joseph Fourier Grenoble I, France, and a background in Civil Engineering, he specializes in the fields of Environment and Circular Economy, Materials and Eco-construction, and Civil Engineering and Architecture. He is an active member of various scientific committees, has published numerous articles in prestigious journals, and has supervised multiple doctoral and master's theses, as well as research projects.
Rafik Bensalem
Rafik Bensalem is an Architect, who graduated from the School of Architecture and Urban Design of Algiers, in 1986, He completed his Ph.D. in 1991 at the University of Sheffield, in the Building Science Department. He is currently a Senior Lecturer at the National Superior School of Architecture of Toulouse in France. He has 3 decades of experience combining teaching, research, institutional responsibilities (Director of a Research Laboratory), international expertise (for UNESCO, UNDP, European Union, and GTZ), and international operational practice in architecture and urban design. His expertise includes energy efficiency in buildings, environmental architecture, and sustainable urban development.
References
- Aigbavboa, C., and W. Thwala. 2018. Residential Satisfaction and Housing Policy Evolution. New York, USA: CRC Press.
- Ali, M. F., and M. V. Natarajan. 2022.” Thermal Insulation of Building Envelope for Ecological Conservation.“ Ecological and Health Effects of Building Materials. Cham, Switzerland: Springer, 185–204. https://doi.org/10.1007/978-3-030-76073-1.
- Allport, G. W. 1935. “Attitudes.” In A Handbook of Social Psychology, edited by C. Murchison, 798–844. Worcester, MA: Clark University Press.
- Amerigo, M. 1990. “The perception of residential environment and environment role.” In Culture, Space and History, edited by Pamir, H., Iuramoglu, V., and Teymur, N., 337–342. Ankara, Turkey: Middle East Technical University, Faculty of Architecture.
- Amérigo, M., and J. I. Aragones. 1997. “A Theoretical and Methodological Approach to the Study of Residential Satisfaction.” Journal of Environmental Psychology 17 (1): 47–57. https://doi.org/10.1006/jevp.1996.0038.
- Anderson, R. E. 1973. “Consumer Dissatisfaction: The Effect of Disconfirmed Expectancy on Perceived Product Performance.” Journal of Marketing Research 10 (1): 38–44. https://doi.org/10.1177/002224377301000106.
- Ardilly, P. 2006. Les techniques de sondage. Paris: Editions Technip.
- Argyle, M. 2013. The Psychology of Happiness. London: Routledge.
- AVEI. n.d. Auroville Earth Institute. https://www.earth-auroville.com/index.php.
- Behloul, M. 2018. “Post-Occupancy Evaluation of Five-Storey Walk-Up Dwellings: The Case of Four Mass Housing Estates in Algiers.” In Housing Provision and Bottom-Up Approaches, 77–116. London: Routledge.
- Berge, B. 2009. The Ecology of Building Materials. Elsevier. https://doi.org/10.1016/B978-1-85617-537-1.00014-7.
- BIS. 2016. National building code of India, 2016. New Delhi, India: Bureau of Indian Standards.
- Bitner, M. 1987. Contextual Cues and Consumer Satisfaction: The Role of Physical Surroundings and Employee Behaviors in Service Settings Unpublished paper., University of Washington.
- Bonnes, M., M. Bonaiuto, and A. P. Ercolani. 1991. “Crowding and Residential Satisfaction in the Urban Environment: A Contextual Approach.” Environment and Behavior 23 (5): 531–552. https://doi.org/10.1177/0013916591235001.
- Bruin, M. J., and C. C. Cook. 1997. “Understanding Constraints and Residential Satisfaction Among Low-Income Single-Parent Families.” Environment and Behavior 29 (4): 532–553. https://doi.org/10.1177/001391659702900405.
- Campbell, A., P. E. Converse, and W. L. Rodgers. 1976. The Quality of American Life: Perceptions, Evaluations, and Satisfactions. New York, USA: Russell Sage Foundation.
- Choi, B., J. A. Park, and H. J. Lee. 2016. “The Development of a Measurement Method for Place Attachment and Its Verification a Housing Satisfaction Measure: A Survey of University Students About Their Homes.” Journal of Asian Architecture & Building Engineering 15 (2): 193–200. https://doi.org/10.3130/jaabe.15.193.
- Dahmann, D. C. 1983. “Subjective Assessments of Neighborhood Quality by Size of Place.” Urban Studies 20 (1): 31–45. https://doi.org/10.1080/713703157.
- Deci, E. L., and R. M. Ryan. 2008. “Self-Determination Theory: A Macrotheory of Human Motivation, Development, and Health.” Canadian Psychology/Psychologie Canadienne 49 (3): 182. https://doi.org/10.1037/a0012801.
- Eagly, A., and S. Chaiken. 1998. “Attitude structure.“ In The Handbook of Social Psychology, 269–322. New York,USA: McGraw-Hill.
- Elsinga, M., and J. Hoekstra. 2005. “Homeownership and Housing Satisfaction.” Journal of Housing and the Built Environment 20 (4): 401–424. https://doi.org/10.1007/s10901-005-9023-4.
- Fernandes, J., M. Peixoto, R. Mateus, and H. Gervásio. 2019. “Life Cycle Analysis of Environmental Impacts of Earthen Materials in the Portuguese Context: Rammed Earth and Compressed Earth Blocks.” Journal of Cleaner Production 241:118286. https://doi.org/10.1016/j.jclepro.2019.118286.
- Festinger, L. 1957. A Theory of Cognitive Dissonance. Stanford, CA: Stanford University Press.
- Field, A. 2013. Discovering Statistics Using IBM SPSS Statistics. California,USA: sage.
- Fornell, C. 1992. “A National Customer Satisfaction Barometer: The Swedish Experience.” Journal of Marketing 56 (1): 6–21. https://doi.org/10.1177/002224299205600103.
- Ge, J., and K. Hokao. 2006. “Research on Residential Lifestyles in Japanese Cities from the Viewpoints of Residential Preference, Residential Choice and Residential Satisfaction.” Landscape and Urban Planning 78 (3): 165–178. https://doi.org/10.1016/j.landurbplan.2005.07.004.
- Glaeser, E. L., D. Laibson, and B. Sacerdote. 2002. “An Economic Approach to Social Capital.” The Economic Journal 112 (483): F437–F458. https://doi.org/10.1111/1468-0297.00078.
- Gomez-Jacinto, L., and I. Hombrados-Mendieta. 2002. “Multiple Effects of Community and Household Crowding.” Journal of Environmental Psychology 22 (3): 233–246. https://doi.org/10.1006/jevp.2002.0236.
- Gures, N., S. Arslan, and S. Y. Tun. 2014. “Customer Expectation, Satisfaction and Loyalty Relationship in Turkish Airline Industry.” International Journal of Marketing Studies 6 (1): 66. https://doi.org/10.5539/ijms.v6n1p66.
- Hackl, P., and A. H. Westlund. 2000. “On Structural Equation Modelling for Customer Satisfaction Measurement.” Total Quality Management 11 (4–6): 820–825. https://doi.org/10.1080/09544120050008264.
- Harmon, L. C., and K. M. McKenna-Harmon. 1994. “The Hidden Costs of Resident Dissatisfaction.” Journal of Property Management 59 (3): 52–55.
- Hashim, A. H. 2003. “Residential Satisfaction and Social Integration in Public Low Cost Housing in Malaysia.” Pertanika Journal of Social Science and Humanity 11 (1): 1–10.
- He, X. 2009. Residential Satisfaction with Home Location: Examination of the Relationship Between Location-Embedded Benefits and Risk Perception. Texas, USA: Texas State University-San Marcos.
- Hellard, R. B. 1993. Total Quality in Construction Projects: Achieving Profitability with Customer Satisfaction. London: Thomas Telford.
- Hill, N., B. Self, and G. Roche. 2007. Customer Satisfaction Measurement for ISO 9000: 2000. Oxfordshire, UK: Routledge.
- Hourihan, K. 1984. “Context-Dependent Models of Residential Satisfaction: An Analysis of Housing Groups in Cork, Ireland.” Environment and Behavior 16 (3): 369–393. https://doi.org/10.1177/0013916584163004.
- IS 2110. 1981. “Code of Practice for in situ Construction of Walls in Buildings with Soil-Cement.” https://www.cracindia.in/admin/uploads/IS-2110.pdf.
- Jaafar, M., and N. L. Hasan. 2005. “The Determinants of Housing Satisfaction Level: A Study on Residential Development Project by Penang Development Corporation (PDC).” Jurnal Kemanusiaan 3 (2): 1–20. https://jurnalkemanusiaan.utm.my/index.php/kemanusiaan/article/view/144/137.
- James, R. N., III, and A. T. Carswell. 2008. “Home Sweet Apartment: A Text Analysis of Satisfaction and Dissatisfaction with Apartment Homes.” Housing and Society 35 (1): 91–111. https://doi.org/10.1080/08882746.2008.11430637.
- Jones, T. O. 1995. “Case Study. When Outsourcing Goes Awry . Seven Experts Discuss How the Outsourcing Crisis Could Have Been Avoided.” Harvard Business Review 73 (3): 24–6, 30, 32–7.
- Kain, J. F., and J. M. Quigley. 1970. “Measuring the Value of Housing Quality.” Journal of the American Statistical Association 65 (330): 532–548. https://doi.org/10.1080/01621459.1970.10481102.
- Kassin, S., S. Fein, H. R. Markus, K. A. McBain, and L. Williams. 2019. Social Psychology: Australian and New Zealand edition. Victoria Australia: Cengage Learning.
- Kebaili, N. 2017, May. Auroville une ville en avant-garde du développement durable. Vie de Ville, 24(5), 122–127.
- Kebaili, N., and R. Bensalem. 2007. “Etude post occupation d’habitations en terre en Algerie.” In CISBAT 2007 international conference, renewables in a changing climate. Innovation in the built environment, Lausanne, Switzerland, edited by J. L. Scartezzini, 139–144. Ecole Polytechnique Federale de Lausanne.
- Kebaili, N., and Y. Kehila. 2017. “Attitudes Toward Earthen Architecture: The Case of Compressed and Stabilized Earth Block Architecture in Auroville, India.” WIT Transactions on Ecology and the Environment 226:761–772. https://doi.org/10.2495/SDP170661.
- Kebaili, N., Y. Kehila, and R. Bensalem. 2023. “Role of Perceived Ecological Quality in a Scale for Measuring Attitude Toward Earthen Building Techniques; Some Findings from a Survey on Compressed Stabilized Earth Blocks in Auroville, India.” Journal of Asian Architecture and Building Engineering, (Just-Accepted) 1–28. https://doi.org/10.1080/13467581.2023.2257282.
- Kollmuss, A., and J. Agyeman. 2002. “Mind the Gap: Why Do People Act Environmentally and What are the Barriers to Pro-Environmental Behavior?” Environmental Education Research 8 (3): 239–260. https://doi.org/10.1080/13504620220145401.
- Kulshreshtha, Y., N. J. Mota, K. S. Jagadish, J. Bredenoord, P. J. Vardon, M. C. van Loosdrecht, and H. M. Jonkers. 2020. “The Potential and Current Status of Earthen Material for Low-Cost Housing in Rural India.” Construction and Building Materials 247:118615. https://doi.org/10.1016/j.conbuildmat.2020.118615.
- Lu, M. 1999. “Determinants of Residential Satisfaction: Ordered Logit Vs. Regression Models.” Growth and Change 30 (2): 264–287. https://doi.org/10.1111/0017-4815.00113.
- Luo, X. S., C. Gan, and J. R. Ge. 2014. “Application of Ecological Building Materials in the External Layer Design for Building.” Advanced Materials Research 898:337–340. https://doi.org/10.4028/www.scientific.net/AMR.898.337.
- Maini, S., and V. Thautam 2013. Embodied Energy of Various Materials and Technologies. Unpublished work., Auroville Earth Institute.
- Manna, D., and S. Banerjee. 2019. “A Review on Green Building Movement in India.” International Journal of Scientific & Technology Research 8 (10): 1980–1986.
- Marans, R. W., and K. F. Spreckelmeyer. 1981. “Evaluating Built Environments: A Behavioral Approach.” (No Title).
- McCray, J. W., and S. S. Day. 1977. “Housing Values, Aspirations, and Satisfactions as Indicators of Housing Needs.” Home Economics Research Journal 5 (4): 244–254. https://doi.org/10.1177/1077727X7700500404.
- Michelson, W. 1977. Environment Choice, Human Behaviour, and Residential Satisfaction. Oxford, England: Oxford University Press.
- Ministère de la Transition Écologique. 2018. Améliorer le quotidien de tous les Français. Gouvernement : Ministère de la Transition Ecologique et de la Cohésion des territoires : Ministère de la Transition Ecologique. July 19. https://www.ecologie.gouv.fr/ameliorer-quotidien-tous-francais.
- Morris, E. W., and M. Winter. 1978. Housing, Family and Society. New Jersey, USA: John Wiley and Sons.
- Nish, M. N., and L. B. Chatelain. 1981. “Consumer Satisfaction with Pre-Built Homes.” Housing and Society 8 (1): 65–68. https://doi.org/10.1080/08882746.1981.11429863.
- OCDE. 2003. Pour des bâtiments écologiquement viables, enjeux et politiques. OECDilibrary. https://read.oecd-ilibrary.org/environment/pour-des-batiments-ecologiquement-viables_9789264034891-fr#page23.
- Oliver, R. L. 1989. “Processing of the Satisfaction Response in Consumption: A Suggested Framework and Research Propositions.” Journal of Consumer Satisfaction, Dissatisfaction and Complaining Behavior 2:1–16.
- Onibokun, A. G. 1974. “Evaluating consumers’ Satisfaction with Housing: An Application of a Systems Approach.” Journal of the American Institute of Planners 40 (3): 189–200. https://doi.org/10.1080/01944367408977468.
- Osgood, C. E., G. J. Suci, and P. H. Tannenbaum. 1957. The Measurement of Meaning (No. 47). Illinois, USA: University of Illinois press.
- Osgood, C. E., and P. H. Tannenbaum. 1955. “The Principle of Congruity in the Prediction of Attitude Change.” Psychological Review 62 (1): 42. https://doi.org/10.1037/h0048153.
- Oskamp, S. 2000. “A Sustainable Future for Humanity? How Can Psychology Help?” American Psychologist 55 (5): 496. https://doi.org/10.1037/0003-066X.55.5.496.
- Oskamp, S., and P. W. Schultz. 2005. Attitudes and Opinions. New York, USA: Psychology Press.
- Paris, D. E., and R. Kangari. 2005. “Multifamily Affordable Housing: Residential Satisfaction.” Journal of Performance of Constructed Facilities 19 (2): 138–145. https://doi.org/10.1061/(ASCE)0887-3828(2005)19:2(138).
- Parker, C., and B. P. Mathews. 2001. “Customer Satisfaction: Contrasting Academic and consumers’ Interpretations.” Marketing Intelligence & Planning 19 (1): 38–44. https://doi.org/10.1108/02634500110363790.
- Pellenbarg, P. H., and P. J. Van Steen. 2005. “Housing in the Netherlands. Spatial Variations in Availability, Price, Quality and Satisfaction.” Tijdschrift Voor Economische En Sociale Geografie 96 (5): 593. https://doi.org/10.1111/j.1467-9663.2005.00489.x.
- Peyton, R. M., S. Pitts, and R. H. Kamery. 2003. “Consumer Satisfaction/Dissatisfaction (CS/D): A Review of the Literature Prior to the 1990s.” In Allied Academies International Conference. Academy of Organizational Culture, Communications and Conflict. Proceedings, Las Vegas, USA (Vol. 8, No. 2, p. 41). Jordan Whitney Enterprises, Inc.
- Phillips, D. R., O. L. Siu, A. G. Yeh, and K. H. Cheng. 2005. “The Impacts of Dwelling Conditions on Older persons’ Psychological Well-Being in Hong Kong: The Mediating Role of Residential Satisfaction.” Social Science & Medicine 60 (12): 2785–2797. https://doi.org/10.1016/j.socscimed.2004.11.027.
- Potter, J. J., J. L. Chicoine, and K. E. Speicher. 2001. “Predicting Residential Satisfaction: A Comparative Case Study.” Architecture Program: Faculty Scholarly and Creative Activity 5. https://digitalcommons.unl.edu/arch_facultyschol/5.
- Reddy, B. V., and K. S. Jagadish. 2003. “Embodied Energy of Common and Alternative Building Materials and Technologies.” Energy and Buildings 35 (2): 129–137. https://doi.org/10.1016/S0378-7788(01)00141-4.
- Reddy, B. V., G. Leuzinger, and V. S. Sreeram. 2014. “Low Embodied Energy Cement Stabilised Rammed Earth Building—A Case Study.” Energy and Buildings 68:541–546. https://doi.org/10.1016/j.enbuild.2013.09.051.
- Riza, F. V., I. A. Rahman, and A. M. A. Zaidi. 2010. “A Brief Review of Compressed Stabilized Earth Brick (CSEB).” In 2010 International Conference on Science and Social Research (CSSR 2010), Kuala Lumpur, Malaysia, 999–1004. IEEE. https://doi.org/10.1109/CSSR.2010.5773936.
- Romano, N. C., Jr, C. Donovan, H. Chen, and J. F. Nunamaker Jr. 2003. “A Methodology for Analyzing Web-Based Qualitative Data.” Journal of Management Information Systems 19 (4): 213–246.
- Salleh, N. A., N. A. Yusof, A. G. Salleh, and N. Johari. 2011. “Tenant Satisfaction in Public Housing and Its Relationship with Rent Arrears: Majlis Bandaraya Ipoh, Perak, Malaysia.” International Journal of Trade, Economics and Finance 2 (1): 10. https://doi.org/10.7763/IJTEF.2011.V2.72.
- Schachter, J. 2001. Why People Move: Exploring the March 2000 Current Population Survey. Vol. 204. Maryland, USA: US Department of Commerce, Economics and Statistics Administration, Bureau of the Census.
- Schroeder, H. 2016. Sustainable Building with Earth, 1–576. New York, NY, USA: Springer International Publishing.
- Shadravan, S., M. D. Reyes, D. J. Butko, L. M. Holliday, K. R. Hines, and J. Huizar. 2017. “Sustainability of Compressed Earth Block Construction: Comparative Analysis of Compressed Stabilized Earth Blocks and Traditional Wood Framed Single Family Residences”. Aei 2017. 368–374. https://doi.org/10.1061/9780784480502.030.
- Sirgy, M. J., and T. Cornwell. 2002. “How Neighborhood Features Affect Quality of Life.” Social Indicators Research 59 (1): 79–114. https://doi.org/10.1023/A:1016021108513.
- Smith, T. W. 1987. “That Which We Call Welfare by Any Other Name Would Smell Sweeter an Analysis of the Impact of Question Wording on Response Patterns.” Public Opinion Quarterly 51 (1): 75–83. https://doi.org/10.1086/269015.
- Standard, A. S. T. M. 2016. “E2392/E2392M. 2016. Standard Guide for Design of Earthen Wall Building Systems.”
- Standard, I. 1993. “Improving Earthquake Resistance of Earthen Buildings-Guidelines.” Bureau of Indian Standards. https://law.resource.org/pub/in/bis/S03/is.13827.1993.pdf.
- Standard, I. 2013. “Stabilized Soil Blocks Used in General Building Construction-Specification.” https://www.services.bis.gov.in:8071/php/BIS/bisconnect/pow/is_details?IDS=NDQ4.
- Standards. n.d. https://rb.gy/awovu.
- Theodori, G. L. 2001. “Examining the Effects of Community Satisfaction and Attachment on Individual Well‐Being.” Rural Sociology 66 (4): 618–628. https://doi.org/10.1111/j.1549-0831.2001.tb00087.x.
- Tse, D. K., and P. C. Wilton. 1988. “Models of Consumer Satisfaction Formation: An Extension.” Journal of Marketing Research 25 (2): 204–212. https://doi.org/10.1177/002224378802500209.
- Turner, M. A. 2005. “Landscape Preferences and Patterns of Residential Development.” Journal of Urban Economics 57 (1): 19–54. https://doi.org/10.1016/j.jue.2004.08.005.
- Ukoha, O. M., and J. O. Beamish. 1997. “Assessment of residents’ Satisfaction with Public Housing in Abuja, Nigeria.” Habitat International 21 (4): 445–460. https://doi.org/10.1016/S0197-3975(97)00017-9.
- UN. 2022. Sustainable Development Goals Knowledge Platform: Climate Change. December. https://sustainabledevelopment.un.org/topics/climatechange.
- UN. 2023. Sustainable Development Goals: Goal 13: Take Urgent Action to Combat Climate Change and Its Impacts. September 11. https://www.un.org/sustainabledevelopment/climate-change/.
- Varady, D. P., and M. A. Carrozza. 2000. “Toward a Better Way to Measure Customer Satisfaction Levels in Public Housing: A Report from Cincinnati.” Housing Studies 15 (6): 797–825. https://doi.org/10.1080/02673030020002555.
- Varady, D. P., C. C. Walker, and X. Wang. 2001. “Voucher Recipient Achievement of Improved Housing Conditions in the US: Do Moving Distance and Relocation Services Matter?” Urban Studies 38 (8): 1273–1304. https://doi.org/10.1080/00420980124918.
- Wang, L., S. Nagarajaiah, W. Shi, and Y. Zhou. 2022. “Seismic Performance Improvement of Base-Isolated Structures Using a Semi-Active Tuned Mass Damper.” Engineering Structures 271:114963. https://doi.org/10.1016/j.engstruct.2022.114963.
- Wang, L., Y. Zhou, S. Nagarajaiah, and W. Shi. 2023. “Bi-Directional Semi-Active Tuned Mass Damper for Torsional Asymmetric Structural Seismic Response Control.” Engineering Structures 294:116744. https://doi.org/10.1016/j.engstruct.2023.116744.
- Wang, L. K., Y. Zhou, and W. X. Shi. 2023. “Seismic Response Control of a Nonlinear Tall Building Under Mainshock-Aftershock Sequences Using Semi-Active Tuned Mass Damper.” International Journal of Structural Stability and Dynamics. https://doi.org/10.1142/S0219455423400278.
- Wang, L., Y. Zhou, and W. Shi. 2023. “Seismic Control of a Smart Structure with Semiactive Tuned Mass Damper and Adaptive Stiffness Property.” Earthquake Engineering and Resilience 2 (1): 74–93. https://doi.org/10.1002/eer2.38.
- Weidemann, S., J. R. Anderson, D. I. Butterfield, and P. M. O’Donnell. 1982. “Residents’ Perceptions of Satisfaction and Safety: A Basis for Change in Multifamily Housing.” Environment and Behavior 14 (6): 695–724. https://doi.org/10.1177/0013916582146004.
- Yang, S., and Y. Zhu. 2006. “Customer Satisfaction Theory Applied in the Housing Industry: An Empirical Study of Low-Priced Housing in Beijing.” Tsinghua Science and Technology 11 (6): 667–674. https://doi.org/10.1016/S1007-0214(06)70249-8.
- Zhang, H., L. Wang, and W. Shi. 2023. “Seismic Control of Adaptive Variable Stiffness Intelligent Structures Using Fuzzy Control Strategy Combined with LSTM.” Journal of Building Engineering 78:107549. https://doi.org/10.1016/j.jobe.2023.107549.