
 ?Mathematical formulae have been encoded as MathML and are displayed in this HTML version using MathJax in order to improve their display. Uncheck the box to turn MathJax off. This feature requires Javascript. Click on a formula to zoom.
ABSTRACT
While implementing a construction project, production-rate assessment needs to be conducted throughout the different stages of the project because this assessment can determine the success or failure of the project. In South Korea, the construction-standard-production-rate (CSPR) is used for determining the production-rate of individual construction equipment. However, CSPR cannot provide the production-rate of activities considering a combination of more than two different types of equipment (eg, excavator and dump truck used for excavation-load-haul activities). Having ready-made data on such production-rates of different equipment combinations would be beneficial for determining and optimal fleet management plan. Furthermore, such data can be beneficial for implementing optimized scheduling methods using supervised-learning methods. Accordingly, simple discrete event simulation approaches were carried out for data generation and regression analysis for testing the feasibility of the usage of such data. The time inputs used in this study were calculated based on the equations and information given in the CSPR.
1. Introduction
1.1. Background
To implement a construction project successfully, it is necessary to conduct data-based process planning in consideration of the constantly changing conditions and environments of the construction site (Han, Lee, and Ko Citation2014). In particular, large-scale construction projects, which are mainly comprised of processes using various construction equipment, derivation of the optimal equipment combination information based on the site conditions is one of the crucial factors that have a significant impact on the construction duration and costs (Han et al. Citation2006). Production-rate data required for process planning is extracted based on the construction-standard-production-rates (CSPR) for construction projects in South Korea and RS Means in the United States (Jung et al. Citation2009; Oh, Song, and An Citation2020). CSPR which has been widely used, especially in public construction projects, is standardized data that can estimate productivity and reflect it in construction costs. Recently, various efforts have been made centering on the academic world to implement realistic and reliable CSPR (Kim et al. Citation2023, Ko et al. Citation2023; Kim et al. Citation2022). As such process planning is conducted based on the production-rate information of representative equipment used in the target activity. These methods have some limitations in determining optimal fleet management due to their characteristics of providing production-rate calculation equations for individual equipment and not as a combination. Large-scale construction projects are generally performed by a combination of various types of equipment, and generation of accurate process plans requires the analysis and extraction of production-rate of an equipment combination, instead of viewing equipment only as individual tools. This statement is justified by the existence of work efficiency that is used in different studies that use queuing models (Ahn, Kim, and Lee Citation2016; Halpin and Riggs Citation1992; Lim and Kim Citation2020). Having a ready-made data set of different production-rate of equipment combination would be beneficial to both practitioners and researchers in this field to be used in cost and duration optimized scheduling. This paper is part of a preliminary stage of ongoing research that uses reinforced learning methods for automated scheduling in given situations. For this purpose, an objective dataset must be generated. The purpose of this study is to suggest a production-rate dataset generation method using discrete event simulation method that can be used for practitioners in South Korea and researchers in this field that require such datasets for training artificial intelligence models.
1.2. Materials and methods
In the present study, road construction, the most general type of construction among large-scale construction projects, was selected as the research target. With respect to representative processes that are generally conducted in most road construction projects with a relatively large amount of repetitive work were selected among 44 types of representative processes presented by Kim et al. (Citation2009) (Kim et al. Citation2009). To collect related data, interviews with nine site managers of road construction projects were conducted from February to March 2021, to collect information on the representative processes. The processes suggested in were then selected as targets for implementing the suggested methodology.
Table 1. Target processes used to implement the suggested methodology.
DES (Discrete Event Simulation) models for the representative processes shown in are conducted, based on the video data collected at the construction sites where construction was carried out. To calculate the time required for each of the main activities of the DES model, relevant information on the production rate of equipment were deduced from the CSPR as running a DES model necessitates specialized modeling knowledge and time-consuming tasks such as the identification of processes, data collection, and simulation modeling. CSPR provides valuable information on equipment production-rate. Accordingly, this paper suggests a method that uses such information to calculate activity times that can serve as inputs in DES models. The production-rate dataset was then created by conducting a sensitivity analysis on the number of equipment used in each model. shows a schematic of the methods and procedures used in this study.
Figure 1. Research methods and procedures.
2. Literature review
As stated above, the purpose of this study is to generate a production-rate dataset for training an automated scheduling algorithm using reinforcement learning. Such algorithms demand datasets that the algorithm must be fed on. According to previous studies, simulation techniques can serve as an efficient tool for generating such datasets (Alvanchi et al. Citation2012; Kim Citation2012; Kim et al. Citation2021; Labban et al. Citation2013; Lee Citation2010, Citation2011; Lu Citation2003; Martinez Citation2010; Mostafa, Chileshe, and Abdelhamid Citation2016; Zankoul, Khoury, and Awwad Citation2015; Shihyi and Halpin Citation2004). Simulation techniques differ by the type of modeling methods mainly in three terms known as DES (Discrete Event Simulation), ABM (Agent-Based Modeling) and SD (System Dynamics). Simulation techniques, however, are exposed to some limitations in practical application by the fact that they necessitate specialized modeling knowledge and time-consuming tasks such as the identification of processes, data collection, and simulation modeling (AbouRizk Citation2010). For this matter, existing studies using the above methods in the field of construction process management are reviewed. Studies based on a construction simulation method have been mostly conducted based on Halpin and Woodhead (Citation1976) (Halpin and Woodhead Citation1976). This simulation technique has been demonstrated as an excellent assisting tool used in decision-making by various studies (Azimi et al. Citation2011; Chen, Chen, and Chang Citation2012). In addition, AbouRizk (Citation2010) pointed out that, although research based on simulation techniques had a substantial ripple effect on the academic community, a sufficient linkage between such research and practice has not been identified (AbouRizk Citation2010). This is primarily because the use of simulation technology requires specialized knowledge of and familiarity with modeling, coding, data collection, and analysis, and utilization of results (Halpin and Riggs Citation1992, Wang and Halpin Citation2004; Han, Lee, and Ko Citation2014; Labban et al. Citation2013). However, simulations have been shown to be very effective for process analysis and derivation of productivity data. In this regard, Kim et al. (Citation2021) employed the simulation technique to conduct an analysis of the validity of COVID-19 response guidelines. In addition, Han et al. (Citation2006) conducted a study on improving productivity and reducing costs by the application of GPS technology and compared its performance to that of existing methods (Han et al. Citation2006). Meanwhile, Labban et al. (Citation2013) suggested simulation modeling methodology requiring minimal specialized knowledge on simulation in relation to pavement construction (Labban et al. Citation2013). Further, Lee (Citation2010) conducted a study to evaluate the site applicability of a new construction technology using a simulation technique (Lee Citation2010). As described above, simulation has been employed mainly in studies where a comparative analysis between existing methods and a new method is conducted. However, research using a simulation technique to construct a database of productivity information, as in the present study, has been carried out only under limited conditions, as shown by Han et al. (Citation2008) and Han et al. (Citation2014).
Previous studies dealing with the measurement of production-rates using simulation-based approaches are reviewed. Ma et al. (Citation2016) conducted a study to identify the convergence frontier of construction labor productivity across the regions New South Wales; the Australian Capital Territory; Northern Territory, Queensland, and Western Australia; South Australia; and Tasmania and Victoria in Australia (Ma, Liu, and Mills Citation2016). Grau et al. (Citation2009) conducted a study on developing a labor productivity model based on multilayer feedforward neural networks that correspond to the factors affecting labor productivity (Grau et al. Citation2009). Oral and Oral (Citation2010) implemented the concepts of lean construction into discrete event and continuous simulation approaches and proposed a method to increase the productivity of a modular construction element (Oral and Oral Citation2010).
Previous studies dealing with developing information database for planning were also reviewed.
Chen et al. (Citation2013) proposed a methodology for automatic database management that enables the effective management of construction data in order to facilitate the linkage of construction data with building information modeling (BIM) (Chen, Chen, and Chang Citation2013). The study claims that a database constructed through the proposed methodology will generate optimal process plans. Meanwhile, Markiz and Ahmad (Citation2017) proposed a method for optimizing the costs of equipment used for earthworks in a dam construction project by means of a probabilistic method (Markiz and Jrade Citation2017). More specifically, the study suggests a method based on the line-of-balance (LOB) technique that allows users to derive the optimal equipment combination. In addition, Batselier and Mario (Citation2015) constructed a cost database considering various conditions of construction projects. Database construction takes into consideration the user’s convenience, does not need professional knowledge, and is a very effective method in terms of site applicability. In particular, Batselier and Mario (Citation2015) concluded that the construction of a database enables efficient comparisons between the construction plan and performance and that the data would greatly inform future tasks in the field of construction management (Batselier and Vanhoucke Citation2015).
Recent studies using ABM (Agent-Based Modeling) are also reviewed. ABM is a simulation and modeling technique that has emerged with the advancements of computers (Klügl and Bazzan Citation2012). In ABM modeling, the entities composing the model have their own behaviors or decision-making. Using this feature, numerous studies were conducted in the construction process management field. Details and fundamentals of ABM are well presented in the study of Macal and North (Citation2008) (Macal and North Citation2008). Mahjoubpour et al. (Citation2018) implied ABM models to investigate the learning behavior of workers and assessed the effect of interactions among different workers (Mahjoubpour et al. Citation2018). Kiomjian, Srour, and Srour (Citation2020) also assessed the learning curve of 12 construction workers using field observations of 201 interactions (Kiomjian, Srour, and Srour Citation2020. Wu (Citation2019) has combined SD (System Dynamics) and ABM to assess the behavior of multi-type laborers and have found that the causes of project deviations can be analyzed from the perspective of multi-type laborers behavioral diversities and its optimization can significantly improve productivity (Wu et al. Citation2019).
SD is also a powerful simulation tool that is used in the construction field. However, SD was studied and it was concluded that it is an efficient tool for quantifying outer effects on the analysis target. As conducted by Khanzadi et al. (Citation2017) and Al-Kofahi et al. (Citation2022), the effect of contract change, motivation, rework, employer satisfaction, and delay in salary payment on labor productivity was quantitatively assessed (Khanzadi et al. Citation2017; Al-Kofahi et al. Citation2022). As stated above, ABM and SD are used in more sophisticated approaches than conventional DES approaches in the construction management field. Studies using ABM and SD have shown that the methods can successfully be used for quantifying the effects of outer agents or conditions and also interactions. DES has its advantages in ease of modeling compared to ABM and SD and the input data is relatively easy to assess. Due to these reasons, this study carries out a DES approach for generating the required production-rate dataset in the given conditions that can be deduced from the CSPR.
3. Data collection
3.1. On-site construction process data
To apply the research method, the specific work management units of the three representative processes selected were investigated as shown in . In particular, interviews with site managers were conducted and video data of representative processes were collected by visiting the sites of national highways that have a starting point in Gwaneum-dong, Buk-gu, Daegu Metropolitan City, in Osan-ri, Jicheon-myeon, Chilgok-gun, North Gyeongsang Province, in Hagum-ri, Daebyeong-myeon, Hapcheon-gun, South Gyeongsang Province, and in Jingok-dong, Gwangsan-gu, Gwangju Metropolitan City. In earthwork, excavation work comprises soil excavation, which is achieved with excavation equipment, soil hauling, which is achieved using hauling equipment, and loading, which is accomplished with loading and hauling equipment. The filling work in earthwork consists of soil hauling, soil spreading, and soil compacting work, which are achieved with hauling equipment, spreading equipment, and compacting equipment, respectively. Asphalt paving work consists of mixture hauling work, asphalt paving work, and asphalt compacting work, which are achieved with hauling equipment, by hauling and paving equipment, and compacting equipment, respectively. show schematics of the main activities of representative processes. As shown in , the processes are performed through repeated activities depending on the characteristics of the equipment, and such repetitive activities are expressed as cycles in a simulation model. To conduct simulation modeling, work processes and cycles for simulation modeling need to be clearly defined, and the time required for each specific activity needs to be set as an input. The work processes of representative construction processes, which are the targets of the simulation modeling of this study, were derived through interviews as well as by taking photographs and video footage of the work processes in the field. The simulation model generates the production-rate information of the total processes composed of multiple cycles, based on the data of the input values of the time required for each cycle. To set the input values of the simulation model, the time required for each of the main activities was calculated based on the production capacity of the equipment and production-rate of the process presented in the CSPR.
Figure 2. Cycle of cutting work.
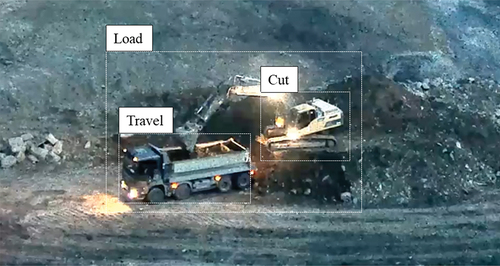
Figure 3. Cycle of filling work.
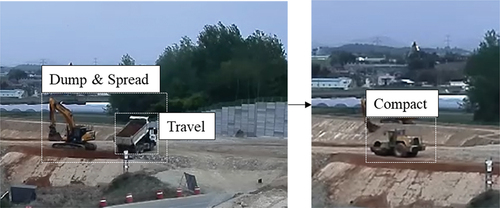
Figure 4. Cycle of asphalt paving work.

3.2. Construction-standard-production-rate (CSPR)
In large-scale construction projects, process planning is an important factor that may determine the success of the entire construction project (Batselier and Vanhoucke Citation2015; Cho, Lee, and Shin Citation2020; Cho, Russell, and Choi Citation2013). In domestic construction projects, the CSPR is used for process planning. The CSPR is defined as follows by the Korea Information & Communication Industry Institute: “standard references that numerically represent the amount of labor and equipment operating time required for each activity based on the representative and general construction processes and construction techniques used in the construction of facilities” (Korea Institute of Civil Engineering and Building Technology Citation2021). According to Son, Hong, and Kim (Citation2010), the CSPR provides the specification and operating time of construction equipment required for the work required per unit quantity for each item (Son, Hong, and Kim Citation2010). To perform a simulation compilation, the time required for each of the main activities shown in needs to be entered as an input value. The time required for each of the main activities can be calculated based on the equipment production-rate formula and production-rate presented in the CSPR. Based on the contents of the CSPR, the time required for each of the main activities of the representative processes is calculated as follows.
The time required for each cycle was extracted using the production-rate formulas by analyzing the production-rate formulas for the excavator, dump truck and roller, which are the pieces of equipment used in the three previously classified construction processes. If the unit of production-rate is (hourly production-rate), the unit of cycle production-rate
is calculated according to the specifications of the piece of equipment, and the time required for each cycle is extracted. The time required for each cycle is obtained using equation (1). As shown in equation (1), to make the simulation model smoothly reflect the time required, the production-rate per minute was applied by converting the hourly production-rate into the production-rate per minute.
where, is the time required for conducting 1 cycle
is the amount of work done in 1 cycle
is the amount of work done in 1 hour
EquationEquation (1)(1)
(1) is applied to the equipment production-rate calculation in the next section and the chapter on simulation modeling. In EquationEquation 1
(1)
(1) ), hourly production-rate is calculated using the CSPR, and cycle production-rate is defined as the amount of soil or asphalt moved by dump trucks through a cycle of the relevant representative process. The loading capacity of the dump truck was set as
for a
truck, which is mainly used in the field, and
for a
truck. Furthermore, in the case of dump trucks hauling asphalt, considering the volume conversion of the CSPR, the loading capacity of the dump truck was set as
for a
truck and
for a
truck.
3.2.1. Earthwork
The proposed methodology is applied to soil excavation and filling operations. Therefore, the relevant information in the CSPR was extracted as follows: As shown in , the main pieces of equipment for soil excavation are the dump truck and excavator. According to the CSPR, the production-rate of the excavator is determined using equation (2).
where, is the hourly production-rate
is the bucket capacity
is the bucket coefficient
is the swell factor
is the work efficiency
is the time required for loading an amount of one bucket
The production-rate of the excavator according to various site conditions can be calculated using EquationEquation (2)(2)
(2) . In this study, to conduct simulation modeling for the general conditions of representative processes, production-rate was extracted by substituting general values derived through interviews in the field for some variables of EquationEquation (2)
(2)
(2) provided by the CSPR. Thus, variables were set as shown in , and the value of the excavator bucket capacity (
) mainly used in excavation was set as
and
.
Table 2. Excavator production-rate parameters.
As shown in , as the swell factor () of clay was presented as 0.85–0.95 in the CSPR, the median value of 0.9 was used. For the work efficiency (
), the value of 0.65 was used considering a normal not-compacted state of soil mixed with gravel and cohesive soil. For the bucket coefficient (
), the value of 0.9 was used, and this value corresponds to the cases of sand, normal soil, and clay in a good condition that have a slightly hard soil quality and can fill a bucket almost completely.
A dump truck is a piece of equipment that is essentially required for excavation, filling, and asphalt paving, which are the three processes that were selected to apply the methodology proposed in this study. The production-rate of dump trucks can also be calculated using the CSPR. In this study, the optimal number of dump trucks was determined by performing a simulation for the scenario where the production-rate of the three selected construction processes is affected by the number of dump trucks. Thus, in terms of related information, we referred to the average driving speeds of loaded and empty dump trucks depending on the haul road condition and the average driving speed to calculate the production-rate of a dump truck. To derive the time required for the work of a dump truck, we refer to the production-rate formula in the CSPR as shown in Equationequation (3)(3)
(3) . In Equationequation (3)
(3)
(3) , the time required for one cycle or cycle time (
) is calculated by obtaining the sum of the round-trip time, loading time, time for the installation and removal of the truck loading box, and time required for passing through the wheel wash. A maximum value of
was used as the input value of cycle time based on the characteristics of activities performed in the field as well as the fact that the difference between the maximum and minimum values was less than
in all the variables other than round-trip time. Therefore, the production-rate formula for cycle time (
) used in this study is expressed as Equationequation (4)
(4)
(4) . In addition, regarding the hauling speed of dump trucks, the average driving speeds of loaded and empty dump trucks were calculated by dividing the road condition into three types by referring to the haul road and average normal driving speed parts of the CSPR. The hauling speeds of dump trucks were classified as shown in .
Table 3. Average dump truck hauling speeds for different road conditions ().
where is the hourly production-rate
is the swell factor
is the work efficiency
is the time required for hauling
is the load capacity of a truck
is the load amount of a truck for soil in a natural condition
is the volume conversion coefficient for the swell factor
The information on the filling process was extracted based on the CSPR in the same manner as in the extraction of the information on the excavation process. As shown in , the main equipments used for the filling process consist of the dump truck, excavator, and roller. For the CSPR, the production-rate of the roller is calculated using equation (5).
where, is the hourly production-rate
is the compacting speed
is the work width of the roller
is the thickness of the spread soil
is the swell factor
is the work efficiency
is the number of compacting cycles
The production-rate of the roller under various site conditions can be calculated using EquationEquation (5)(5)
(5) . As in the process of calculating the production-rate of the excavator, the production-rate of the roller was extracted by substituting general values for simulation modeling for general conditions. Accordingly, the variables were set as shown in , and production-rate was calculated based on a
roller generally used in filling.
Table 4. Roller production-rate parameters.
As shown in , to calculate the production-rate of the roller, the value of the compaction velocity () was set as
, which is the standard subgrade soil compaction velocity of a 10-ton vibrating roller compactor. The work width of a 10-ton vibrating roller was
, and the depth of subgrade soil was set as
, which is the general depth of subgrade soil. As for the work efficiency (
), as the work is performed in a relatively unfavorable environment compared to paving, 0.4 was considered as the value of work efficiency. The swell factor was calculated by considering the quality of soil and sand, and the value of 0.808 was obtained and applied to the production-rate formula. The total number of compacting cycles is set as six, which corresponds to the 90% or higher compacting degree of a
vibrating roller.
3.2.2. Asphalt paving
The time required for the asphalt paving process was calculated based on the work of the dump truck, finisher, and roller, as shown in . As the production-rate formula for the finisher is not provided by the CSPR, the total production-rate of construction of the base course of asphalt pavement was estimated by calculating the hourly production-rate, which was determined in consideration of as shown in . In this regard, as the unit of hourly production-rate needs to be matched with the units of hourly production-rate of other types of equipment in order to unify the units of time required for the total production-rate values of all activities, the unit of production-rate was unified as
, which is the unit of the production-rate of other types of equipment, by multiplying the value of production-rate given in unit of
by the lift thickness (
). In addition, as the paving thickness of a layer is given as a range of values, the average value of each range is used to calculate the hourly production-rate.
Table 5. Asphalt base layer paving using heavy equipment.
4. Simulation modeling
This chapter deals with the details of simulation modeling, setting input values, and simulation results for the three representative construction processes studied in this study. Based on the production-rate calculated by the CSPR, the simulation analysis for each representative process is separately described.
4.1. Cut-haul activity in earthwork
The cut-haul activity of earthwork construction presented in this study is composed of cycles of activities using the excavator and the dump truck, and the specific activities constituting the excavation process are excavation work by the most commonly used excavator, loading of soil into a dump truck, depositing of soil by the dump truck, and the return of the dump truck. shows the work processes, and simulation modeling was performed using Web-Cyclone based on the DES technology (Halpin and Riggs Citation1992). shows a process model of cut-haul work for the application of web-cyclone modeling. In , the excavate, load, and travel nodes correspond to specific activities comprising the excavation activity. As the time required for each activity needs to be input, the required time calculated based on the CSPR is calculated using EquationEquation (1)(1)
(1) , and the details of this calculation process are presented in . The time required for excavation work can be calculated using the production-rate of the excavator and the amount of work per cycle. The production-rate of the excavator can be calculated using EquationEquation (2).
(2)
(2) In EquationEquation (2)
(2)
(2) , if cycle production-rate is defined as the load amount of a dump truck, the time required per cycle of excavation work can be calculated using EquationEquation (1)
(1)
(1) . The time required for loading was entered based on on-site measurement data. The time required for hauling can be calculated using the haul distance based on the average driving speeds of loaded and empty dump trucks. At this time, for the driving speed of dump trucks, the average speed according to the road condition in is used.
Figure 5. Web-cyclone model of the cut-haul work.
Table 6. Cut-haul activity time calculation.
4.2. Haul-fill-spread-compact in earthwork
The Haul-Fill-Spread-Compact activity in earthwork is composed of cycles of activities performed using a dump truck and roller, and specific activities involved in filling work are soil hauling by the most commonly used dump trucks and compacting by the roller. shows the DES model of Haul-Fill-Spread-Compact work. During Haul-Fill-Spread-Compact work, soil spreading by the motor grader and water spraying by the water sprinkler truck are performed. However, in this study, simulation modeling was performed by assuming that activities using the roller and the dump truck have the greatest impact on production-rate. Thus, soil dumping, soil spreading, and water spraying during each cycle were considered together as a single activity, and the time required for this activity for the load amount of a dump truck was set as 5 min. As in the case of excavation work, the time required for filling work is calculated using EquationEquation (1)(1)
(1) by referring to the CSPR, and details regarding this calculation are presented in . The time required for hauling was determined in the same manner as in the case of excavation. The time required for compacting per cycle can be calculated using EquationEquation (1)
(1)
(1) .
Figure 6. Web-cyclone model of the haul-Fill-Spread-Compact work.
Table 7. Haul-Fill-Spread-Compact activity time calculation.
4.3. Asphalt base layer paving
The paving of base layers in asphalt pavement work is composed of cycles of activities performed with a dump truck and roller, and the specific activities involved are asphalt hauling by the most commonly used dump truck and compacting by the roller. shows the DES model of the asphalt base layer paving work. During paving work, asphalt spreading by the finisher and the dump truck is performed before compacting work by the roller. In addition, compacting is generally performed by three types of rollers with different specifications. In this study, simulation modeling was performed under the assumption that activities using the roller and dump truck have the greatest impact on production-rate. Accordingly, for the asphalt spreading activity performed by the dump truck and finisher, the required time per cycle for the load amount of a dump truck was set as . The time required for the compacting activity can be calculated by using the production-rate information shown in and EquationEquation (1)
(1)
(1) .
Figure 7. Web-cyclone model of the asphalt base layer paving work.
Based on the time required for each activity shown in , production-rate information under various conditions can be generated through simulation modeling. In particular, to derive the optimal combinations of equipment, production-rate information for various conditions can be derived through simulation modeling.
Table 8. Asphalt base layer paving work activity time calculation.
5. Results and discussion
Various construction scenarios can be envisioned based on the simulation modeling method proposed in this study, and the optimal combinations of equipment for the postulated scenarios can be derived. To perform simulation modeling, construction scenarios for representative processes were postulated based on the equipment with general specifications used in representative processes collected through interviews in the field, as shown in . The time required for each specific activity was extracted using image data secured by visiting construction sites and the equations provided by the CSPR. In particular, for activities for which equations are provided by the CSPR, deterministic values were used to calculate the time required for each activity. For activities for which equations are not provided by the CSPR, the actual time required was measured using video data taken in the field, and stochastic values were used to enter the time required for each activity into the DES model. For each representative process, regarding the common variables used in postulating scenarios, it was assumed that the activity of hauling materials is performed by using a highway with a distance of , a
dump truck (load capacity:
), and the excavator bucket size of
. The above variables can be modified based on the equations and tables in Section 3.
Table 9. Cut-haul activity time.
Table 10. Haul-Fill-Spread-Compact activity time.
Table 11. Asphalt base layer paving activity time.
5.1. Excavation in earthwork
Based on the contents of simulation modeling described above, the scenario of excavation in earthwork was postulated based on the processes shown in . The time required for the excavation activity was calculated using EquationEquations (1(1)
(1) ) and (Equation2
(2)
(2) ). For the time required for the loading activity, the on-site measured value was used as the input value. The time required for the hauling activity was extracted using EquationEquation (4)
(4)
(4) based on . Based on the variables set for the scenario of the excavation process in earthwork, the time required for each activity was set as shown in .
shows the results of the production-rate prediction for combinations of several dump trucks with one excavator based on the conditions in .
Figure 8. Productivities of combinations of dump trucks and an excavator.
As shown in , the optimal equipment combination for the relevant activity was found to be six dump trucks per excavator. In addition, validation of the adequacy of the analysis results on production-rate was conducted using the mean absolute percentage error (MAPE) through a comparison with the CSPR. MAPE is calculated using equation (6). After setting the environmental condition by dividing the haul distance in units of in a highway environment with the haul distance ranging from
to
, MAPE was computed for 10 scenarios where the excavator bucket size was set as
and the load capacity of a dump truck was set as
(a
truck). A MAPE value of 1.77% (prediction accuracy of 98.23%) was obtained.
where, is the mean absolute percentage error
is the number of samples
is the
actual value
is the
predicted value
5.2. Haul-fill-spread-compact activity in earthwork
As in the extraction of information on the cut-haul process in earthwork, variables are set based on the processes shown in . The time required for the compacting activity was calculated using EquationEquations (1(1)
(1) ) and (Equation5
(5)
(5) ). For the time required for each of the dumping, spreading, and water spraying activities, on-site measured values were used as input values. The time required for hauling activity is extracted using EquationEquation (4)
(4)
(4) , based on . At this time, the time required was calculated by setting the work width of
and the compaction depth of
for a
roller as variables. The calculation results obtained by setting the variables as described above are shown in . shows the results of production-rate prediction by the combination of several dump trucks with one roller based on the conditions in .
Figure 9. Productivities of combinations of dump trucks and a roller.
As shown in , the optimal equipment combination for the relevant scenario was six dump trucks per excavator. In addition, validation of the adequacy of the results on production-rate was conducted using MAPE through a comparison with the CSPR. MAPE is obtained using EquationEquation (6)(6)
(6) . More specifically, after setting the environmental condition by dividing the haul distance in units of
in a highway environment, with a haul distance ranging from
to
, MAPE was calculated for 10 scenarios where the excavator bucket size was set as
and the load capacity of a dump truck was set as
(a
truck). A MAPE value of 1.10% (prediction accuracy of 98.90%) was obtained.
5.3. Asphalt base layer paving
With respect to the construction of the base course of the asphalt pavement, variables were set based on the processes presented in . The time required for compaction activity is calculated using EquationEquation (1)(1)
(1) and . For the time required for the spreading activity, the on-site measured value was used as the input value. The time required for the hauling activity is extracted using EquationEquation (4)
(4)
(4) based on . Additionally, the construction width higher than
and the lift thickness of
were set as the variables. shows the calculation results of the time required when the variables are set as described above. shows the production-rate predictions for various combinations of multiple dump trucks with one roller, based on the conditions in . It should be noted that in the model proposed in this study, three types of rollers (macadam, tire, and tandem rollers) used in the construction of the base course were regarded as a single type of equipment in modeling and the time required for the activity of the rollers was entered accordingly.
Figure 10. Productivities of combinations of dump trucks and a roller (asphalt).
As shown in , for the filling scenario, the optimal equipment combination was found to be four dump trucks per roller. In addition, through a comparison with the CSPR, validation of the adequacy of the production-rate results was conducted using MAPE, which is estimated using EquationEquation (6)(6)
(6) . For a highway environment where the hauling distance varies from
to
, the road condition was set by dividing the hauling distance in units of
. For 10 scenarios where the loading capacity of the dump truck was set as
(25.5 ton), MAPE was calculated as 0.70% (prediction accuracy of 99.30%). By deriving an optimal equipment combination based on the scenario with the variables set above, appropriate errors between the DES operation results and the production-rate values of representative CSPR equipment were obtained: 1.77% for soil excavation, 1.10% for soil filling, and 0.7% for base layer construction.
5.4. Verification of the proposed method
The simulation models for the representative processes presented in this study were tested with a case study shown in chapters 5.1 to 5.3. Yet a verification of the method is provided in this chapter. As stated by Heravi and Ehsan (Citation2015), Artificial Intelligence (AI) technology can overcome limitations of current methods that are time-consuming for a person. The production-rate database can reflect various conditions of the job-site. In order to provide reliability to such databases a verification process must be conducted. In this study, the verification of the proposed data is conducted by implementing multiple regression. The features taken from the results of multiple regression are ANOVA (analysis of variance), and adjusted
. Multiple regression is implemented by setting the productivity as the dependent variable and the rest of the data (condition data such as: bucket size, dump truck capacity, hauling distance, road conditions, number of excavators, number of dump trucks). The coefficient of determination (
) of the regression analysis model expressed by equation (8) was calculated to be 0.902, and the adjusted
coefficient of determination was calculated to be 0.885. In addition, an analysis of variance (ANOVA) indicated that the regression model was statistically significant at a significance level of 0.05 (
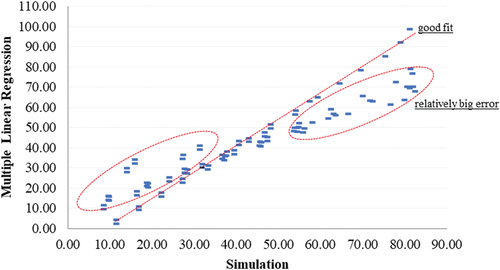
). shows the scatter plot of production-rate data derived through simulation and the regression model. Although the regression model was shown to have a high coefficient of determination, the scatter plot shows a few data points where a large error occurs. Such errors in data analysis can be addressed through various machine learning and AI techniques, which will be applied in a follow-up study in the future. Therefore, if data based on various scenarios is continuously generated and a production-rate prediction model is constructed through AI learning of the data, this production-rate prediction model will allow us to overcome the limitations of the CSPR and present a sufficiently reliable process planning methodology for construction projects.
Figure 11. Scatter plot of the simulation and multiple regression results.
The coefficient of determination () of the regression model expressed by equation (8) was calculated to be 0.902, and the adjusted coefficient of determination was calculated to be 0.885. In addition, an analysis of variance (ANOVA) indicated that the regression model was statistically significant at a significance level of 0.05 (
). shows the scatter plot of production-rate data derived through simulation and the regression model. Although the regression model was shown to have a high coefficient of determination, the scatter plot shows a few data points where a large error occurs. Such errors in data analysis can be addressed through various machine learning and AI techniques, which will be applied in a follow-up study in the future. Therefore, if data based on various scenarios is continuously generated and a production-rate prediction model is constructed through AI learning of the data, this production-rate prediction model will allow us to overcome the limitations of the CSPR and present a sufficiently reliable process planning methodology for construction projects.
6. Conclusion
Simulation technique has been perceived as a useful tool for process management and analysis, it has limitations in terms of data collection and securing reliability. Thus, the present study uses CSPR data to develop a DES simulation model, whose reliability is dependent on the quality of the CSPR data. CSPR has been continuously improved, and research on methods for improving it has been ongoing (Kim, Shin, and Son Citation2011; Kim and Baik Citation2015; Lee and Son Citation2011). This study suggests a methodology based on the DES technique for deriving production-rate information and the optimal combinations of equipment for representative processes to ensure accurate process planning. To perform simulation modeling, modeling of representative construction processes was conducted based on on-site measurement data, and the DES simulation was performed based on the data of the CSPR to consider various conditions and environments. The optimal equipment combination was derived by setting scenarios for the three representative processes of soil excavation, soil filling, and base layer construction, and adequacy analysis was performed through a comparative analysis using MAPE. This comparative analysis resulted in the construction of a database with the following levels of prediction accuracy: 84.75% for excavation, 64.8% for filling, and 83.3% for base course laying. In addition, we derive a regression model that allows users to easily derive results on production-rate based on the obtained data. Regarding the explanatory power of the regression model, the coefficient of determination () was calculated as 0.902, and the adjusted coefficient of determination (
) was calculated as 0.885; however, the prediction accuracy of the regression model needs to be enhanced through further research.
Compared to existing methods, the proposed method may contribute to establishing more accurate process plans for various scenarios with uncertain situations when a construction progress schedule is being created. In addition, although this study aims to extract production-rate information, production-rate information can be immediately converted into costs by linking the extracted combinations of equipment with price information. Therefore, the method proposed in this study may be used in cost-effective process planning depending on the project contract method. In the case of civil works projects in Korea, in the stage of process planning, project duration is estimated by calculating production-rate based on one type of representative equipment used for the construction process by means of the CSPR. As described above, as this method requires deriving the optimal equipment combination through trial and error in the construction stage, it is a time-consuming and expensive approach. Moreover, in some cases, such a technique may lead to an increase in construction costs. The current study considers only the optimal number of equipment that are involved in each target process. In future studies, the changes due to new equipment usage must be considered. If this methodology is linked with cost information through further research in the future, it will become expansively applicable to public construction projects that need to be implemented within a given budget.
Disclosure statement
No potential conflict of interest was reported by the authors.
Additional information
Funding
Notes on contributors
Yongho Ko
Yongho Ko. He is a PhD student at the Department of Architectural Engineering at INHA University. His primary research areas include simulation-based productivity prediction and construction productivity.
Yujin Kim
Yujin Kim. She is a Master candidate who graduated the Department of Architectural Engineering at INHA University. His primary research areas include simulation-based productivity prediction and construction productivity.
Jaeyun Noh
Jaeyun Noh. She is a Master student at the Department of Architectural Engineering at INHA University. His primary research areas include simulation-based productivity prediction and construction productivity.
Kanghyeok Lee
Kanghyeok Lee. He is a senior researcher at Center for Smart Construction Technology, Korea Expressway Corporation. He received his Ph.D. in “Program in Smart City Engineering” from Inha University in 2021 with the dissertation title of “Damage Detection for Bridges Using Unsupervised Deep Learning”. His research interests include artificial intelligence, deep learning, structural health monitoring (SHM), statistical anlaysis, and construction management.
Dohyoung Shin
Dohyoung Shin. He is a professor at the Department of Civil Engineering at INHA University. He was granted with his PhD degree from Purdue Univ. at 2007.08. His main research areas include sensors based damage detection and monitoring, schedule optimization and construction project cost control.
Seungwoo Han
Seungwoo Han. He is a professor at the Department of architectural Engineering at INHA University. He was granted with his PhD degree from Purdue Univ. at 2005.08. His main research areas include simulation-based productivity prediction, construction productivity, productivity analysis, and construction project cost control.
References
- AbouRizk, S. 2010. “Role of Simulation in Construction Engineering and Management.” Journal of Construction Engineering and Management 136 (10): 1140–1153. https://doi.org/10.1061/(ASCE)CO.1943-7862.0000220.
- Ahn, S. H., S. K. Kim, and K. H. Lee. 2016. “Development of a Fleet Management System for Cooperation Among Construction Equipment.” KSCE Journal of Civil and Environmental Engineering Research 36 (3): 573–586. https://doi.org/10.12652/Ksce.2016.36.3.0573.
- Al-Kofahi, Z. G., A. Mahdavian, and A. Oloufa. 2022. “System Dynamics Modeling Approach to Quantify Change Orders Impact on Labor Productivity: Principles and Model Development Comparative Study.” International Journal of Construction Management 22 (7): 1355–1366. https://doi.org/10.1080/15623599.2020.1711494.
- Alvanchi, A., R. Azimi, S. Lee, S. M. AbouRizk, and P. Zubick. 2012. “Off-Site Construction Planning Using Discrete Event Simulation.” Journal of Architectural Engineering 18 (2): 114–122. https://doi.org/10.1061/(ASCE)AE.1943-5568.0000055.
- Azimi, R., S. Lee, S. M. AbouRizk, and A. Alvanchi. 2011. “A Framework for an Automated and Integrated Project Monitoring and Control System for Steel Fabrication Projects.” Automation in Construction 20 (1): 88–97. https://doi.org/10.1016/j.autcon.2010.07.001.
- Batselier, J., and M. Vanhoucke. 2015. “Construction and Evaluation Framework for a Real-Life Project Database.” International Journal of Project Management 33 (3): 697–710. https://doi.org/10.1016/j.ijproman.2014.09.004.
- Chen, S. M., P. H. Chen, and L. M. Chang. 2012. “Simulation and Analytical Techniques for Construction Resource Planning and Scheduling.” Automation in Construction 21:99–113. https://doi.org/10.1016/j.autcon.2011.05.018.
- Chen, S. M., P. H. Chen, and L. M. Chang. 2013. “A Framework for an Automated and Integrated Project Scheduling and Management System.” Automation in Construction 35:89–110. https://doi.org/10.1016/j.autcon.2013.04.002.
- Cho, D., M. Lee, and J. Shin. 2020. “Development of cost and schedule data integration algorithm based on big data technology.” Applied Sciences 10 (24): 8917–8934. https://doi.org/10.3390/app10248917.
- Cho, D., J. S. Russell, and J. Choi. 2013. “Database Framework for Cost, Schedule, and Performance Data Integration.” Journal of Computing in Civil Engineering 27 (6): 719–731. https://doi.org/10.1061/(ASCE)CP.1943-5487.0000241.
- Grau, D., C. H. Caldas, C. T. Haas, P. M. Goodrum, and J. Gong. 2009. “Assessing the Impact of Materials Tracking Technologies on Construction Craft Productivity.” Automation in Construction 18 (7): 903–911. https://doi.org/10.1016/j.autcon.2009.04.001.
- Halpin, D. W., and L. S. Riggs. 1992. Planning and Analysis of Construction Operations. New York, USA: John Wiley & Sons, Inc.
- Halpin, D. W., and R. W. Woodhead. 1976. Design of Construction and Process Operations. John Wiley & Sons, Inc.
- Han, S., T. Hong, and S. Lee. 2008. “Production Prediction of Conventional and Global Positioning System–Based Earthmoving Systems Using Simulation and Multiple Regression Analysis.” Canadian Journal of Civil Engineering 35 (6): 574–587. https://doi.org/10.1139/L08-005.
- Han, S., S. Lee, T. Hong, and H. Chang. 2006. “Simulation Analysis of Productivity Variation by Global Positioning System (GPS) Implementation in Earthmoving Operations.” Canadian Journal of Civil Engineering 33 (9): 1105–1114. https://doi.org/10.1139/l05-124.
- Han, S., T. Lee, and Y. Ko. 2014. “Implementation of Construction Performance Database Prototype for Curtain Wall Operation in High-Rise Building Construction.” Journal of Asian Architecture and Building Engineering 13 (1): 149–156. https://doi.org/10.3130/jaabe.13.149.
- Heravi, G., and E. Eslamdoost. 2015. “Applying Artificial Neural Networks for Measuring and Predicting Construction-Labor Productivity.” Journal of Construction Engineering and Management 141 (10): 04015032. https://doi.org/10.1061/(ASCE)CO.1943-7862.0001006.
- Jung, D. K., Y. H. Tae, B. R. Ahn, and Y. H. Cho. 2009. “A Study on the Standard of Cost Estimation in the Construction of Pavement and Maintenance.” International Journal of Highway Engineering 11 (1): 85–94.
- Khanzadi, M., A. Kaveh, M. Alipour, and R. Khanmohammadi. 2017. “Assessment of Labor Productivity in Construction Projects Using System Dynamic Approach.” Scientia Iranica 24 (6): 2684–2695.
- Kim, H. 2012. “Fuzzy technique-based productivity estimation by means of construction delay factor analysis on curtain wall operations in high-rise building constructions.” MS thesis. Inha University, South Korea, Incheon.
- Kim, K. H., and H. S. Baik. 2015. “Comparative Analysis Between RSMeans and Standard Estimating System for Selective Finish Demolition in Remodeling Projects.” Journal of the Architectural Institute of Korea Structure & Construction 31 (3): 73–80. https://doi.org/10.5659/JAIK_SC.2015.31.3.73.
- Kim, E., J. Kim, S. Joo, C. Ahn, and M. Park. 2023. “A Method of Calculating Baseline Productivity by Reflecting Construction Project Data Characteristics.” Korean Journal of Construction Engineering and Management 24 (3): 3–11.
- Kim, D. Y., B. Kim, D. Yeo, and S. H. Han. 2009. “Quantity-Based Early Cost Estimation Model for Road Construction Projects.” KSCE Journal of Civil and Environmental Engineering Research 29 (3D): 373–379.
- Kim, S., M. Kong, J. Choi, S. Han, H. Baek, and T. Hong. 2021. “Feasibility Analysis of COVID-19 Response Guidelines at Construction Sites in South Korea Using CYCLONE in Terms of Cost and Time.” Journal of Management in Engineering 37 (5): 04021048. https://doi.org/10.1061/(ASCE)ME.1943-5479.0000957.
- Kim, Y. W., W. S. Shin, and C. B. Son. 2011. “An Analysis on the Influence Factors Relative to Reliability of Standard Production Unit System.” In Proceedings of the Korean Institute of Building Construction Conference, Busan, South Korea, 187–189.
- Kim, J., I. Yoon, M. Jung, S. Joo, S. Park, Y. Hong, and M. Park. 2022. “Establishment of Measurement Standards for Productivity Assessment in Construction Project.” Korean Journal of Construction Engineering and Management 23 (3): 3–12.
- Kiomjian, D., I. Srour, and F. J. Srour. 2020. “Knowledge Sharing and Productivity Improvement: An Agent-Based Modeling Approach.” Journal of Construction Engineering and Management 146 (7): 04020076. https://doi.org/10.1061/(ASCE)CO.1943-7862.0001866.
- Klügl, F., and A. L. Bazzan. 2012. “Agent-based modeling and simulation.” Ai Magazine 33 (3): 29–29. https://doi.org/10.1609/aimag.v33i3.2425.
- Ko, Y., K. Ngov, J. Noh, Y. Kim, and S. Han. 2023. “Discrete Event Simulation Based Equipment Combination Optimization Method - Based on Construction Equipment Performance Estimation of the Construction Standard Production Rate Korean.” Korean Journal of Construction Engineering and Management 23 (6): 21–29.
- Korea Institute of Civil Engineering and Building Technology. 2021. “Construction-Standard-Production-Rate.” Ministry of Land, Infrastructure and Transport, South Korea
- Labban, R., S. AbouRizk, Z. Haddad, and A. Elsersy 2013. “A Discrete Event Simulation Model of Asphalt Paving Operations.” In 2013 Winter Simulations Conference, Washington, DC, USA, 3215–3224. IEEE.
- Lee, J. 2010. “Construction performance evaluation of an advanced-technology based on construction simulation technique – focused on steel staircase system.” MS thesis. Inha University, South Korea, Incheon.
- Lee, K. 2011. “A selection method of slab-form operations in residential buildings based on delphi and construction simulation techniques.” MS thesis. Inha University, South Korea, Incheon.
- Lee, D., and C. Son. 2011. “Identifying the Issues Relative to Enactment And/Or Revision of Construction Standard Production Unit System and Its Improvement Measures.” Architecture Institute of Korea, AIK 27 (6): 131–140.
- Lim, S. Y., and S. K. Kim. 2020. “Productivity Analysis Using a Fleet Management System for Construction Equipment.” KSCE Journal of Civil and Environmental Engineering Research 40 (1): 87–95.
- Lu, M. 2003. “Simplified discrete-event simulation approach for construction simulation.” Journal of Construction Engineering and Management 129 (5): 537–546. https://doi.org/10.1061/(ASCE)0733-9364(2003)129:5(537).
- Macal, C. M., and M. J. North 2008. “Agent-Based Modeling and Simulation: ABMS Examples.” In 2008 Winter Simulation Conference, Miami, Florida, USA, 101–112. IEEE.
- Mahjoubpour, B., F. Nasirzadeh, M. M. H. Z. Golabchi, M. R. Khajehghiasi, and M. Mir. 2018. “Modeling of workers’ Learning Behavior in Construction Projects Using Agent-Based Approach: The Case Study of a Steel Structure Project.” Engineering, Construction & Architectural Management 25 (4): 559–573. https://doi.org/10.1108/ECAM-07-2016-0166.
- Ma, L., C. Liu, and A. Mills. 2016. “Construction Labor Productivity Convergence: A Conditional Frontier Approach.” Engineering, Construction & Architectural Management 23 (3): 283–301. https://doi.org/10.1108/ECAM-03-2015-0040.
- Markiz, N., and A. Jrade. 2017. “An Expert System to Optimize Cost and Schedule of Heavy Earthmoving Operations for Earth-And Rock-Filled Dam Projects.” Journal of Civil Engineering and Management 23 (2): 222–231. https://doi.org/10.3846/13923730.2015.1027258.
- Martinez, J. C. 2010. “Methodology for Conducting Discrete-Event Simulation Studies in Construction Engineering and Management.” Journal of Construction Engineering and Management 136 (1): 3–16. https://doi.org/10.1061/(ASCE)CO.1943-7862.0000087.
- Mostafa, S., N. Chileshe, and T. Abdelhamid. 2016. “Lean and Agile Integration within Offsite Construction Using Discrete Event Simulation: A Systematic Literature Review.” Construction Innovation 16 (4): 483–525. https://doi.org/10.1108/CI-09-2014-0043.
- Oh, J., T. Song, and B. An. 2020. “A Study on the Estimation of Proper Construction Cost for Road Pavement Maintenance Work.” Korean Journal of Construction Engineering and Management 21 (6): 16–26.
- Oral, E., and M. Oral. 2010. “Predicting Construction Crew Productivity by Using Self Organizing Maps.” Automation in Construction 19 (6): 791–797. https://doi.org/10.1016/j.autcon.2010.05.001.
- Shihyi, W., and D. W. Halpin 2004. “Simulation experiment for improving construction processes.” Proceedings of the 2004 Winter Simulation Conference 2, Washington, DC, USA. IEEE.
- Son, C., S. Hong, and H. Kim. 2010. “Strategies for Improving a Measurement System of Standard Unit Productivity Data on Construction Projects.” Architectural Institute of Korea 26 (6): 157–166.
- Wang, S., and D. W. Halpin. 2004. “Simulation Experiment for Improving Construction processes.” Proceedings of the 2004 Winter Simulation Conference, Washington, DC, USA, 1252–1259. Vol. 2. IEEE.
- Wu, C., C. Chen, R. Jiang, P. Wu, B. Xu, and J. Wang. 2019. “Understanding laborers’ Behavioral Diversities in Multinational Construction Projects Using Integrated Simulation Approach.” Engineering, Construction & Architectural Management 26 (9): 2120–2146. https://doi.org/10.1108/ECAM-07-2018-0281.
- Zankoul, E., H. Khoury, and R. Awwad 2015. “Evaluation of Agent-Based and Discrete-Event Simulation for Modeling Construction Earthmoving Operations.” ISARC. Proceedings of the International Symposium on Automation and Robotics in Construction, Oulu, Finland, 32: 1–9.