
 ?Mathematical formulae have been encoded as MathML and are displayed in this HTML version using MathJax in order to improve their display. Uncheck the box to turn MathJax off. This feature requires Javascript. Click on a formula to zoom.
ABSTRACT
Based on historical background and geopolitical factors, Macau is closely related to Portuguese cities; Macau also currently attaches great importance to the creation of a Sino-Portuguese platform and cultural tourism to drive better economic development. This study explores a method for identifying and mining cultural tourism potential areas developed under the YOLOv4 framework and cosine similarity. The main conclusions of this study are as follows: (1) While the YOLOv4 method shows good performance and can effectively identify the architectural texture of Portuguese cities, it may face certain difficulties if applied to newly built urban areas in Macau. (2) Through the cosine similarity method, it is found that the architectural texture slices of the three island cities of Portugal and Macau have certain similarities. The city with the highest level of similarity with Macau is Lisboa, followed by Porto and Evora, while Guimaraes has the lowest level of similarity with Macau. This finding serves as a certain reference for the subsequent construction of the cultural tourism characteristics of the region. (3) Comparing the characteristics of Macau city obtained through the cosine similarity algorithm with the city slices that have a high level of similarity in Portugal, we find the following: “street networks”, “street blocks”, squares, and open space form in the Macau Peninsula, while “street blocks” and “large-scale building complexes” form in the outlying islands. These types of spaces have different scales and can be developed in the future in conjunction with cultural tourism activities on different scales. This study applies machine learning methods to the development of urban cultural tourism potential areas, which provides new perspectives and methods for urban tourism development planning.
1. Introduction
1.1. Research background
For centuries, Macau has maintained close historical and cultural ties with Portuguese-speaking countries. Settled and governed by Portugal from 1557 AD to 1999, Macau was also a major trading center for the Portuguese Empire, as it was able to supply China with silver, pepper, and sandalwood thanks to its unique access to the Chinese market (Edmonds Citation1993; Hao Citation2011). The presence of such ties has also resulted in Macau’s urban planning and urban construction being deeply influenced by the Portuguese style for more than 400 years. Macau has administrative and legal similarities with Portuguese-speaking countries, and there are partial similarities in regard to cultural heritage. This is conducive to Macau becoming a service platform between China and Portuguese-speaking countries (dos Santos Citation2020; Jin and Yu Citation2019; Martinez-Galán, Ilhéu, and Zhang Citation2022; Spooner Citation2016). The “14th Five-Year Plan” and the “Guangdong-Hong Kong-Macau Greater Bay Area Development Plan Outline” help to outline China’s development strategy (Fulin Citation2021; Yu Citation2021). The Macau SAR government actively promotes the construction of a global tourism and leisure center and works to expands the capabilities of a commercial and trade cooperation platform between China and Portuguese-speaking countries (Matias Citation2014; O’Regan Citation2019; Pannell and Loughlin Citation2018; Yu Citation2018). As a cultural bridge between China and Portuguese-speaking countries, Macau can study in depth and fully explore the connotation and value of Sino-Portuguese cultural heritage, which can make its “heritage” story “come alive”. This is conducive to strengthening cultural exchanges and cooperation with Portuguese-speaking countries and can further consolidate the development of Macau as “One Centre, One Platform and One Base” (Macau Trade and Investment Promotion Institute Citation2021, City University of Macau Citation2021). The relevant government departments in Macau have also held many activities over the years, such as the China-Portuguese Culture and Art Festival, a China-Portuguese Culture Week, and the China-Portuguese Fashion Designer Exchange Exhibition (Cultural Affairs Bureau Citation2022). While the development of tourism based on the characteristic culture of Sino-Portuguese integration is also conducive to promoting economic development, how do we tap more urban areas with similar cultural backgrounds (culturally characteristic tourism potential areas) to facilitate subsequent tourism planning and design? This is an issue worth exploring.
1.2. Literature review
1.2.1. Tourism spatial planning and tourism resource mining
Tourism space is a type of urban space that has the functions of sightseeing and entertainment performances (Edensor Citation2001, Citation2007). It is an important urban component in international cities such as Macau, where tourism is a pillar industry (Leandro Citation2021). Exploring more tourism cultural resources and developing tourism potential space has gradually become a continuous trend in urban tourism space planning. At present, scholars have been mining tourist attractions based on rich local cultural heritage resources, such as China’s multiethnic mountain cultural heritage (Huang et al. Citation2022), biological archaeological sites (Licata et al. Citation2021), geological archaeological sites (Thakkar et al. Citation2022), agricultural sites (Kaulen-Luks et al. Citation2022), cave sites (Aly et al. Citation2021), and other types of development. For sites with clear architectural heritage or ruins, the site and architectural space are clear. In tourism development, the key work actually aims to explore and investigate heritage information in detail and make good use of its resources for further development (Gnanapala and Sandaruwani Citation2016; Wiles and Vander Stoep Citation2007). This is also a common traditional method of exploring areas with tourism potential. In addition, there are some cutting-edge methods that combine big data analysis and computational models. For example, some scholars have proposed assigning different weights to different tourism potential indicators based on resource value and development status and using a tourism potential assessment method calculated by a mathematical model to measure the tourism development potential of heritage sites (Yan, Gao, and Zhang Citation2017). Some scholars have also built models from environmental factor indicators, used the analytical hierarchy process (AHP) analysis method, or used the Butler-Tourism Area Life Cycle (TALC) model by R.W. Butler to evaluate and further explore the development of potential tourism areas (Dowling Citation1993; Kruczek, Kruczek, and Szromek Citation2018; Masih et al. Citation2018). It is undeniable that regardless of which cultural or heritage resources are included in tourism development, an area’s own characteristics must be fully explored. However, as a Chinese city with Portuguese culture, the issue of how Macau can further tap the tourism potential of areas with Sino-Portuguese cultural characteristics is still worth exploring.
1.2.2. Application of machine learning technology in tourism planning
Tourism spatial planning is part of urban spatial planning (Almeida, Costa, and Da Silva Citation2017; Dede and Ayten Citation2012; Papageorgiou Citation2016; Risteskia, Kocevskia, and Arnaudov Citation2012). With the development of machine learning technology, this method has gradually been applied to research the improvement of tourism or tourism space (Giglio et al. Citation2020; Wu et al. Citation2022; Zhou et al. Citation2020). Recently, numerous scholars have utilized machine learning models and algorithms in the fields of tourism development and construction. These applications have primarily focused on data surveys, precision marketing, travel analysis, tourist portraits, popularity analysis, tourist flow analysis, business location selection, and intelligent recommendations (Ampountolas and Legg Citation2021; Arefieva, Egger, and Yu Citation2021; Cepeda-Pacheco and Domingo Citation2022; Dewangan and Chatterjee Citation2018; Giglio et al. Citation2019; Han, Abreu Novais, and Zejnilovic Citation2021; Law et al. Citation2019; Luo et al. Citation2021, Citation2023; Xie, Qian, and Wang Citation2021; Yang et al. Citation2015; Zhang, Wu, and Fan Citation2019). Several scholars have employed machine learning techniques to evaluate data, extract tourist profiles, and forecast the fundamental requirements of tourists (Andariesta and Wasesa Citation2022; Claveria, Monte, and Torra Citation2018; Peng et al. Citation2021; Sun et al. Citation2019). On the one hand, these methods effectively disseminate information regarding tourists and picturesque locations, while on the other hand, they construct scenic areas in accordance with the demands and preferences of tourists. Throughout tourism activities, data pertaining to passenger flow, tourist origins, transit choices, and terminal utilization can be examined to facilitate the implementation of features such as eating suggestions, accommodation suggestions, SMS notifications, and product recommendations. Simultaneously, machine learning technology can be employed to study and forecast the movement of individuals to guarantee the security of tourist areas or picturesque locations (Ansari et al. Citation2022; Li et al. Citation2018). Tourists will then disseminate their tour experiences on social media platforms. Specifically, certain “Internet celebrities” and prominent influencers disseminate content using platforms such as Toutiao, Douyin (TikTok), Sina Weibo, Xiaohongshu and others, thereby exerting significant impact (Wu Citation2021). Machine learning techniques can also be employed to perform the live monitoring of data created during tourism activities to accomplish the intelligent advancement of beautiful areas (Legrand et al. Citation2022; Tussyadiah Citation2020; Zhao et al. Citation2023). Utilizing visitor data and scenic spot data, smart scenic places and smart tourism can be enhanced and refined (Khan et al. Citation2017; Wang et al. Citation2020). In such studies, machine learning mainly uses empirical data to improve the performance of the system itself, including classification, regression, clustering, and dimensionality reduction. Different machine learning algorithms have different application directions in the tourism industry. For example, classification algorithms are used for tourist portraits, content recommendations, and scenic spot classification (Akgün, Çizel, and Ajanovic Citation2022; Panawong, Snae Namahoot, and Brückner Citation2014; Zhou et al. Citation2020); clustering algorithms are used for market segmentation, social circle analysis, and tourism data analysis (Nilashi et al. Citation2017; Rodríguez et al. Citation2018); and regression algorithms are used for tourist flow prediction, product prediction, and scenic spot evaluation (Lin and Lee Citation2013; Claveria, O., et al. Citation2016). Common algorithms and models include K-nearest neighbor (KNN), naive Bayesian classification, C-medoids clustering (FCMdC), and agglomerative hierarchical clustering (AHC) (D’Urso et al. Citation2013; Monica, Natalia, and Sudirman Citation2018; Puspita and Sasmita Citation2022; Rochman et al. Citation2022). Since its development, there have been many types of machine learning technologies and methods put forward; however, previous research has focused more on improving the tourism industry from the perspective of tourists’ experiences. Less attention has been given to the technology involved in machine learning in the early stages of tourism space planning. At the same time, the algorithmic models of the YOLO series have also rarely been used in this field of study. Therefore, the YOLO series of algorithms still has great research potential in the field of early planning and analysis of the tourism space.
1.3. Problem statement and objectives
In recent years, urban big data analysis and artificial intelligence technology have been gradually applied to architectural space, urban space, tourism space planning, and other fields to solve various practical problems. As the core technology of artificial intelligence and one of the tools and technologies for data processing, machine learning has gradually become a research hotspot in the field of urban research. In this study, with the purpose of exploring tourism potential areas of Portuguese characteristic culture, machine learning methods were used to mainly discuss the following three issues: (1) Which cities in Portugal can be used as typical representatives of traditional cities and analyzed in relation to Macau? (2) How are the two methods of YOLOv4 and cosine comparison constructed and used to tap the tourism potential area of Portuguese characteristic culture? (3) How will the mining of potential tourism areas with characteristic cultures assisted by machine learning help the city’s subsequent tourism space planning?
2. Materials and methods
2.1. Research process and area
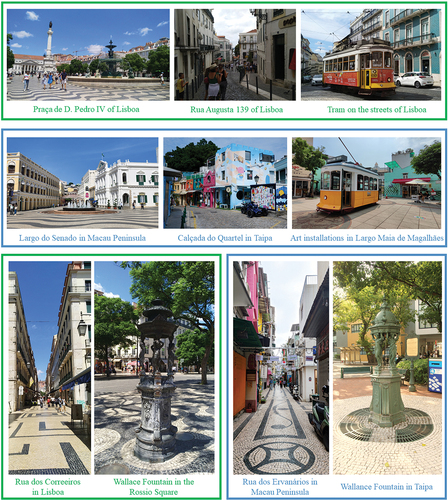
First, the researchers aimed to determine what spatial features can express the distinctive Portuguese culture (). To this end, urban texture areas with representative characteristics were selected as the main objects of analysis in this study. Furthermore, the researchers aimed to compare the morphological differences between Portugal and Macau from a machine learning perspective and explore the correlation between them. Through image processing and analysis techniques, it is possible to demonstrate the extent of Portuguese architecture’s influence on Macau and gain an initial understanding of the relationship between the two areas. This study is of great significance for not only gaining a deeper understanding of the relationship between Asian cities and Portuguese architecture but also exploring the tourism potential of spaces unique to Portugal.
Figure 1. Some similar spatial features between Lisboa, Portugal, and Macau, China (image source: photographed by the author in 2019 and 2023, respectively).
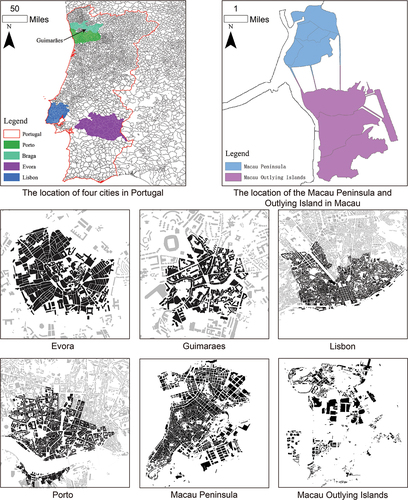
There are 5 main cities studied in this paper: Lisboa, Porto, Évora, and Guimaraes in Portugal and Macau in China (). Among them, the Macau Special Administrative Region includes three island cities: Macau Peninsula (an island located in northern Macau), Taipa Island (an island in the center of Macau), and Coloane Island (an island in southern Macau). Due to repeated land reclamation in modern times, Taipa Island and Coloane Island have been integrated into one and are customarily called the “outlying islands” (Lintner and Lintner Citation2002). Thus, in this study, Macau’s outlying islands refer to Taipa Island and Coloane Island. The former group (Portugal cities) is mainly used as a training set for machine learning, and the latter group (Macau locations) is mainly used for experimental application and analysis. Prior to selecting samples, the urban areas of world cultural heritage in Portugal and Macau under the same heritage value system were considered: Evora Historic Center (designated a World Heritage Site in 1986), Porto Historic Center (designated a World Heritage Site in 1996), Guimaraes Historic Center (designated a World Heritage Site in 2001), and the Historic Center of Macau (designated a World Heritage Site in 2005). In addition, a large number of historical buildings from the 12th century remain in the old city of Lisboa (Doroz-Turek Citation2023; Dudzic-Gyurkovich Citation2014), and the urban fabric has a high degree of integrity; both are included in this study’s sample for future comparisons. Because these areas have more prominent Portuguese architectural texture characteristics, this helps to more accurately capture the characteristics of these urban forms in the subsequent machine learning model training.
Figure 2. Research area (the first two images show the location of the four cities examined in Portugal, and the location of the Macau Peninsula and the outlying islands in Macau; the remaining maps represent the urban form areas under study).
In addition, Macau also has a large number of buildings left over from the Portuguese administration era. The Historic Center of Macau is located on the main island of Macau. It is a historical district that has the old city of Macau as its core. There are adjacent squares and streets connecting more than 20 historical buildings. It was included in the World Cultural Heritage List in 2005 (Mok Citation2012; Ung and Vong Citation2010). Although Taipa Island is an outlying island that has undergone rapid development and construction since the 1980s, it retains a Portuguese-style neighborhood known as Taipa Village (the old town area). There are a large number of buildings that have been included in the “Assessed Real Estate” list of the Macau SAR belonging to the category of “Heritage Buildings”, such as Our Lady of Carmel Church, Kun Iam Tong Temple (Taipa), I Leng Temple, Pak Tai Temple, Tin Hau Temple, Sam Po Temple, Museum of Taipa and Coloane History (Building of the Former Municipal Council of the Islands), Pou Sun Pawnshop, Carmo Square/Avenida da Praia, Camões Square/Rua dos Mercadores/Rua dos Negociantes/Rua do Meio, and Carmo Fair (Former Site of Taipa Municipal Market). Similarly, Coloane Island also retains such a block, namely, the old urban area of Coloane. A large number of heritage buildings are also preserved here: St. Francis Xavier’s Church (Coloane), Tam Kong Temple, Tin Hau Temple, Sam Seng Temple, Kun Iam Temple (Coloane), Coloane Pier, Building of the Coloane Library, Eduardo Marques Square, Rua dos Negociantes, President António Ramalho Eanes Square, Coastal Avenue from Coloane Pier to Tam Kong Temple Square, and the Lai Chi Vun Shipyards.
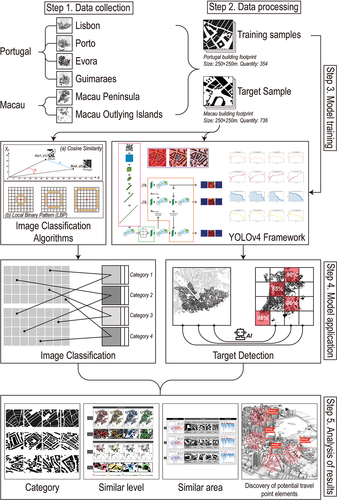
The research method of this study is divided into five main steps: data collection, data processing, model training, model application, and result analysis (). The details are described as follows:
Data collection stage: This study collects architectural texture images of the historic urban areas of Lisboa, Porto, Évora, and Guimaraes in Portugal. These data come from the OpenStreetMap database. At the same time, this study obtains architectural texture images of the Macau Peninsula and outlying islands from the digital map released by the Macau Cartography and Cadastre Bureau in 2022.
Data processing stage: To increase the sample size to support model training, this research cuts the collected samples into pictures 512 × 512 pixels in size, corresponding to the range of 250 × 250 meters on the map. The samples are then divided into two categories: training samples and target samples. The training samples are mainly cropped and unified for the four cities in Portugal. To improve the efficiency of model training, the research team manually screens out pictures with less information and those lacking the characteristics of Portuguese cities, finally obtaining 354 valid samples. Since the target sample does not involve model training, it only needs simple cropping and unified processing; a total of 736 images are obtained.
Model training stage: This study uses the YOLOv4 object detection model framework to train the Portuguese architectural texture samples. After 200 iterations of training, the model is gradually fitted, and the training process is completed. At the same time, this study also uses the image classification algorithms of cosine similarity and local binary patterns (LBP) to locate specific locations with similar architectural textures between Macau and Portugal for further analysis and comparison.
Model application stage: the trained YOLOv4 model is applied to the architectural texture of Macau to detect the degree of similarity between the architectural texture of Macau and different cities in Portugal to assist in the understanding and judgment of urban form research. At the same time, in the design of the image classification program, the image classification process mainly focuses on the pictures of the architectural texture of Macau and sorts and classifies the architectural texture slice samples of different cities in Portugal and the architectural texture of Macau. Samples with a cosine similarity greater than 80% are classified into the same category; finally, 167 categories are obtained from 1,090 images of architectural textures.
Research results analysis stage: Based on the above analysis results, this study mainly discusses the interpretation of the similar categories, degrees of similarities, and locations of similar regions between Macau and Portugal in terms of urban morphology. The use of machine learning technology can effectively assist in the discovery and planning of potential cultural tourism areas.
Figure 3. Research flow chart.
2.2. Data sources
This study compares the building footprints of Portuguese and Macau structures using the machine learning techniques of YOLOv4 object detection and cosine similarity. First, Portuguese city image data are collected as a training set for machine learning, and then the YOLOv4 neural network framework is used to train the machine to learn the rules of the urban building footprint that are difficult for humans to observe so that it can accurately identify the Portuguese building footprint. Finally, the building footprint map of Macau is input into the algorithm so that the machine can identify regions that are comparable to Portugal. The raw spatial information data obtained include geographic information from mainland Portugal, the Azores, and Madeira in matrix (raster) and vector formats; open source geographic information in Portal de dados da União Europeia and Portal de dados da União Europeia; and digital map data for the whole territory of Portugal. The February 2022 version of the urban digital model of the entire territory of the Macau Special Administrative Region is also obtained by the researchers from the Macau Cartography and Cadastre Bureau (including maps with a scale of 1/1000, 1/10000, and 1/20000 and a scale of 1/1000 in SHP format). Because the comparison of images is predominantly based on the building block plan, it has a degree of complexity because it reflects aspects such as architectural form, density, and history. Therefore, the researchers also decide to utilize the building block-plan image data of the Mapbox platform, which contains relatively accurate data records for the building bases of numerous Portuguese cities. Then, the researchers further process the images by adjusting the scale, slicing, and unifying the specifications.
2.3. Object detection: YOLOv4
2.3.1. Sample collection
Since they do not play a role in the machine learning training, the role of the selection of Macau samples is mainly to serve as objects of model application and, through the model, to help identify regions similar to Portugal. Therefore, the research team included all the land in Macau, including historical and modern districts, to obtain richer research results. Such inclusion also helps to compare and analyze the differences between the historical and modern architectural forms of Macau. By collecting image samples of architectural textures from different regions in Portugal and Macau, this study can provide a variety of data sources to more fully reveal the comparative results of the urban forms of Portugal and Macau. Such a sample selection strategy will help this study gain an in-depth understanding of the urban architectural features of the two regions and provide an accurate and reliable basis for the analysis process of machine learning.
2.3.2. Sample processing
This study adopts different processing methods for research materials with different purposes. For the building texture materials of four cities in Portugal, the research team adopts the method of expert selection. After careful observation of the architectural textures of different cities in Portugal, the research team selects architectural texture samples with remarkable characteristics. Although the sample size varies by city, each city is adequately represented to ensure the accuracy and reliability of the research findings. Specifically, Évora has 72 samples, while Guimaraes has 58, Porto has 101, and Lisboa has 123 ().
Figure 4. Sample processing of architectural textures in four cities in Portugal (the red in the figure shows the selected areas, and the numbers show the number assigned to each area).
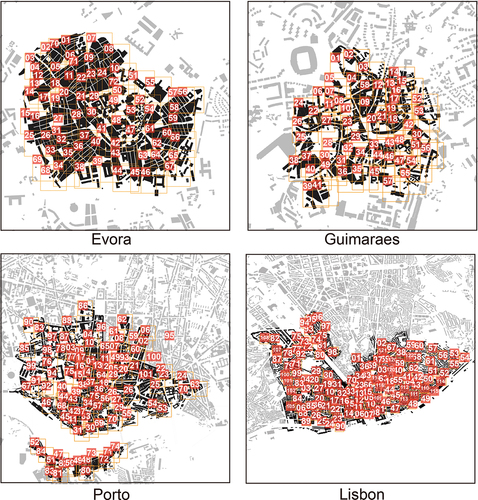
The size of these samples depends on the size of each city’s historic district. Since the historical urban areas of Lisboa and Porto are relatively large, the number of samples is increased accordingly to more fully reflect the architectural texture characteristics of these cities. Through expert screening and observation, this study selects the most representative and informative architectural texture samples to ensure the reliability and validity of the study. This sample processing method allows the researchers to focus on the architectural texture differences of different cities in Portugal and conduct further analysis and comparison through machine learning methods. These carefully selected samples will provide a solid basis for this study to reveal the characteristics of Portuguese urban forms.
When dealing with architectural texture samples in Macau, these samples only need to be used as detection objects and classification targets because they do not need to be used for machine learning training. Therefore, it is necessary to increase the number of samples as much as possible to conduct a comprehensive analysis and evaluation of the architectural texture of Macau. Therefore, the researchers adopted a method of multiple cutting in the processing of architectural texture samples in Macau. As shown in , for the Macau Peninsula and Macau’s outlying islands, the red boxes indicate the number and range of the first crop, from which 22 × 22 images can be obtained. The blue boxes indicate the number and range of the second cropping, from which 21 × 21 images can be obtained. Through two cuts, a total of 1,850 images of the Macau Peninsula and the Macau Islands can be obtained. After excluding pictures with less information, there are still 736 pictures that can be used for further experiments.
Figure 5. Material processing of the experimental object (the red boxes show the position of the first slice, and the blue boxes show the position of the second slice; a total of two rounds of slices are conducted after screening, and 736 pictures are obtained as the experimental objects).
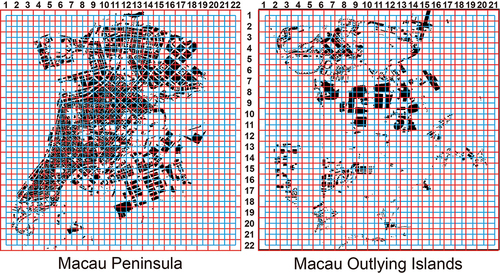
Through the multiple cropping method, the research team is able to obtain more samples from the architectural texture of Macau to increase the diversity and representativeness of the data. This strategy ensures that the model is able to adequately detect and analyze all aspects of Macau’s architectural fabric. By excluding pictures with less information, the research team can ensure the quality of the samples used and reduce the impact on the experimental results. These 736 cropped images will serve as the basis for further experiments. Through the analysis and comparison of these images, the research team will be able to gain a deeper understanding of the architectural texture characteristics of Macau. The images also compared and studied with Portuguese samples to reveal the differences and commonalities between the historical architectural forms and modern architectural forms of the two places. The findings aim to provide a richer database for the study and further promote the in-depth exploration of the urban morphology of Portugal and Macau.
Through the abovementioned data processing methods and procedures, the research team obtains a total of 1090 architectural texture samples from six urban areas in Portugal and China: Évora, Guimaraes, Porto, Lisboa, the Macau Peninsula, and Macau’s outlying islands. These samples exhibit some notable features overall, as shown in .
The samples are rich in diversity, covering the architectural textures of different cities and regions. From Évora to Guimaraes, from Porto to Lisboa, from the Macau Peninsula to the outlying islands, these cities are unique in history, culture, and architectural style; thus, the samples collected reflect this diversity.
The samples present the unique charm and style of their respective cities. Each city has its own unique history and architectural tradition, which is reflected in the samples. From the traditional architecture of Évora, the old town of Guimaraes, the Baroque architecture of Porto, the Belém Tower of Lisboa, and the Portuguese architecture of Macau – each city is famous for its unique architectural features and style.
The sample also highlights the commonality of Portuguese and Macau architectural textures. While each city has its own uniqueness, there are also some common architectural elements and styles present among these cities due to their historical and cultural ties. Through the study and comparison of these samples, the research team can further explore and reveal this commonality, providing a deeper understanding and analysis of the architectural textures of Portugal and Macau.
In summary, through the abovementioned method and process of sample processing, the research team successfully obtains 1,090 architectural texture samples from Portugal and Macau (). These samples have remarkable characteristics in terms of diversity, urban characteristics, and commonality, which provide a solid foundation for further research and analysis. Thus, these samples will be used to train and evaluate machine learning models to reveal and understand the characteristics of the urban forms of Portugal and Macau.
Figure 6. Material handling results. (1) Évora; (2) Guimaraes; (3) Porto; (4) Lisboa; (5) Macau Peninsula; (6) Macau’s outlying islands.
3. Machine learning experiment results
3.1. Model training
In this study, to realize the automatic detection and classification of architectural textures, the research team chooses YOLOv4 as the main target detection model (). The principle of YOLOv4 is based on a single-stage target detection method that directly predicts the bounding box and category of the target by converting the target detection task into a regression problem. It adopts a strategy called “You Only Look Once” (YOLO) to complete both object detection and classification in one forward pass; thus, it has efficient real-time performance (Diwan, Anirudh, and Tembhurne Citation2023; Xie et al. Citation2020).
Figure 7. YOLOv4 model architecture design.
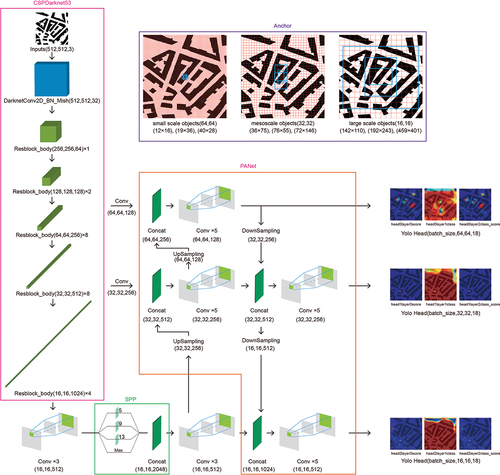
The architecture of YOLOv4 mainly consists of the following key components:
CSPDarknet53: As a backbone network, CSPDarknet53 has the characteristics of scalable depth and width. By introducing the CSP (Cross Stage Partial) structure, this process enhances the expressive ability and feature extraction ability of the network while reducing parameters.
SPP (Spatial Pyramid Pooling): The SPP module is used to obtain feature information at different scales. It uses multiple pooling operations at different levels of the network to extract and fuse features of different receptive fields, thereby improving the model’s ability to adapt to scale changes.
PANet (Path Aggregation Network): The PANet module is used to fuse feature maps of different resolutions. Through top-down and bottom-up paths, PANet can effectively transfer and fuse feature information from different levels, thereby enabling the model to perform accurate object detection at different scales.
Detection head: The detection head of YOLOv4 is responsible for decoding the feature map output by the network and predicting the position and category of the target. It uses multiple convolutional layers and linear activation functions to convert feature maps into bounding box coordinates and predictions of object categories.
Anchor design: YOLOv4 captures targets of different scales by using predefined anchor boxes. By generating anchor boxes on feature maps and matching them with predicted bounding boxes, the model can accurately predict the location and size of objects.
The YOLOv4 model plays an important role in this study.
Efficient real-time performance: YOLOv4 adopts a single-stage target detection strategy, which can complete target detection and classification tasks in an efficient time. This is crucial for the task of processing large-scale architectural texture samples, enabling fast and accurate analysis and the identification of architectural textures in samples.
Multiscale feature fusion: Through the combination of components such as CSPDarknet53, SPP, and PANet, YOLOv4 can effectively fuse multiscale feature information. For objects with different scales and structures, such as architectural textures, the ability to fuse multiscale features can improve the model’s ability to identify and analyze architectural textures of different scales.
Accurate target positioning and classification: YOLOv4 can accurately locate and predict the position, bounding box, and category of architectural texture through the designed detection head and anchor box. This is very important for the detection and classification of architectural textures, which is the goal of this research, and it can provide accurate results for further research and analysis.
In summary, YOLOv4, as the main model of this study, combines key components such as CSPDarknet53, SPP, and PANet, as well as detection heads and anchor boxes. Its efficient real-time performance, multiscale feature fusion, and precise object localization and classification capabilities provide powerful tools and methods for this study to achieve automatic detection and classification of architectural textures.
In this study, four commonly used evaluation metrics are used for model training, namely, the F1 score, AP, precision, and recall, to evaluate the performance and accuracy of the object detection model. Each of these metrics has a specific interpretation and meaning that can provide a comprehensive understanding of model performance. Specific explanations are provided as follows:
F1 score: The F1 score is the harmonic mean of precision (precision rate) and recall (recall rate), which takes into account the accuracy and integrity of the model. The F1 score is suitable for evaluating the balanced performance of the model in different categories, and the specific calculation formula is given as 2 * (Precision * Recall)/(Precision + Recall).
AP (average precision): AP is an indicator used to measure the performance of the model for single-category target detection. It reflects the accuracy of the model at different thresholds by computing the precision at different recalls and averaging them. The higher the AP is, the better the performance of the model is on the target detection task.
Precision (precision rate): Precision measures the proportion of the model in the detected target that is actually the target, that is, the accuracy of the model. Precision can be calculated by calculating the ratio of detected true positives (targets correctly identified by the model) to total detected positives (both true positives and false-positives). A high precision rate means that the model can accurately identify the object.
Recall (recall rate): Recall measures the proportion of the target that the model can detect, that is, the integrity of the model. Recall can be calculated by calculating the ratio of detected true positives to total true positives (including true positives and false-negatives). High recall means that the model is able to capture objects more fully.
As shown in , the following can be observed through the abovementioned indicators:
The F1 score comprehensively considers the accuracy and completeness of the model and is suitable for evaluating the balanced performance of the model in different categories. A higher F1 score indicates that the model performs well in both accuracy and completeness. It can be observed from the data in that, among the four cities in Portugal, Porto has the highest F1 score (0.79), indicating that it excels in accuracy and completeness. Guimaraes has the lowest F1 score (0.50), which may be due to the city’s small historical urban area and limited number of samples, which affect the accuracy of model training. The models for other cities all exceed 0.6, indicating their acceptable performance.
AP is an indicator used to measure the performance of the model for single-category object detection, reflecting the accuracy of the model at different thresholds. A higher AP level indicates that the model performs better in object detection tasks, especially multicategory object detection. It can be observed from the figure that the AP of Porto is still the highest (80.25%), while the models of other cities perform mediocrely in the AP test.
Precision measures the proportion of the model in the detected target that is actually the target, that is, the accuracy of the model. A higher precision level means that the model can accurately identify the target. The precision of most city models is approximately 70%; while the accuracy of Guimaraes is the lowest, at 58.82%, it is still exceeds 50%.
Recall measures the proportion of objects that the model can detect, that is, the integrity of the model. A higher recall level means that the model is able to capture the target more comprehensively. Porto remains the city model with the highest index value (81.25%), followed by Évora (66.67%), while Guimaraes has the lowest recall value at 43.48%.
Figure 8. Model training accuracy metrics. (a) represents Évora and Porto; (b) represents Lisbon and Guimarães.
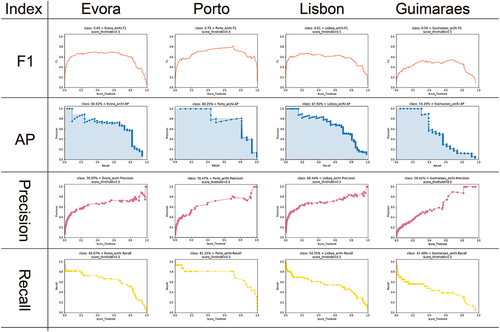
On the whole, there are differences in the training results of the four cities in terms of F1 score, AP, precision, and recall. Porto is the best, while Guimaraes is the worst. These results can be attributed in part to differences in sample size, with Guimaraes having the smallest sample size. In addition, the architectural texture of Porto is more integrated, which makes it is easier for the model to learn the rules, while the architectural texture of Guimaraes changes greatly, which is not conducive to the training and fitting of the model. These evaluation metrics provide researchers with objective observations and conclusions about model performance.
3.2. Model testing
When testing the model, this study exports the detection heads of different scales and layers in the YOLOv4 model to observe how the model observes the architectural texture in practical applications. As seen from , Head 0 can detect large plots in the test picture that are similar to the texture of Portuguese buildings. Furthermore, while Head 1 can detect buildings of moderate size, Head 2 is mainly used to detect smaller streets and small public spaces. In addition, Layer 0 in the figure is used to locate the position of the detection target. Layer 1 is used to classify the target type in the image (all the red in the picture represents only one type of object), and Layer 2 is the result of the combination of Layer 0 and Layer 1.
Figure 9. Model testing.
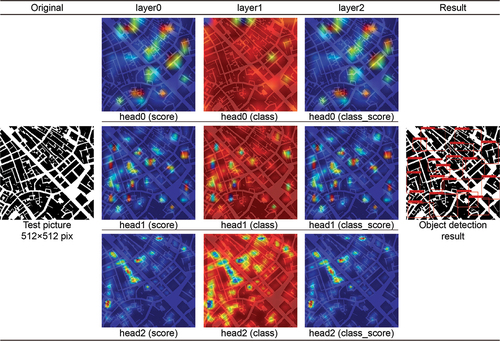
In summary, the model in this study can basically complete the detection task and shows good performance on different scales of building textures. Through the multiscale detection head and layer design of the model, buildings and scenes of different scales can be effectively captured and recognized. These observations further validate the effectiveness and applicability of the YOLOv4 model for the detection of Portuguese architectural textures.
3.3. Image classification: cosine similarity and local binary patterns (LBP)
3.3.1. Cosine similarity principle
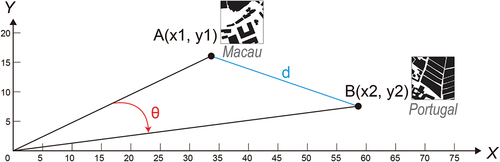
In the research on image classification, this study adopts cosine similarity as a common similarity measure. Cosine similarity measures the similarity between two vectors by calculating the angle between them (Sidorov et al. Citation2014; Xia, Zhang, and Li Citation2015). Specifically, cosine similarity measures how similar two vectors are in their orientation in multidimensional space, regardless of their length. The calculation formula for cosine similarity is as follows:
where A and B represent two vectors; A B represents their inner product (that is, the corresponding elements are multiplied and summed), while |A| and |B| represent the norms of vectors A and B, respectively (that is, the length). As shown in , point A (x1, y1) represents the architectural texture of Macau, and point B (x2, y2) represents the architectural texture of Portugal. Line segment d connects points A and B, and the origin is connected with points A and B, forming an included angle θ. Among them, point A and point B can be expressed as two vectors, and their coordinates are (Ax, Ay) and (Bx, By), respectively. Then, we can calculate the angle θ between point A and point B, which reflects the degree of difference between the two architectural textures. The smaller the included angle θ is, the higher the level of similarity between the architectural textures is; the larger the included angle θ is, the greater the difference between the architectural textures is.
Figure 10. Cosine similarity principle.
3.3.2. Principles of the local binary patterns
In the study of similarity calculation for image classification, this study uses the local binary pattern (LBP) method, which is a commonly used feature extraction method. The LBP method is a local texture descriptor that is used to capture the texture features of local regions of an image. By comparing each pixel in the image with its surrounding pixels, the LBP method converts the local image texture information into a binary code to form a feature vector. The local binary mode is characterized by the following:
Capturing texture features: The LBP method can effectively capture the local texture features of images, which is very useful for describing and comparing architectural textures. By extracting the LBP feature, the texture information of the building can be obtained to realize the comparative study of the architectural texture of Portugal and Macau.
Simple and efficient: The LBP method is simple and efficient. It only needs to compare pixel values and convert binary codes; the calculation speed is fast, and no complicated training process is needed. These factors make the LBP method advantageous in large-scale image data processing and real-time applications.
Not affected by illumination and geometric changes: The LBP method has a certain robustness to illumination changes and geometric changes in the image. It mainly focuses on the relative relationship of pixel values and is not affected by absolute pixel values. This allows the LBP method to reduce the interference of illumination and angle changes when studying architectural textures, making it more robust.
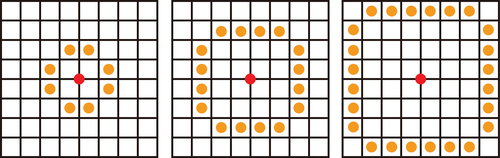
The principles of the LBP method are given as follows ():
Feature point selection: Selects a pixel point in the image as the center point.
Neighborhood definition: Defines the neighborhood as being composed of pixels around the center point; for example, uses 8 neighborhoods to represent 8 pixels around the center point.
Pixel comparison: compares each pixel value in the neighborhood with the pixel value of the center point. If the neighborhood pixel value is greater than or equal to the center pixel value, then the pixel is marked as 1; otherwise, it is marked as 0.
Binary encoding: Converts the pixels in the neighborhood into binary encoding according to the comparison results to form a binary number. For example, for an 8-neighborhood neighborhood, an 8-bit binary number can be obtained.
Feature vector generation: Concatenates the binary codes of all the neighborhoods around the center point to form a feature vector. Through these five steps, the LBP method converts the local texture information of the image into a binary-coded form so that the texture features can be described and compared in a simple and effective way.
Figure 11. Local binary patterns (LBP).
In summary, using YOLOv4, cosine similarity, and the local binary pattern (LBP) method to conduct comparative research on Portuguese architectural texture and Macau texture has the following advantages:
YOLOv4: YOLOv4 is an object detection algorithm that is efficient and accurate. It can help identify and locate objects of interest within building textures, providing more precise analysis and comparison results. Its main advantages are its strong real-time performance, having a good detection effect on small targets, and its suitability for processing a large amount of image data.
Cosine similarity: Cosine similarity is an indicator used to measure the similarity between vectors. When comparing the architectural textures of Portugal and Macau, cosine similarity can be used to calculate the degree of similarity between them. Cosine similarity can ignore the absolute size of the vector and pay more attention to the direction between the vectors, which has certain advantages for the comparison of texture features.
Local binary pattern (LBP): The LBP method can extract texture features from images, which is very useful for comparing architectural textures. It is simple and efficient, capable of capturing local texture information, and has certain robustness. By applying the LBP method, the eigenvectors of the architectural textures of Portugal and Macau can be obtained from the images to realize the comparison and analysis between them.
At the same time, the significance of combining the three methods of YOLOv4, cosine similarity, and the local binary pattern (LBP) method to conduct a comparative study of Portuguese architectural texture and Macau texture is as follows:
Comprehensive analysis: The combined use of these three methods can conduct a comprehensive analysis of the architectural texture from different angles and feature levels. YOLOv4 is used for target detection and localization, which can help identify buildings of different scales and sizes. Cosine similarity is used to calculate texture similarity and measure the similarity of architectural textures. The local binary pattern (LBP) method is used to extract the texture features of the image and capture the local texture information. Using these methods comprehensively can provide more comprehensive and accurate comparison results.
Provide quantitative indicators: These methods can provide quantitative indicators that can in turn be used to measure the similarity or difference between architectural textures. Through the calculated results, a specific numerical description can be obtained, which is more helpful for researchers to compare and analyze the architectural textures of Portugal and Macau.
Expansion of the research field: The comparative study of Portuguese architectural texture and Macau texture using these three methods is not limited to the application in this study but can also provide reference and inspiration for other related research fields. The advantages and characteristics of these methods give them extensive application value in the fields of texture analysis, image processing, and target recognition, and they help provide new ideas and methods for related research.
4. Discussion: comparison of analysis results
4.1. Integral comparison of urban space
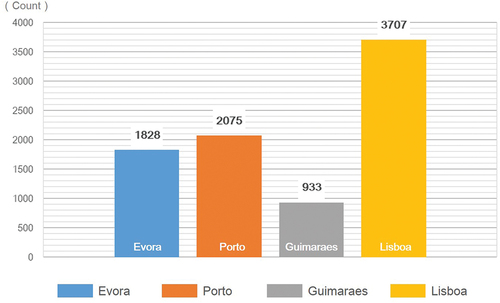
First, the researchers use the YOLOv4 object detection algorithm to identify a total of 8,543 similar slices after identifying the morphological similarities between the urban space of Macau and four cities in Portugal. Of these, 1,828 are similar to Evora, 2,075 are similar to Porto, 933 are similar to Guimaraes, and 3,707 are similar to Lisboa. From the statistical data, it can be concluded that most slices recognized by the algorithm are pictures with similar urban forms in Macau and Lisboa. The results show that the urban morphology similarity between Macau and Lisboa is the highest, followed by that between Macau and Porto and Macau and Evora, while the similarity between Macau and Guimaraes is the lowest ().
Figure 12. Slice sample number statistics (different colors represent different Portuguese cities.).
At the same time, through the YOLOv4 object detection algorithm, four groups of similar shape recognition maps of Macau and four cities in Portugal can be obtained. In , the position and distribution of 8,543 slices can be seen very intuitively. Judging from the identified slice positions of the Macau Peninsula, the similar location of the Macau Peninsula to Evora is located in the peripheral area of Macau. The similarities with Porto and Guimaraes are relatively average, and the similarities with Lisboa are obviously concentrated in the central area of the Macau Peninsula. Judging from the identified slice positions of Macau’s outlying islands, the similar positions between Macau’s outlying islands and Evora, Porto, and Guimaraes are average. A similar morphology to Lisboa is located in the eastern region (). In addition, the number of slices identified on the Macau outlying islands is much smaller than that on the Macau Peninsula. On the one hand, the number of buildings on Macau’s outlying islands is less than that on the Macau Peninsula. On the other hand, the urban planning and development of Macau’s outlying islands is relatively late, and the urban spatial texture is more modern. Most of the identified urban slices are located in the airport cargo terminal area.
Figure 13. Similar morphological identification map of Macau (including the Macau Peninsula and Macau’s outlying islands) and the four cities of Portugal (red represent areas similar to Évora; yellow represents areas similar to Porto; sky blue represents areas similar to Guimarães; and fluorescent green represents areas similar to Lisboa.).
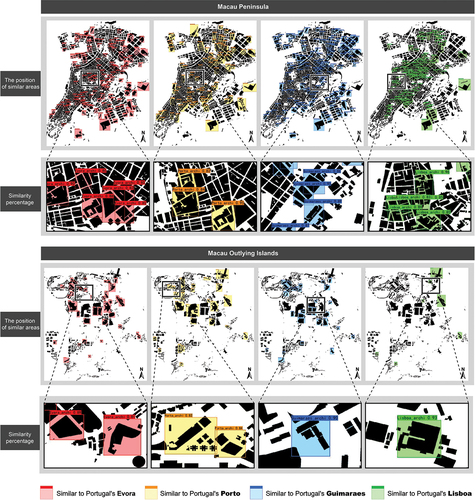
This is also because the development history of outlying islands is very different from that of the Macau Peninsula. In the past, the majority of Taipa and Coloane’s transportation was conducted by boat, particularly during the initial independent island period. However, in the area of the outlying islands, the original island form is mainly mountains (Taipa Grande, Taipa Pequena, Alto de Coloane and Ka Ho). There are few places where fishermen can settle, mainly village settlements at the foot of the mountain or fishing villages on the sea (Chan Citation2016; Yeung, Lee, and Kee Citation2008). Therefore, the machine learning process did not detect a similar large continuous area in this location, which happens to be the original mountain range area of Taipa and Coloane. Areas in which similar urban morphologies are detected are also mainly historically settled urban centers, most of which were developed from Chinese villages.
To further study the morphological characteristics of the recognition area, the researchers use the cosine similarity algorithm to continue to calculate the similarity of the 8,543 slices obtained before. Through the cosine similarity algorithm, 167 groups of similar slices are obtained, including 101 groups on the Macau Peninsula and 66 groups on the outlying islands.
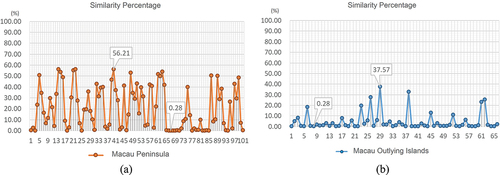
First, a similarity comparison is performed between each identified slice sample and all Portuguese city slices. The similarity between the 101 Macau Peninsula group samples and all the Portuguese city slices ranged from 0.28% to 56.21%, with an average of 20.76%. The similarity between the 66 groups of samples from Macau’s outlying islands and all the Portuguese city slices ranged from 0.28% to 37.57%, with an average of 4.79% (). On average, samples from the Macau Peninsula are more similar to all slices of Portuguese cities than are samples from the outlying islands. Judging from the change in frequency of the sample similarity value, the similarity value of each sample in the Macau Peninsula represents a large change, while the similarity percentage line in the table fluctuates more (). This shows that the sample morphology of the Macau Peninsula is relatively rich and has a variety of similarities with the Portuguese urban morphology. The similarity value of each sample in Macau’s outlying islands shows a small change, and the broken line in the table fluctuates less, concentrating at less than 10% (). This shows that the sample morphology of Macau’s outlying islands is relatively simple and has little similarity with the Portuguese urban morphology.
Figure 14. Comparing the similarity between the Macau slice samples and all the Portuguese city slices: (a) the similarity between the Macau Peninsula sample and all the Portuguese city slices; (b) the similarity between the Macau outlying island sample and all the Portuguese city slices.
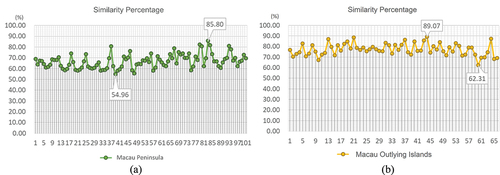
Second, we compare the similarity between each identified sample and the slices of Portuguese cities selected by the cosine similarity algorithm. The similarity between the 101 groups of slice samples from the Macau Peninsula and the Portuguese city slices selected by the algorithm range from 54.96% to 85.80%, with an average of 66.71% (). The similarity between the slice samples of the 66 groups of the Macau outlying islands and the Portuguese city slices selected by the algorithm is 62.31% to 89.07%, with an average of 77.16% (). Compared with the above data, it is obvious that the overall slices selected by the algorithm have a higher level of similarity, and the values are relatively stable (). The following sections will analyze and compare the slices selected by the algorithm in terms of specific spatial forms.
Figure 15. Comparison of the similarity between the Macau slice samples and the Portuguese city slices selected by the algorithm: (a) the similarity between the samples from the Macau Peninsula and the Portuguese city slices selected by the algorithm; (b) the similarity between the samples from Macau’s outlying island and the Portuguese city slices selected by the algorithm.
4.2. Locality comparison of urban space
Furthermore, the researchers use the cosine similarity algorithm to obtain city slices with a high level of similarity between Macau and Portugal and compare them in terms of specific morphology. Among the 101 groups of slices from the Macau Peninsula, the researchers compare and analyze slices with high levels of similarity and find the following 4 aspects of morphological characteristics through the distribution characteristics, namely, street traffic network shape, street block shape, buildings, and square open space.
4.2.1. “Street networks” form in the Macau Peninsula
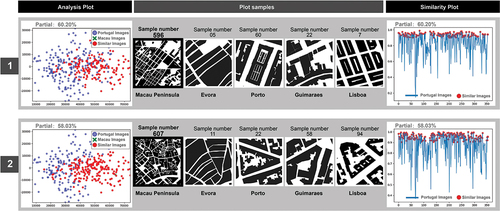
From the Macau city slices selected by the cosine similarity algorithm, the morphological distribution characteristics of the street network can be summarized into two types: a “grid-like” rectangular road network form and a “grid-like” irregular road network form. Group 1 in shows that Macau Peninsula slice sample No. 596 has a very regular “grid-like” road network. The corresponding Portuguese city slice sample also has this feature, with a similarity of 60.20% to the Macau Peninsula slice sample, among which the grid-like road network distribution of Évora, Porto, and Lisboa is particularly obvious. In addition, in Macau Peninsula slice sample No. 607, there is an obvious “grid-like” street network form, which is 58.03% similar to the corresponding Portuguese urban slice sample. The urban road network of Evora, as identified by machine learning algorithms, is the most typical. The city samples of Porto, Guimaraes, and Lisboa also present the form of street blocks, with sharp corners in the cobweb-like streets (group 2 in ).
Figure 16. Street network form in the Macau Peninsula: a morphological comparison between samples from the Macau Peninsula and algorithmically identified slices of Portuguese cities (group 1 represents the serial number and similarity between Macau Peninsula sample slice No. 596 and similar sample slices from the other four Portuguese cities. Group 2 represents the serial number and similarity between Macau Peninsula sample slice No. 607 and similar sample slices from the other four Portuguese cities).
This staggered street network is also known as the Rua Direita pattern. In Macau, the basic pattern of early urban planning and construction is very different from that of traditional cities in the Chinese mainland. In the middle of the 16th century, the Portuguese settled in Macau. The people who came to settle in Macau were not only Portuguese but also a large number of foreign missionaries, such as Catholics and Jesuits. In Pei Xinghua’s “Catholic Missions in China in the Sixteenth Century”, it is mentioned that “in 1563, there were approximately 50,000 people in Macau, including approximately 900 Portuguese and at least 8 Jesuits.” Therefore, with the arrival of the Portuguese, Western religions were gradually introduced into Macau. As early as the 16th century, European countries and cities began entering the Renaissance era; with architects being affected by the trend of thought of the Renaissance movement, a large number of Renaissance styles began to appear in urban architecture. For example, architects at that time were very persistent and focused on order and proportion, and the facade and plane composition of such buildings also continued the column system that stemmed from classical architecture. However, Portugal at that time was a country where religious forces occupied an enormous amount of power, causing its ideological system and architectural culture to remain in the Middle Ages (Cheng Citation1999). Therefore, whether in Macau or the port of Portugal, which expanded along the coast at the same time, the embodied architectural style still evidences strong medieval characteristics.
The ideological background at that time gradually influenced the concept of urban construction in Macau; the most direct embodiment was the Rua Direita pattern. The traditional cities built in the Portuguese medieval period have a strong religious color, and almost every city has a Rua Direita pattern. Macau, which was once ruled by Portugal, is no exception; it also reflects the influence of Portugal’s medieval urban planning tradition in China (Amado Citation2012; IS and IZ Citation2005). In Portuguese cities, the Rua Direita pattern does not mean “straight” in the literal sense; in contrast, it often consists of twists and turns. The church occupies the central position of the city’s core, and the Rua Direita pattern aims to connect the most important buildings and squares in the city and then distribute the entire road network from this center, forming a networked urban road system. This represents the most important and core street network in Portugal’s urban construction.
Macau’s urban construction also abides by this tradition. In approximately 1557, a Rua Direita began on the Macau Peninsula near the present Rua do Tarrafeiro in Macau. It connects to the Church of Santo António (Igreja de Santo António), goes directly to Ruínas de São Paulo, and expands in the direction of Igreja de São Domingos, Largo do Senado, and Rua dos Mercadores. Then, it connects to Rua Central in the direction of Praia Grande and expands in the direction of Igreja de São Lourenço. This area is the backbone of the Rua Direita on the Macau Peninsula. It can be seen that the Rua Direita is based on such a street system network, connecting two core largos; one is Largo da Companhia de Jesus, and the other is Largo do Senado. Rua do Tarrafeiro, Rua de Santo Antonio, Rua de S. Paulo, Rua dos Mercadores, and Rua Central extend to both sides as fishbone-style main streets, gradually forming the street network of Macau city. This further demonstrates that, despite being based on image analysis, the outcomes of machine learning algorithms are also consistent with historical development data.
4.2.2. “Street blocks” form in the Macau Peninsula
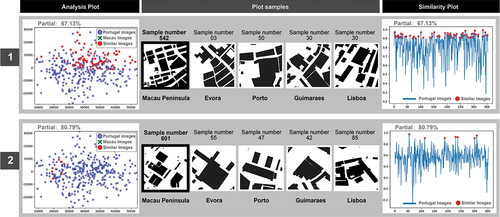
There are two types of street blocks with a high level of similarity in the outline shape of the Macau Peninsula. One is a regular rectangular street block based on a grid-like road network, and the other is a street block formed by building groups. It can be seen from group 1 of that Macau Peninsula slice sample No. 542 shows a regular rectangular street block, and its similarity with the Portuguese city slice is 67.13%. This regular rectangular street block forms a regular rectangular street block along with the unified direction of the road. Evora and Lisboa are more typical, presenting regular rectangular street block shapes with different densities. Macau Peninsula slice sample No. 601 shows that the street block space formed by building groups, which is 80.79% similar to the Portuguese city slice with this type of spatial characteristic (group 2 in ).
Figure 17. Street block form in the Macau Peninsula: a morphological comparison between samples from the Macau Peninsula and algorithmically identified slices of Portuguese cities (group 1 represents the serial number and similarity between Macau Peninsula sample slice No. 542 and similar sample slices from the other four Portuguese cities. Group 2 represents the serial number and similarity between Macau Peninsula sample slice No. 601 and similar sample slices from the other four Portuguese cities).
4.2.3. Form and distribution of squares and open space in the Macau Peninsula
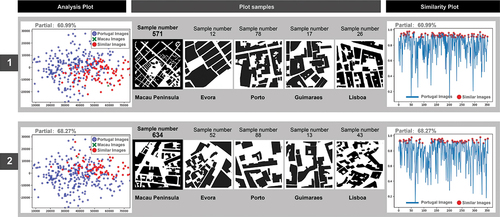
In terms of open spaces in the squares of the Macau Peninsula, there are two types of open spaces that are more similar to those found in Portuguese cities: square open spaces with “clear boundaries” and square open spaces “without obvious boundaries”. It can be seen from group 1 of that Macau Peninsula slice sample No. 571 shows a square open space with “clear boundaries”, and this morphological feature has a similarity of 60.99% with the corresponding Portuguese city slice. A square with clear boundaries is usually surrounded by buildings on four sides. This morphological feature can be clearly seen in the city slices from Evora and Lisboa. Macau Peninsula slice sample No. 634 shows a square open space with “no obvious boundaries”, and the similarity of this spatial form with the corresponding Portuguese urban slice is as high as 68.27%. Since there is no obvious boundary enclosure, the spatial form of this square open space is more fragmented and disorderly (group 2 of ).
Figure 18. Form and distribution of square and open space in the Macau Peninsula: a morphological comparison between samples from the Macau Peninsula and algorithmically identified slices of Portuguese cities (group 1 represents the serial number and similarity between Macau Peninsula sample slice No. 571 and similar sample slices from the other four Portuguese cities. Group 2 represents the serial number and similarity between Macau Peninsula sample slice No. 634 and similar sample slices from the other four Portuguese cities).
4.2.4. Form and distribution of buildings in the Macau Peninsula
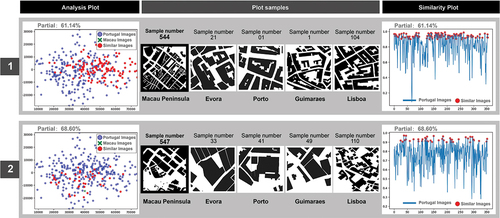
In terms of the architectural form of the Macau Peninsula, the forms with a high degree of similarity can also be classified into two categories. One type is the “enclosed type”, that is, buildings that contain public spaces, atria, squares, and event venues. The other type is the “closed type”, that is, single buildings without internal public areas. It can be seen from group 1 of that the Macau Peninsula sample slice No. 544 shows the morphological characteristics of “enclosed” buildings, and the similarity with the corresponding Portuguese city slice is 61.14%. This architectural form, which is surrounded by buildings to form an internal public space, shows the inclusiveness of the building to the inside and outside. Macau Peninsula slice sample No. 547 shows a common single building form, which is 68.60% similar to the corresponding Portuguese city slice with this type of spatial characteristic (group 2 in ).
Figure 19. Form and distribution of buildings in the Macau Peninsula: a morphological comparison between samples from the Macau Peninsula and algorithmically identified slices of Portuguese cities (group 1 represents the serial number and similarity between Macau Peninsula sample slice No. 544 and similar sample slices from the other four Portuguese cities. Group 2 represents the serial number and similarity between Macau Peninsula sample slice No. 547 and similar sample slices from the other four Portuguese cities).
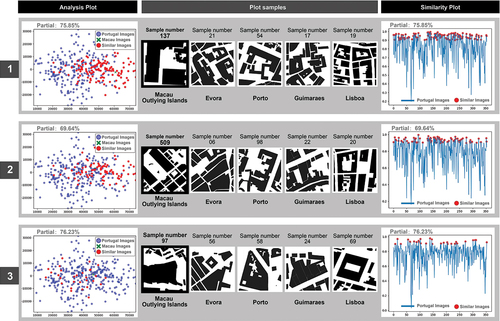
Furthermore, among the 66 groups of slices from Macau’s outlying islands, the researchers compare and analyze the slices with a high level of similarity and obtained three types of forms: “street blocks”, “squares and open spaces,” and “large-scale building complexes” ().
Figure 20. A morphological comparison between samples from the Macau outlying islands and algorithmically identified slices of Portuguese cities (group 1 represents the serial number and similarity between sample slice No. 137 from the Macau outlying islands and similar sample slices from the other four Portuguese cities. Group 2 represents the serial number and similarity between sample slice No. 509 from the Macau outlying islands and similar sample slices from the other four Portuguese cities. Group 3 represents the serial number and similarity between sample slice No. 97 from the Macau outlying islands and similar sample slices from the other four Portuguese cities.).
4.2.5. “Street block” form in the Macau outlying islands
In terms of the architectural form of Macau’s outlying islands, the forms with a high degree of similarity can be summarized as “enclosed” street blocks, that is, block space enclosed by buildings. Slice sample No. 137 from Macau’s outlying islands shows the morphological characteristics of “enclosed” street blocks, and the similarity with the corresponding Portuguese city slice is 75.85%. This enclosed street block space is similar to the “enclosed” architectural form found on the Macau Peninsula. The difference is that the enclosed space on the outlying islands is enclosed by buildings of different volumes (group 1 in ).
4.2.6. Form and distribution of squares and open spaces in the outlying islands
The shape of squares and open spaces in Macau’s outlying islands is similar to that found in Portuguese city slices, with certain boundaries and “regular” squares and open spaces. Slice sample No. 509 of Macau’s outlying islands shows the morphological characteristics of “regular” squares and open spaces, and the similarity with the corresponding Portuguese city slice is 69.64%. These well-formed squares and open spaces are surrounded by large buildings, presenting a larger rectangular square space in the same city (group 2 in ).
4.2.7. “Large-scale building complex” form in the outlying islands
The planning and construction of Macau’s outlying islands are relatively recent and more modern than those of the Macau Peninsula. Judging from the sliced samples of buildings, there are many modern “large-scale building complexes”. Slice sample No. 97 from Macau’s outlying islands shows an urban space dominated by a “large-scale building complex”, which is 76.23% similar to the corresponding Portuguese city slice (group 3 in ). The morphological distribution of large buildings is mainly related to the gaming-tourism-led development of modern cities. In the outlying island area, the most obvious plan for expansion is the Cotai city reclamation plan that has been in place since the 1990s, which connects the two originally independent islands of Taipa and Coloane (Edmonds and Kyle Citation1998; Pinheiro and Wan Citation2007). After the opening up of the Macau gaming industry, Cotai was repositioned to develop the tourism and gaming industries. Many gaming companies have invested in the construction of flagship hotels in Cotai, which has become an important pillar of the modern tourism industry (Simpson Citation2018; Wan and Pinheiro Citation2011). Under the operation of the tourism economy, using the 2005 East Asian Games as an opportunity, a number of sports venues were further built in Cotai city, including the Macau East Asian Games Stadium and the Macau International Shooting Center. During this period, Macau International was completed, and the area entered the era of air transport. To date, the area has formed important modern urban form features such as sea, land, and air multitraffic; high-end hotel buildings; World Heritage history and culture sites; high-rise residential areas; and sports building clusters, all of which act as international gateways with high-speed operation. Therefore, the modern urban texture area of Macau’s outlying islands detected by machine learning is not very similar to that of Portuguese cities.
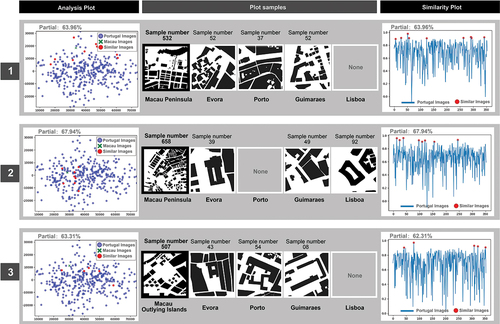
Although the image of Macau city obtained through the object detection algorithm of machine learning has many similarities with the four examined Portuguese cities, there are still cases where the similarity level is high but the actual samples are not similar. For example, as shown in group 1 of , compared with the corresponding Portuguese city slice sample, Macau Peninsula sample No. 532 is not similar in regard to urban street network, street block shape, or building volume. Although the Macau Peninsula sample No. 658 shown in group 2 of is similar to the four selected Portuguese city slice samples in terms of urban street shape, they are not similar in terms of building volume. As seen in group 3 of , in sample No. 507 from Macau’s outlying islands, although the enclosed form of the open space in the city square is similar, there is a large gap between the shape of the street block and the volume of the building.
Figure 21. The similarity between the Macau samples and the Portuguese city slice samples selected by the algorithm is low (group 1 represents the serial number and similarity between Macau Peninsula sample slice No. 532 and similar sample slices from the other four Portuguese cities. Group 2 represents the serial number and similarity between Macau Peninsula sample slice No. 658 and similar sample slices from the other four Portuguese cities. Group 3 represents the serial number and similarity between sample slice No. 507 of the Macau outlying islands and similar sample slices from the other four Portuguese cities.).
5. Conclusions
From the perspective of machine learning, this study uses the object detection method of the YOLOv4 model and the similarity matrix method based on cosine similarity to compare images and draws some conclusions about the correlation between Portugal and Macau from the urban area textures of both locations. These conclusions can serve as a reference for the subsequent development of specialty tourism.
Experiments show that the YOLOv4 algorithm is both efficient and accurate. It can help identify and locate target objects in architectural textures; for example, it can help researchers quickly obtain similar area slice classifications in urban forms. This method provides more accurate analysis and comparison results and is suitable for processing large amounts of image data.
When comparing the architectural textures of Portugal and Macau, cosine similarity can be used to calculate the similarity between these areas. Cosine similarity can ignore the absolute size of the vector and pay more attention to the direction between the vectors, which has certain advantages for the comparison of texture features.
The YOLOv4 algorithm recognizes the largest number of slices in the similarity between Macau and Lisboa. The similarity between Macau and Lisboa is the highest, followed by that between Macau and Porto and between Macau and Evora, while that between Macau and Guimaraes is the lowest. When considering the development of cultural tourism with Portuguese characteristics, the theme of activities in urban space can be prioritized among the cities with the highest levels of similarity.
Comparing the slices of Macau city obtained through the cosine similarity algorithm with the city slices with high levels of similarity in Portugal, we find the following: “street networks”, “street blocks”, squares, and open spaces form in the Macau Peninsula, while “street blocks” and “large-scale building complexes” form in the outlying islands. These different types of potential tourism areas with Portuguese cultural characteristics can be developed in combination with performances of different scales.
In addition, there are certain limitations to this study. (1) The study’s data source consists of map spatial information, which necessitates the support of reliable information. If such information cannot be obtained due to local policies, it may make it difficult to carry out the research. (2) The comparison of the urban forms of Portugal and Macau in this study is mainly based on their historically similar cultural backgrounds; thus, this study has found related results and answers. However, if two unrelated cities were to be compared, disappointing experimental results might be obtained. (3) Despite not having an urban texture of the same cultural background, urban spaces with similar texture layouts can also quickly be identified as tourism-potential areas due to their characteristic cultures. However, when subsequently entering the development process, individual case evaluations are still needed, such as evaluating whether the site is reasonable and the property rights of the buildings involved.
In any case, through this study, researchers can see the potential of applying machine learning algorithms to mine characteristic tourism potential areas from the perspective of the urban fabric. While the comparative study of Portuguese and Macau architectural texture using these two methods is not limited to the application outlined in this study, it can serve as a reference and provide inspiration for other related research fields. The advantages and characteristics of the described methods give them extensive application value in the fields of texture analysis, image processing, and target recognition; they also provide new ideas and methods for related research. In the future, these methods can also be properly combined with the expansion design, planning, and protection of historical blocks. For example, one could compare the shape of blocks in the prepared planning plan with the urban area’s style of architectural protection to see whether the similarity level of the building texture is high or low and subsequently judge whether the prepared design plan is reasonable. Alternatively, if multiple urban agglomerations with similar cultural backgrounds and similar architectural styles want to carry out regional tourism activities, this method can be used to conduct preliminary tourism spatial planning analysis. As they are limited by technical conditions and time factors, the processes of target sampling and slice extraction still need to be improved in the follow-up, such as by increasing the number of samples, improving the resolution of urban morphology image slices, and other measures.
Author contributions
Conceptualization, Y.C. and L.Z.; methodology, Y.C. and L.Z.; software, Y.C. and L.Z.; validation, Y.C., L.Z. and L.Y.; formal analysis, Y.C., L.Z. and L.Y.; investigation, Y.C., L.Z. and L.Y.; resources, Y.C., L.Z. and L.Y.; data curation, Y.C., L.Z. and L.Y.; writing – original draft preparation, Y.C., L.Z. and L.Y.; writing – review and editing, Y.C., L.Z. and L.Y.; visualization, Y.C.; supervision, Y.C. and L.Y.; project administration, Y.C. All authors have read and agreed to the published version of the manuscript.
Acknowledgements
This research first originated in 2022. Yile Chen would like to thank her doctoral thesis advisor, Class-1 Certificated Architect & Urban planner of China, Macau Architect, Associate Professor Dr. Jianyi Zheng, for providing many innovative ideas for the development of the research. At the same time, I would also like to thank my junior brother, Shan Jiang, for his communication and inspiration in the preliminary research.
Disclosure statement
No potential conflict of interest was reported by the author(s).
Data availability statement
Research data of this study are included in this published article. Further information is also available from the Yile Chen on reasonable request.
Additional information
Funding
Notes on contributors
Yile Chen
Yile Chen is a PhD candidate in architecture at the Faculty of Humanities and Arts, Macau University of Science and Technology. She is a Master of Urban Planning and Design and graduated from the Faculty of Innovation and Design, City University of Macau. She has published more than 10 papers in SCIE, SSCI, and A&HCI journals in the International Journal of Architectural Heritage, Open House International, Journal of Asian Architecture and Building Engineering, Buildings, and Frontiers in Earth Science, Atmosphere, and Sustainability. Her research interests are urban design and renewal in Macau, urban from, machine learning (YOLO and CGAN).
Lina Yan
Lina Yan is a PhD candidate in architecture at the Faculty of Humanities and Arts, Macau University of Science and Technology. Her research interests are urban design and renewal. At the same time, she is also an excellent architect at Shanghai Total Architectural Design & Urban Planning Co., Ltd.
Liang Zheng
Liang Zheng is a PhD candidate in architecture at the Faculty of Humanities and Arts, Macau University of Science and Technology. His research interests include sustainable architectural design.
References
- Akgün, A., B. Çizel, and E. Ajanovic. 2022. “Mining Excursion Tourist Profile Through Classification Algorithms.” Quality & Quantity 56 (4): 2567–2588. https://doi.org/10.1007/s11135-021-01234-3.
- Almeida, J., C. Costa, and F. N. Da Silva. 2017. “A Framework for Conflict Analysis in Spatial Planning for Tourism.” Tourism Management Perspectives 24:94–106. https://doi.org/10.1016/j.tmp.2017.07.021.
- Aly, M. N., N. Hamid, N. E. Suharno, N. Kholis, and E. N. Aroyandini. 2021. “Community involvement and sustainable cave tourism development in tulungagung region.” Journal of Environmental Management & Tourism 12 (2): 588–597. https://doi.org/10.14505//jemt.v12.2(50).28.
- Amado, A. 2012. “A“Rua Direita” Nas Cidades Portugueseas. Leitura Tipo-morfológica Do Elemento Urbano (Doctoral dissertation, Universidade Tecnica de Lisboa (Portugal)).” Lisboa: FA. Tese de Mestrado. https://www.repository.utl.pt/handle/10400.5/5449.
- Ampountolas, A., and M. P. Legg. 2021. “A Segmented Machine Learning Modeling Approach of Social Media for Predicting Occupancy.” International Journal of Contemporary Hospitality Management 33 (6): 2001–2021. https://doi.org/10.1108/IJCHM-06-2020-0611.
- Andariesta, D. T., and M. Wasesa. 2022. “Machine Learning Models for Predicting International Tourist Arrivals in Indonesia During the COVID-19 Pandemic: A Multisource Internet Data Approach.” Journal of Tourism Futures. https://doi.org/10.1108/JTF-10-2021-0239.
- Ansari, N., S. Tyagi, N. Mehrwal, N. Rastogi, S. Chibber, M. Memoria, R. Kumar, and A. Gupta 2022, May. “A Critical Insight into the Impact of Technology in Transformation of Tourist Business into Smart Tourism.” In 2022 International Conference on Machine Learning, Big Data, Cloud and Parallel Computing (COM-IT-CON), 1, 832–837. IEEE. https://doi.org/10.1109/COM-IT-CON54601.2022.9850779
- Arefieva, V., R. Egger, and J. Yu. 2021. “A Machine Learning Approach to Cluster Destination Image on Instagram.” Tourism Management 85:104318. https://doi.org/10.1016/j.tourman.2021.104318.
- Cepeda-Pacheco, J. C., and M. C. Domingo. 2022. “Deep Learning and Internet of Things for Tourist Attraction Recommendations in Smart Cities.” Neural Computing and Applications 34 (10): 7691–7709. https://doi.org/10.1007/s00521-021-06872-0.
- Chan, R. C. 2016. “Urban Development of Macao: Challenges and Opportunities.” China City Planning Review 25 (1): http://www.oriprobe.com/journals/caod_424.html.
- Cheng, C. M. B. 1999. Macau: A Cultural Janus. Vol. 1. Hong Kong, China: Hong Kong University Press.
- City University of Macau. 2021. “City University Scholars Call for Attention to Research on Sino-Portuguese Cultural Heritage Protection to Promote Macau Platform Construction and Industrial Diversification.” https://rmo.cityu.edu.mo/news_list/68.
- Claveria, O., E. Monte, and S. Torra. 2016. “Combination Forecasts of Tourism Demand with Machine Learning Models.” Applied Economics Letters 23 (6): 428–431. https://doi.org/10.1080/13504851.2015.1078441.
- Claveria, O., E. Monte, and S. Torra. 2018. “A Regional Perspective on the Accuracy of Machine Learning Forecasts of Tourism Demand Based on Data Characteristics.” Documents de Treball (IREA) (5): 1. https://www.ub.edu/irea/working_papers/2018/201805.pdf.
- Cultural Affairs Bureau. 2022. “Arts and Cultural Festival Between China and Portuguese-Speaking Countries.” https://www.icm.gov.mo/fcp/2022/en/.
- Dede, O. M., and A. M. Ayten. 2012. “The Role of Spatial Planning for Sustainable Tourism Development: A Theoretical Model for Turkey.” Tourism: An International Interdisciplinary Journal 60 (4): 431–445. https://hrcak.srce.hr/94260.
- Dewangan, A., and R. Chatterjee. 2018. “Tourism Recommendation Using Machine Learning Approach.” In Progress in Advanced Computing and Intelligent Engineering. Advances in Intelligent Systems and Computing, edited by K. Saeed, N. Chaki, B. Pati, S. Bakshi, and D. Mohapatra, Vol. 564. Singapore: Springer. https://doi.org/10.1007/978-981-10-6875-1_44.
- Diwan, T., G. Anirudh, and J. V. Tembhurne. 2023. “Object Detection Using YOLO: Challenges, Architectural Successors, Datasets and Applications.” Multimedia Tools and Applications 82 (6): 9243–9275. https://doi.org/10.1007/s11042-022-13644-y.
- Doroz-Turek, M. 2023. “Living Traces of History–Portuguese Approach to Conservation on the Example of Religious Buildings in Lisboa.” Structure and Environment 15 (2): 99–112. https://doi.org/10.30540/sae-2023-010.
- dos Santos, J. C. M. 2020. “Macau and China–Portuguese-speaking Countries Relations: From Nation (Place) Branding to Soft Power.” In Macau 20 Years After the Handover, 36–53. Routledge. https://doi.org/10.4324/9780429323157-5.
- Dowling, R. 1993. “An Environmentally-Based Planning Model for Regional Tourism Development.” Journal of Sustainable Tourism 1 (1): 17–37. https://doi.org/10.1080/09669589309450698.
- Dudzic-Gyurkovich, K. 2014. Transformations of Historic Urban Tissue in Lisboa. https://repozytorium.biblos.pk.edu.pl/redo/resources/25711/file/suwFiles/DudzicGyurkovichK_TransformationsHistoric.pdf.
- D’Urso, P., L. De Giovanni, M. Disegna, and R. Massari. 2013. “Bagged Clustering and Its Application to Tourism Market Segmentation.” Expert Systems with Applications 40 (12): 4944–4956. https://doi.org/10.1016/j.eswa.2013.03.005.
- Edensor, T. 2001. “Performing Tourism, Staging Tourism: (Re) Producing Tourist Space and Practice.” Tourist Studies 1 (1): 59–81. https://doi.org/10.1177/146879760100100104.
- Edensor, T. 2007. “Mundane mobilities, performances and spaces of tourism (Les mobilités banales, les performances et les espaces du tourisme Movilidades, representaciones y espacios rutinarios del turismo).” Social & Cultural Geography 8 (2): 199–215. https://doi.org/10.1080/14649360701360089.
- Edmonds, R. L. 1993. “Macau: Past, present and future.” Asian Affairs 24 (1): 3–15. https://doi.org/10.1080/714041200.
- Edmonds, R. L., and W. J. Kyle. 1998. “Land use in Macau: changes between 1972 and 1994.” Land Use Policy 15 (4): 271–292. https://doi.org/10.1016/S0264-8377(98)00021-0.
- Fulin, C. 2021. “Three Major Trends in the Development of Trade in Services During the 14th Five-Year Plan Period.” China Economic Transition= Dangdai Zhongguo Jingji Zhuanxing Yanjiu 4 (2): 12–23. https://doi.org/10.3868/s060-012-021-0017-2.
- Giglio, S., F. Bertacchini, E. Bilotta, and P. Pantano. 2019. “Using Social Media to Identify Tourism Attractiveness in Six Italian Cities.” Tourism Management 72:306–312. https://doi.org/10.1016/j.tourman.2018.12.007.
- Giglio, S., F. Bertacchini, E. Bilotta, and P. Pantano. 2020. “Machine Learning and Points of Interest: Typical Tourist Italian Cities.” Current Issues in Tourism 23 (13): 1646–1658. https://doi.org/10.1080/13683500.2019.1637827.
- Gnanapala, W., and J. A. R. C. Sandaruwani. 2016. “Impacts of Tourism Development in Cultural and Heritage Sites: An Empirical Investigation.” International Journal of Economics & Business Administration 2 (6): 68–78. https://doi.org/10.1016/j.profoo.2016.02.031.
- Han, Q., M. Abreu Novais, and L. Zejnilovic. 2021. “Toward Travel Pattern Aware Tourism Region Planning: A Big Data Approach.” International Journal of Contemporary Hospitality Management 33 (6): 2157–2175. https://doi.org/10.1108/IJCHM-07-2020-0673.
- Hao, Z. 2011. Macau History and Society. Hong Kong, China: Hong Kong University Press.
- Huang, Y., S. Shen, W. Hu, Y. Li, and G. Li. 2022. “Construction of Cultural Heritage Tourism Corridor for the Dissemination of Historical Culture: A Case Study of Typical Mountainous Multi-Ethnic Area in China.” Land 12 (1): 138. https://doi.org/10.3390/land12010138.
- IS, C., and V. IZ 2005. Centro Histórico de Macau classificado como Património Mundial. http://www.gecorpa.pt/Upload/Revistas/Rev28_Pagina17.pdf.
- Jin, Y., and J. Yu 2019. “The Construction Path of “Macao Platform” in the Context of “One Belt One Road”.” In 2nd International Conference on Financial Management, Education and Social Science. https://doi.org/10.23977/FMESS.2019.022
- Kaulen-Luks, S., C. Marchant, F. Olivares, and J. T. Ibarra. 2022. “Biocultural Heritage Construction and Community-Based Tourism in an Important Indigenous Agricultural Heritage System of the Southern Andes.” International Journal of Heritage Studies 28 (10): 1075–1090. https://doi.org/10.1080/13527258.2022.2131882.
- Khan, M. S., M. Woo, K. Nam, and P. K. Chathoth. 2017. “Smart City and Smart Tourism: A Case of Dubai.” Sustainability 9 (12): 2279. https://doi.org/10.3390/su9122279.
- Kruczek, Z., M. Kruczek, and A. R. Szromek. 2018. “Possibilities of Using the Tourism Area Life Cycle Model to Understand and Provide Sustainable Solution for Tourism Development in the Antarctic Region.” Sustainability 10 (1): 89. https://doi.org/10.3390/su10010089.
- Law, R., G. Li, D. K. C. Fong, and X. Han. 2019. “Tourism Demand Forecasting: A Deep Learning Approach.” Annals of Tourism Research 75:410–423. https://doi.org/10.1016/j.annals.2019.01.014.
- Leandro, F. J. 2021. “Tourism as an Instrument of Cultural de-Bordering and Economic Connectivity: The Case of Macau.” In Role and Impact of Tourism in Peacebuilding and Conflict Transformation, 148–163. IGI Global. https://doi.org/10.4018/978-1-7998-5053-3.ch009.
- Legrand, T. R., K. M. R. A. I. Bandara, J. S. Crishani, L. W. P. Uvindu, N. Amarasena, and D. Kasthurirathna 2022, December. “TRIPORA: Intelligent Machine Learning Solution for Sri Lanka Touring Access and Updates.” In 2022 4th International Conference on Advancements in Computing (ICAC), 24–29. IEEE. https://doi.org/10.1109/ICAC57685.2022.10025139
- Licata, M., O. Larentis, C. Tesi, R. Fusco, and R. Ciliberti. 2021. “Tourism in the Time of Coronavirus. Fruition of the “Minor Heritage” Through the Development of Bioarchaeological Sites—A Proposal.” Heritage 4 (2): 759–774. https://doi.org/10.3390/heritage4020042.
- Lin, C. J., and T. S. Lee. 2013. “Tourism Demand Forecasting: Econometric Model Based on Multivariate Adaptive Regression Splines, Artificial Neural Network and Support Vector Regression.” Advances in Management and Applied Economics 3 (6): 1. http://www.scienpress.com/Upload/AMAE/Vol%203_6_1.pdf.
- Lintner, B., and B. Lintner. 2002. The City of the Name of God, 70–135. Blood Brothers: The Criminal Underworld of Asia.
- Li, J., L. Xu, L. Tang, S. Wang, and L. Li. 2018. “Big Data in Tourism Research: A Literature Review.” Tourism Management 68:301–323. https://doi.org/10.1016/j.tourman.2018.03.009.
- Luo, Y., J. He, Y. Mou, J. Wang, and T. Liu. 2021. “Exploring China’s 5A Global Geoparks Through Online Tourism Reviews: A Mining Model Based on Machine Learning Approach.” Tourism Management Perspectives 37:100769. https://doi.org/10.1016/j.tmp.2020.100769.
- Luo, Y., J. He, Z. Yang, J. Wang, and R. Li. 2023. “Exploring the Destination Image Based on the Perspective of tourists’ Expression Using Machine Learning Methods Combined with PLTS-PT.” Soft Computing 27 (9): 5537–5552. https://doi.org/10.1007/s00500-023-07815-8.
- Macau Trade and Investment Promotion Institute. 2021. “Macau Sees New Opportunities by Participating in Greater Bay Area Development.” https://www.ipim.gov.mo/en/publication/issue-313-feb-2021/this-issues-topical-story/.
- Martinez-Galán, E., F. Ilhéu, and H. Zhang. 2022. “The Chinese Special Economic Zones and Foreign Direct Investment in Portuguese-Speaking African Countries: Challenges and Opportunities.” Handbook of Research on Special Economic Zones as Regional Development Enablers 287–310. https://doi.org/10.4018/978-1-7998-7619-9.ch014.
- Masih, M., S. A. Jozi, A. A. M. Lahijanian, A. Danehkar, and A. Vafaeinejad. 2018. “Capability Assessment and Tourism Development Model Verification of Haraz Watershed Using Analytical Hierarchy Process (AHP).” Environmental Monitoring and Assessment 190 (8): 1–16. https://doi.org/10.1007/s10661-018-6823-z.
- Matias, J. C. 2014. Macao, China and Portuguese Speaking Countries.” In China’s Macao Transformed: Challenge and Development in the 21st Century, 331. Hong Kong.
- Mok, K. K. 2012. “Walk to Global Vision: Driving Heritage Development by World Heritage Award: Macau-A Colony with East West Culture.” In ICOMOS 17th General Assembly, 2011-11-27/2011-12-02, Paris, France. [Conference or Workshop Item] http://openarchive.icomos.org/id/eprint/1110/.
- Monica, S., F. Natalia, and S. Sudirman 2018, June. “Clustering tourism object in Bali province using k-means and x-means clustering algorithm.” In 2018 IEEE 20th International Conference on High Performance Computing and Communications; IEEE 16th International Conference on Smart City; IEEE 4th International Conference on Data Science and Systems (HPCC/SmartCity/DSS), 1462–1467. IEEE. https://doi.org/10.1109/HPCC/SmartCity/DSS.2018.00241
- Nilashi, M., K. Bagherifard, M. Rahmani, and V. Rafe. 2017. “A Recommender System for Tourism Industry Using Cluster Ensemble and Prediction Machine Learning Techniques.” Computers & Industrial Engineering 109:357–368. https://doi.org/10.1016/j.cie.2017.05.016.
- O’Regan, M. 2019. “Post-Colonial Macau: Hope and Despair in a World Centre of Tourism and Leisure.” Via Tourism Review 16 (16). https://doi.org/10.4000/viatourism.4469.
- Panawong, N., C. Snae Namahoot, and M. Brückner. 2014. “Classification of Tourism Web with Modified Naïve Bayes Algorithm.” Advanced Materials Research 931:1360–1364. https://doi.org/10.4028/www.scientific.net/AMR.931-932.1360.
- Pannell, C. W., and P. H. Loughlin. 2018. “Macau’s Role as a Recreation/Tourist Center in the Pearl River Delta City-Region. In Hierarchy, Information and Power, edited by H. Gong, 99–120. London: Routledge.
- Papageorgiou, M. 2016. “Coastal and Marine Tourism: A Challenging Factor in Marine Spatial Planning.” Ocean & Coastal Management 129:44–48. https://doi.org/10.1016/j.ocecoaman.2016.05.006.
- Peng, L., L. Wang, X. Y. Ai, and Y. R. Zeng. 2021. “Forecasting Tourist Arrivals via Random Forest and Long Short-Term Memory.” Cognitive Computation 13 (1): 125–138. https://doi.org/10.1007/s12559-020-09747-z.
- Pinheiro, F. V., and P. Wan 2007. “Urban planning practices and scenarios for Macao development.” In 12th Real Estate Society Annual Conference, Macau, China. University of Macau.
- Puspita, D., and S. Sasmita. 2022. “Application of K-Means Algorithm in Grouping of City Tourism City Pagar Alam.” Sinkron: jurnal dan penelitian teknik informatika 7 (1): 28–32. https://doi.org/10.33395/sinkron.v7i1.11220.
- Risteskia, M., J. Kocevskia, and K. Arnaudov. 2012. “Spatial Planning and Sustainable Tourism as Basis for Developing Competitive Tourist Destinations.” Procedia-Social and Behavioral Sciences 44:375–386. https://doi.org/10.1016/j.sbspro.2012.05.042.
- Rochman, E. M. S., A. Khozaimi, I. O. Suzanti, R. Jannah, B. K. Khotimah, and A. Rachmad. 2022. “A Combination of Algorithm Agglomerative Hierarchical Cluster (AHC) and K-Means for Clustering Tourism in Madura-Indonesia.” Journal of Mathematical and Computational Science 12. http://www.scik.org/index.php/jmcs/article/view/7086.
- Rodríguez, J., I. Semanjski, S. Gautama, N. Van de Weghe, and D. Ochoa. 2018. “Unsupervised Hierarchical Clustering Approach for Tourism Market Segmentation Based on Crowdsourced Mobile Phone Data.” Sensors 18 (9): 2972. https://doi.org/10.3390/s18092972.
- Sidorov, G., A. Gelbukh, H. Gómez-Adorno, and D. Pinto. 2014. “Soft Similarity and Soft Cosine Measure: Similarity of Features in Vector Space Model.” Computación y Sistemas 18 (3): 491–504. https://doi.org/10.13053/CyS-18-3-2043.
- Simpson, T. 2018. “Neoliberal Exception? The Liberalization of Macau’s Casino Gaming Monopoly and the Genealogy of the Post-Socialist Chinese Subject.” Planning Theory 17 (1): 74–95. https://doi.org/10.1177/1473095216672499.
- Spooner, P. B. 2016. “Macau’s Trade with the Portuguese Speaking World.” Journal of Global Initiatives: Policy, Pedagogy, Perspective 11 (1): 5. https://doi.org/10.1108/AEDS-08-2015-0035.
- Sun, S., Y. Wei, K. L. Tsui, and S. Wang. 2019. “Forecasting Tourist Arrivals with Machine Learning and Internet Search Index.” Tourism Management 70:1–10. https://doi.org/10.1016/j.tourman.2018.07.010.
- Thakkar, A., J. M. Jadeja, S. V. Rajesh, A. Chavan, G. S. Abhayan, S. Bhandari, and M. G. Thakkar. 2022. “Geoarchaeological Heritage of Kachchh Region, Gujarat, Western India: Geotourism Potentials.” Geoheritage 14 (4): 128. https://doi.org/10.1007/s12371-022-00748-y.
- Tussyadiah, I. 2020. “A Review of Research into Automation in Tourism: Launching the Annals of Tourism Research Curated Collection on Artificial Intelligence and Robotics in Tourism.” Annals of Tourism Research 81:102883. https://doi.org/10.1016/j.annals.2020.102883.
- Ung, A., and T. N. Vong. 2010. “Tourist experience of heritage tourism in Macau SAR, China.” Journal of Heritage Tourism 5 (2): 157–168. https://doi.org/10.1080/17438731003668502.
- Wang, W., N. Kumar, J. Chen, Z. Gong, X. Kong, W. Wei, and H. Gao. 2020. “Realizing the Potential of the Internet of Things for Smart Tourism with 5G and AI.” IEEE Network 34 (6): 295–301. https://doi.org/10.1109/MNET.011.2000250.
- Wan, P., and F. V. Pinheiro 2011. The Development of the Gaming Industry and Its Impact on Land Use. In Gaming, Governance and Public Policy in Macao, edited by Newman M. K Lam, and lan Scott, 19.
- Wiles, C., and G. Vander Stoep 2007, April. “Consideration of Historical Authenticity in Heritage Tourism Planning and Development.” In Proceedings of the 2007 northeastern recreation research symposium, Department of Agriculture, Forest Service, Northern Research Station, 310.
- Wu, J. 2021. “Study of a Video-sharing Platform: The Global Rise of TikTok.” Doctoral dissertation, Massachusetts Institute of Technology. https://dspace.mit.edu/handle/1721.1/139394.
- Wu, S., J. Wang, J. Li, and Y. Jia. 2022. “Planning and Layout of Tourism and Leisure Facilities Based on POI Big Data and Machine Learning.” https://doi.org/10.21203/rs.3.rs-2012228/v1.
- Xia, P., L. Zhang, and F. Li. 2015. “Learning Similarity with Cosine Similarity Ensemble.” Information Sciences 307:39–52. https://doi.org/10.1016/j.ins.2015.02.024.
- Xie, Y., J. Cai, R. Bhojwani, S. Shekhar, and J. Knight. 2020. “A Locally-Constrained YOLO Framework for Detecting Small and Densely-Distributed Building Footprints.” International Journal of Geographical Information Science 34 (4): 777–801. https://doi.org/10.1080/13658816.2019.1624761.
- Xie, G., Y. Qian, and S. Wang. 2021. “Forecasting Chinese Cruise Tourism Demand with Big Data: An Optimized Machine Learning Approach.” Tourism Management 82:104208. https://doi.org/10.1016/j.tourman.2020.104208.
- Yan, L., B. W. Gao, and M. Zhang. 2017. “A Mathematical Model for Tourism Potential Assessment.” Tourism Management 63:355–365. https://doi.org/10.1016/j.tourman.2017.07.003.
- Yang, Y., J. Tang, H. Luo, and R. Law. 2015. “Hotel Location Evaluation: A Combination of Machine Learning Tools and Web GIS.” International Journal of Hospitality Management 47:14–24. https://doi.org/10.1016/j.ijhm.2015.02.008.
- Yeung, Y. M., J. Lee, and G. Kee. 2008. “Hong Kong and Macao Under Chinese Sovereignty.” Eurasian Geography and Economics 49 (3): 304–325. https://doi.org/10.2747/1539-7216.49.3.304.
- Yu, H. 2018, November. “Cultural Exchanges Between China and Portuguese-Speaking Countries: Macao Platform.” In 2018 3rd International Conference on Modern Management, Education Technology, and Social Science (MMETSS 2018), 198–201. Atlantis Press. https://doi.org/10.2991/mmetss-18.2018.41
- Yu, H. 2021. “The Guangdong-Hong Kong-Macau greater bay area in the making: Development plan and challenges.” Cambridge Review of International Affairs 34 (4): 481–509. https://doi.org/10.1080/09557571.2019.1679719.
- Zhang, J., T. Wu, and Z. Fan. 2019. “Research on Precision Marketing Model of Tourism Industry Based on User’s Mobile Behavior Trajectory.” Mobile Information Systems 2019:1–14. https://doi.org/10.1155/2019/6560848.
- Zhao, P., Z. Ma, J. Chen, R. Law, Y. Zhang, and Y. Liu. 2023. “Depicting Urban Multi-Scale Tourist Activity Spaces Using Digital Footprints for Smart Destinations.” Current Issues in Tourism 26 (18): 2965–2980. https://doi.org/10.1080/13683500.2022.2104696.
- Zhou, X., M. Su, G. Feng, and X. Zhou. 2020. “Intelligent Tourism Recommendation Algorithm Based on Text Mining and MP Nerve Cell Model of Multivariate Transportation Modes.” Institute of Electrical and Electronics Engineers Access 9:8121–8157. https://doi.org/10.1109/ACCESS.2020.3047264.
- Zhou, X., M. Su, Z. Liu, Y. Hu, B. Sun, and G. Feng. 2020. “Smart Tour Route Planning Algorithm Based on Naïve Bayes Interest Data Mining Machine Learning.” ISPRS International Journal of Geo-Information 9 (2): 112. https://doi.org/10.3390/ijgi9020112.