
ABSTRACT
The Public-Private Partnership (PPP) is one of the crucial ways to promote the advancement of the Urban Rail Transit Project However, investing in such projects exposes social capital to tremendous risks. To analyze and assess the investment risk of social capital (IRSC), this study utilized the system dynamics (SD) approach to construct an investment risk model. Subsequently, combined with the practical project’s information, the investment risk was assessed, and the impact of boundary risks on the different risk subsystems was analyzed. The results demonstrate the following: (1) the investment risk system comprises three risk subsystems, namely, operating cost, operating revenue, and government subsidy. Among them, the subsidy risk subsystem most significantly influences the IRSC. (2) Of the boundary risks, the design risk and the contractual risk are the most vital factors in preventing and controlling the IRSC. (3) Differences exist in the boundary risks that most affect the regulation of the three risk subsystems. These findings can help social capital determine risk changes and effectively mitigate investment risk. This ability can further attract added social capital into such projects to facilitate the sustainable development of urban infrastructure.
1. Introduction
Among urban infrastructures, urban rail transit (URT) is the lifeblood of the city (Sehgal, Malhotra, and Kapoor Citation2009). It plays a crucial role in managing traffic congestion in various countries due to its environmental protection, high speed, and safety features. Consequently, it has been extensively utilized and developed as “green transport”. Currently, China is one of the best countries in terms of the advancement of URT (Wang and Zhang Citation2021). By the end of 2022, 55 cities in mainland China have opened their URT, with a total length of over 10,287 kilometers of lines in operation (the China Association of Metros, 2022). Given its high construction intensity and large investment amounts, local governments often have difficulty covering the entire URT project’s construction and operation costs. To resolve this problem effectively, the Public-Private Partnership (PPP) has been introduced into such projects, which could relieve local governments’ financial pressure and facilitate the advancement of the URT (Huang, Xu, and Li Citation2022; Wang et al. Citation2023).
PPP is a partnership between the public sector and private enterprises to satisfy the demand for public goods (Cao et al. Citation2023; Fan et al. Citation2023). It has been applied in China’s URT for over ten years. Through excellent collaboration between the government and social capital, it has achieved better financing, construction and operation of projects. The Urban rail transit PPP project (URTP) has different characteristics from traditional construction projects. First, such a project has a great demand for capital and high financing costs. Statistics show China has invested over $84 billion to construct and upgrade URT systems in many cities, including Guangzhou and Wuhan (Li et al. Citation2022). Second, the URTP has a long life cycle and low return on investment. These projects generally have a long partnership life (20–30 years). As a consequence, recovering construction costs and earning profits are challenging in the short term (Huang, Xu, and Li Citation2022). Third, the operation phase is the most critical phase in the project’s life cycle (Xiang et al. Citation2022). The reason may be that factors such as ticket fares, patronage, and government subsidy can all affect the ultimate profitability.
These characteristics above expose social capital to great uncertainty when investing in such a project. It is necessary to conduct the targeted analysis and assessment of the investment risk of social capital (IRSC), which is of great significance to reduce investment risk and attract more capitalists to participate in the URTP. Scholars have studied the risks of URTP and contributed to a certain extent in this field. However, most of the studies have been carried out from the project’s perspective, with less specific research on the risks that the primary stakeholders face. Furthermore, most existing risk assessment models tend to be static. Few studies have identified risk factors based on the different phases of the project, thus making risk assessment slightly less dynamic. The system dynamics (SD) approach, with its systematic, dynamic, and non-linear characteristics, can fill the gaps in existing research. Consequently, we identified the internal and external risks in the different phases of the URTP from the social capital perspective. Then, we used SD to construct the investment risk model of social capital (IRMSC). In this way, combined with practical project information, the impact of each risk factor on the IRSC was simulated, and the influence of boundary risks on different risk subsystems was analyzed as well. This examination intends to provide a basis for the risk decision-making of the social capital.
The remainder of this paper is as follows. Section 2 expounds on the theoretical background. Next, Section 3 identifies the risk factors, and then establishes the IRMSC based on SD. After that, Section 4 applies the model to the Wuhan Metro Line 12 project. Furthermore, it evaluates and analyses the IRSC. Lastly, Section 5 discusses the conclusions, contributions, and limitations.
2. Theoretical background
2.1. Risk management of PPP projects
Public Private Partnership, abbreviated as PPP, originated in the United Kingdom in the 1980s. It is primarily applied to public services such as water supply and transportation, aiming to promote infrastructure construction, ease the financial burden on the government, and establish a new project management model. PPP projects are risky due to the large number of project stakeholders, the long concession term and the complexity of contractual relationships (Cao, Guo, and Li Citation2022). Studies on PPP projects currently concentrate on risk identification, assessment and allocation.
Regarding risk identification, Song et al. (Citation2013) explored the risks of PPP waste incineration projects in China. Then, they identified 10 key risk factors through interviews and other means. Using the Delphi method, Fathi et al. (Citation2023) identified risks affecting PPP road projects and found that design and construction risks were critical. Some scholars have also used questionnaires to explore the risks influencing renewable energy PPP projects. They discovered that political and regulatory barriers are vital risks (Othman and Khallaf Citation2022).
Concerning risk assessment, Grimsey et al. (Citation2002) proposed arisk evaluation framework based on assessment principles and practical project experience to comprehensively assess the risks of the wastewater treatment PPP project in Scotland. Ahmadabadi et al. (Citation2019) constructed arisk assessment framework for large-scale PPP projects using structural equation modelling and then applied it to areal case. They concluded that the identified 32 risks may impact the project’s success via eight paths. In addition, Heydari et al. (Citation2023) assessed and analyzed the corruption risks of PPP projects in South Asian countries and then proposed corresponding countermeasures. Moreover, the Analytic Network Process method was utilized to assess the risks of PPP hydropower investments. The results showed that legal, contractor, and operator risks are vital to reducing overall risk (Akcay Citation2021).
In terms of risk allocation, Shrestha et al. (Citation2019) proposed arisk allocation framework for PPP projects by combining principal-agent theory to achieve the effective and rational allocation of risk. Rafaat et al. (Citation2020) developed arisk allocation scheme for PPP water supply projects in Egypt by conducting structured face-to-face interviews with nine industry professionals. After compared to a similar market in China, they found that the private sector could allocate more risk in amature PPP market. Wang et al. (Citation2023) employed probabilistic linguistic terms to express the strategies of the game players in PPP projects, from which two game models of risk allocation were constructed. The results indicated that the preferred view game model could reflect the actual situation more precisely.
2.2. Risk management of Urban Rail Transit PPP projects
Although most studies in PPP risk management focus on infrastructure projects, only some have examined URT.
These studies have investigated how to reduce the risks of URTP, mainly focusing on risk assessment. For instance, Liu et al. (Citation2021) proposed a risk assessment model based on the Bayesian network to analyze the cause, probability, and sensitivity of risks. Feng et al. (Citation2021) used the fuzzy analytic hierarchy process to assess the project’s risk. They subsequently found that political, legal, and project promotion risks were the most critical factors for prevention and control. Meanwhile, based on the interpretative structural modeling approach, Gao et al. (Citation2021) proposed a risk evaluation model to analyze qualitatively the risk factors that lead to the failure of PPP projects. Xiang et al. (Citation2022) constructed arisk allocation model based on game theory to quantify how risk is shared. They revealed the crucial role the public plays in balancing risk allocation. One study also combined case-based reasoning and ontology technology to construct a risk cost assessment model to analyze the risk of URTP in China empirically (Wang, Lin, and Zhang Citation2022).
2.3. System dynamics
The SD approach was first developed in the 1950s by Professor Jay W. Forrester in the USA to study the causality and dynamics of systems to solve complex, dynamic, and non-linear problems (Hwang et al. Citation2019; Walworth et al. Citation2016). Specifically, based on causal feedback information within the system, computer technology is utilized to simulate and analyze the dynamic associations between systematic structure and behavior patterns (Liu et al. Citation2023).
The SD model mainly consists of causality and flow-stock diagrams (Rachmawati and Kim Citation2023). The causality diagram can qualitatively describe the causal feedback relationships between the elements within the system, with the relationships between variables expressed visually through causal chains. The arrow with a “+” sign indicates the positive causal chain, contributing to the risk factor to which the arrow is pointing (Tang et al. Citation2021). Conversely, the “-” arrow indicates negative causal chains acting as inhibitors. A feedback loop is formed when the chain of causality between variables forms a closed circuit (Zhang et al. Citation2022). On the basis of the causality diagram, the system variables are analyzed quantitatively to obtain the flow-stock diagram, which describes the management and control processes of the system (Wang et al. Citation2018). Notably, the diagram has four main types of variables: the level variable, rate variable, auxiliary variable, and constant (Hell and Petric Citation2021; Liu et al. Citation2022). To be specific, the level variable indicates the system variable with the cumulative effect. The rate variable represents the amount of change in the value of the level variable per unit of time. Auxiliary variables are intermediate variables between the level and rate variables. They denote the transfer and transformation of information within the system. After creating the flow-stock diagram, the functional relationship should be established for each variable in the system so that simulations can be conducted.
It is well known that simulation is an effective means for studying the changes in risk in such complex systems. As one of the most commonly used simulation methods, SD can simulate the complexity of real systems with a smaller amount of data, so systems’ internal structure and causal feedback mechanisms could be explored dynamically (Rathore, Thakkar, and Jha Citation2021). This method greatly assists managers in their decision-making. As a result, scholars have gradually applied SD to the field of the risk assessment of complex systems in recent years. For example, Liu et al. (Citation2017) constructed the SD-based investment risk model for renewable energy. This model assesses the investment risk of projects, leading to optimal investment decisions. Xue et al. (Citation2020) applied SD to a high-speed railway project to assess the level of risk. Additionally, SD has been used in other areas of risk assessment, such as industrial activities (Garbolino, Chery, and Guarnieri Citation2016) food transportation (Rathore, Thakkar, and Jha Citation2021) and disaster simulation (Liu et al. Citation2021). It is clear from these studies that SD has significantly contributed to the risk management of large and complex systems.
In recent years, system dynamics has also been extensively utilized in the management of PPP projects. Scholars exhibit variations in their chosen research objects for such projects; however, they all rely on this method for conducting the corresponding simulation and evaluation. For instance, some scholars employed SD in the risk management of PPP projects to quantify the impact of various risk factors (Liu et al. Citation2022). Some scholars focused on assessing such projects’ finance and social sustainable management strategies (Pagoni and Patroklos Citation2019). Other scholars evaluated the sustainability of the project (Wang et al. Citation2023). These studies above establish the fundamental basis for this paper’s subsequent modelling and analysis.
2.4. Knowledge gaps
The literature mentioned above can provide some insights for exploring the URTP. First, risk identification methods consist primarily of literature analysis, case studies, interviews, and questionnaires. Second, the risk assessment and allocation methods should be chosen based on the characteristics of the research object and then combined with the actual case for a more precise analysis. Third, applying system dynamics to risk management in PPP projects possesses rationality. However, there are some research gaps. To begin with, most of the current studies stand from the perspective of the project itself without specific research from the perspective of the various participants. Additionally, most existing literature is biased toward identifying and assessing risks from the static perspective and fails to consider the dynamic nature of risks fully. As a result, these gaps in the research should be filled by examining the risks the main stakeholders face from a dynamic perspective.
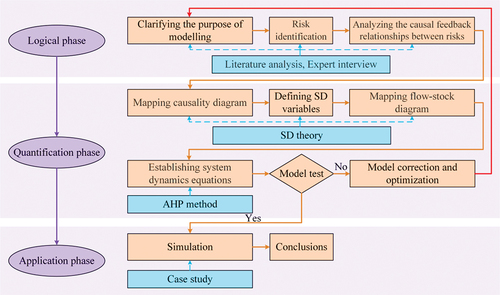
Based on the above analysis, SD was used to construct the IRMSC in this paper, which can achieve the systematic, dynamic continuum based on the causality diagram and the flow-stock diagram, as well as the clarification of the changing trend in the IRSC. illustrates the SD-based modelling process of this study.
Figure 1. The SD-based modelling process.
3. Investment risk modelling based on system dynamics
3.1. Risk identification
Before assessing the IRSC, risk identification ought to be conducted. In the process, we first interviewed staff and researchers who have worked on the URTP. They identified the main risk factors through the brainstorming method. Then we supplemented the risk factors accordingly with relevant literature. In general, this paper identified the main risk factors based on the perspective of social capital from the external environment and the key stakeholders.
3.1.1. Risk from external environment
Concerning the external environment, PEST analysis was utilized to identify risks in four aspects: politics, economy, society, and technology (Wang et al. Citation2022). In political terms, legislation change may result in losses for a wide range of stakeholders, which can impede the achievement of project objectives (Aladag and Isik Citation2022). A mature and well-developed legal environment is essential to sustain the construction and operation of PPP projects (Maslyukivska and Sohail Citation2007). In economic terms, interest rate fluctuation can increase the cost of financing for investors (Zou, Wang, and Fang Citation2008). Inflation can raise the cost of raw materials and labor, increasing the project cost (Musarat, Alaloul, and Liew Citation2021). In addition, exchange rate fluctuation could severely affect the future profitability of the project, as well as the desired project outcome (Ehrlich and Tiong Citation2012). In social terms, force majeure, such as natural disasters and public health events, can seriously impact and even damage the project (Ng and Loosemore Citation2007). During construction, the project’s schedule, quality, and cost are greatly influenced by natural factors, such as weather, hydrology, geology, and surrounding conditions. Hence, natural risk cannot be ignored (Bing et al. Citation2005). Moreover, the URTP is closely related to public interests, which can lead to public resistance and even social conflicts. Consequently, public opposition should be taken seriously (Whiteside Citation2020). In terms of technology, as the URT’s capacity and load-bearing requirements improve, the associated technological difficulties that need to be overcome are becoming increasingly complex. If the engineering technologies are not mature, the expected project standards and requirements will not be met (Chan et al. Citation2011) thus resulting in significant safety and quality risks.
3.1.2. Risk from key stakeholders
Regarding the key stakeholders, this paper focused on the project company that primarily represents the interests of social capital and government regulation to identify relevant risk factors.
On the government side, some actions, such as irregular decision-making, changing decisions for blind economic growth, and excessive intervention, can lead to project failure (Liu et al. Citation2022). In addition, given the changing macro environment, the government may not keep their commitments to other stakeholders, which can easily lead to government credit risk (Zhou and Liu Citation2021). Moreover, many local governments lack experience and expertise in project implementation, which can cause inadequate project supervision. This scenario can exacerbate other stakeholders’ tendency to act opportunistically for their benefit (Liu et al. Citation2017).
On the project company side, risks were identified in the three phases of construction preparation, construction, and operation. Specifically, during the construction preparation phase, social capital’s poor financing ability, single financing channel, and unreasonable financing structure may severely affect the project financing. It is significant to address the financing risk (Gallimore, Williams, and Woodward Citation1997). Furthermore, this phase involves the signing of most contracts. The risk of contractual failure and default in PPP projects should also be considered because of the contract’s long-term duration and the investment’s massive scale (Wang, Shao, and Tiong Citation2021). Notably, financing and contractual risks persist over the whole project’s life (Gallimore, Williams, and Woodward Citation1997; Wang, Shao, and Tiong Citation2021). The design is essential, as it largely determines the quality of the construction project (Aladağ and Işık Citation2019).
During the construction phase, strict control of the project’s schedule, quality, and costs is imperative (Ahmadabadi and Heravi Citation2019; Eskander Citation2018) as they are critical to achieving project objectives (Aladag and Isik Citation2022; Maslyukivska and Sohail Citation2007). In addition, the URT is large in scale, spans many locations, and involves construction in some relatively confined spaces, such as underground. Thus, construction safety management is vital (Zhang et al. Citation2022). Furthermore, contractor credit risk should be taken into account at this stage. Supposing that the contractor fails to fulfill the contract terms due to adverse selection, the likelihood of the project to fail is greater (El-Khalek, Aziz, and Morgan Citation2019).
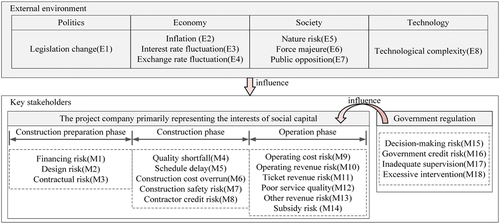
The operation phase poses many uncertain risks, among which operating cost risk and operating revenue risk should be the focus of risk management (Jiang et al. Citation2022). Cost recovery and revenue generation largely determine a project’s success. The quality of the metro service (Duan et al. Citation2020) and other revenue risks (Lee and Eun Citation2022) such as advertising, should also be highlighted in operation. Supposing that the quality of the metro service is poor and the advertisements shown are of low quality, passengers’ satisfaction will drop significantly, thus severely affecting the operating revenue. In addition, the URTP is extremely public spirited and more inclined toward social benefits, which can restrict the setting of metro ticket fares (Kumaraswamy and Zhang Citation2001). Moreover, the government subsidy at this phase is influenced by policy preferences. As such, managing the government subsidy risk is critical (Lv et al. Citation2020). The main risk factors identified based on the literature are shown in
Figure 2. Risk factors of the Urban Rail Transit PPP project (URTP).
3.2. The causality diagram
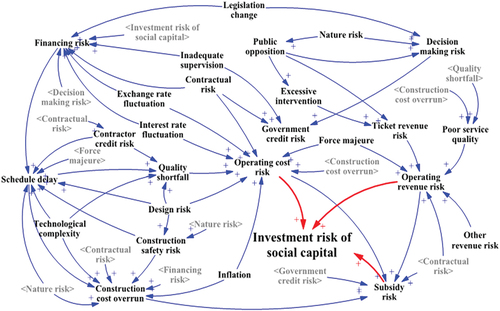
We derived the interrelationships of the identified risk factors through literature analysis and discussions with experts to establish the causality diagram (see ). In the diagram, variables marked with “<>” are shadow variables, which means that they are utilized more than once. As can be seen, the IRSC is influenced by subsidy, operating cost, and operating revenue risks. At the beginning of the project, the capital funds used to construct the UTR can only be recovered during the operation period (Xiang et al. Citation2022). In other words, the social capital investment can only be recovered through government subsidies, user fees, and other revenue. As a result, the risk during the operation period greatly influences the IRSC. Moreover, the model contains 14 causal feedback loops whose specific clarification and explanation can be found in Appendix A.
Figure 3. The causality diagram of investment risk of social capital (IRSC).
3.3. The flow-stock diagram
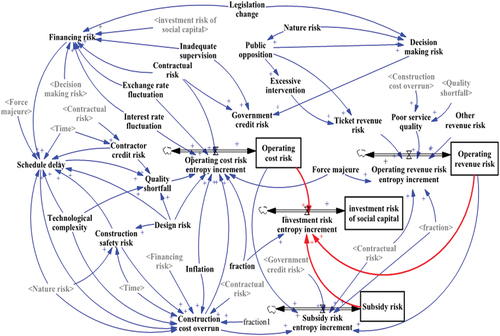
Combined with the SD method, this study further quantified each risk factor based on the causal feedback relationship to establish the flow-stock diagram of IRSC (see ). The diagram contains 4 level variables, 4 rate variables, 12 auxiliary variables, 11 constants, and three risk subsystems for operating cost, operating revenue, and government subsidies. Notably, fraction denotes a constant with a value of 1 and a unit of 1/year, and fraction1 denotes a constant with a value of 1 and a unit of dmnl/year.
Figure 4. The flow-stock diagram of investment risk of social capital (IRSC).
3.4. Establishing SD equations
The SD equations can be classified into two types: linear and non-linear equations. When a linear relationship existed between the independent variable risk and the dependent variable risk, we adopted the 1–9 scale method of the analytic hierarchy process (AHP) to determine the weights of the independent variable risk. Specifically, the significance of each independent variable risk was assessed through the questionnaire (see Appendix B), distributed to seven experts studying the risk management of large-scale PPP projects. Then, the questionnaire was analyzed to obtain the weights for each risk factor. In addition, we utilized the conditional function to express some risk factors with conditional relationships. For instance, the construction safety risk exists only during the construction preparation and construction phases (approximately seven years in total). When the project enters the operation phase, the risk does not exist. Thus, construction safety risk = IF THEN ELSE (Time ≤7, 0.6*Design risk + 0.4*Nature risk, 0).
3.5. Validity test
To verify the accuracy and applicability of the model, a series of tests were conducted as follows.
The causality diagram was used to determine whether the model’s structure was compatible with the study’s objective (Wu et al. Citation2019). As depicted in , the model contains all the critical variables related to the research question and clearly reflects the impact of risk factors at different phases on the IRSC.
Figure 5. Validity test.
According to Wu et al. (Citation2019) and Hou et al. (Citation2022), the dimensional consistency of all equations in the model should be examined. This was done using the “Units Check” function in the Vensim.PLE software, and the results showed that the units are consistent.
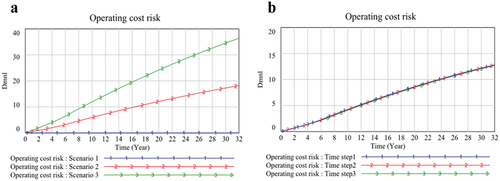
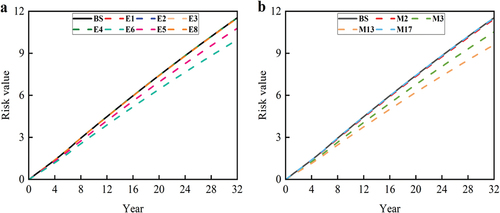
Following Rathore et al. (Citation2021) and Liu et al. (Citation2022), extreme condition tests were conducted to assess whether the model performance was consistent with the expected behavior of the risky system This study conducted simulations by adjusting the boundary risk values to the minimum value of 0 (Scenario 1), the intermediate value of 0.5 (Scenario 2), and the maximum value of 1 (Scenario 3), respectively, to observe the changes in the model under different scenarios. Consider the operating cost risk as an illustration. The finding (see ) indicated that the change in operating cost risk is between the two extreme scenarios when the boundary risk values are 0.5, indicating that the simulation results are realistic.
Referring to Ge et al. (Citation2022), a test for integral error was conducted to determine the impact of the time step on the model. The “TIME STEP” of the model was changed from 0.25 (Time step1) to 0.5 (Time step2) and 1 (Time step3), respectively, to observe the model’s change under the three scenarios. Take the operating cost risk as an example. The results (see revealed that the simulation curves of the operating cost risk for the three scenarios overlapped nearly, indicating that the model’s integration error is small. In conclusion, the model passed the validity test, establishing its suitability for utilization in simulation and analysis purposes.
4. Application of the model in the practical project
4.1. Project overview
Wuhan Urban Rail Transit Line 12, as the main route of the fourth round of construction planning for Wuhan’s URT, is the first metro loop line in Wuhan. The line is divided into two sections, Wuchang and Jiangbei, with 37 stations and a total length of 59.9 kilometers. Moreover, its total investment has exceeded CNY 50 billion. This construction project is a PPP project, which means that the government and social capital jointly have formed the special purpose vehicle (SPV) to finance, construct, and operate the project. Notably, it officially obtained approval from the National Development and Reform Commission in January 2019.
This study combined information on the Jiangbei section of the project for simulation and analysis. The section has 23 stations with a length of 37.9 kilometers. Furthermore, it started construction on 30 November 2020, and is expected to be opened to the public by the end of December 2025. The construction preparation phase spans approximately two years, the construction phase is about five years, and the operation phase is approximately 25 years.
4.2. Numerical estimation of boundary risks
Based on the flow-stock diagram, 11 boundary risk factors of the investment risk system were identified. To assess the numerical values of these boundary risks, we visited some project owners, including the China Railway Construction Corporation Limited, the China Railway Construction Investment Group Corporation Limited, and the China Railway Development Investment Group Corporation Limited. After introducing the purpose of the visit and explaining the 11 boundary risks, questionnaires were distributed to senior managers involved in the project (see Appendix C). We distributed 15 questionnaires and recovered 10 questionnaires, which were all valid. The results of the 10 questionnaires were averaged to obtain the values of boundary risk, as shown in . In the table, the risk value indicates the degree of the risk’s impact on the project, ranging from 0 to 1, with a value closer to 1 indicating a greater impact.
Table 1. Numerical values of boundary risks.
Based on the information and characteristics of the project, the SD equations (see Appendix D) and the relevant parameters were entered into the software. Then, the model simulation was carried out.
4.3. Assessment of the investment risk
The changing trend of the IRSC is depicted in the BS curve in . Over the study period (32 years), the impact of the IRSC on the project continues to grow. To be specific, the growth is slower during the construction preparation phase (0–2 years) and the construction phase (2–7 years). Afterwards, during the operation phase (7–32 years), the value of investment risk increases drastically from 13.70 to 866.07, with an average annual growth rate of 18.04%. This trend is consistent with the findings of Wang et al. (Citation2022). The reason may be the time delay and lag in the development of risk, and that the influence of other risks on IRSC is a long-term process (Wang et al. Citation2022). In the early stage of the project, due to the certainty of project conditions and the predictability of difficulties for social capital, investment risk increases slowly. In the middle and late stages of the project, the SPV is prone to underfunding, mismanagement and cost overruns. At this point, potential risks can be converted into real risks contributing to the dramatic growth of IRSC. This can easily lead to unpreventable consequences.
Figure 6. Changing trends in the investment risk of social capital (IRSC).
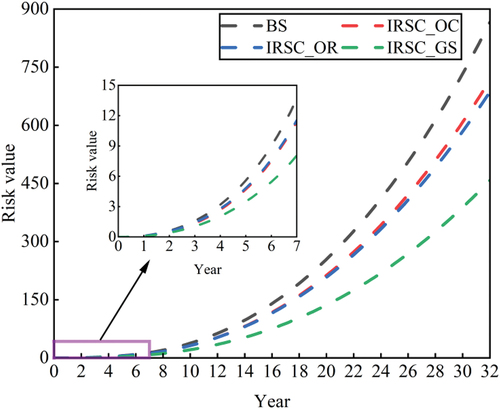
To determine the influence of the three risk subsystems on IRSC, the entropy increment of each risk subsystem was adjusted to reduce by 50% respectively. In doing so, the change in the investment risk can be observed (see ). The IRSC_OC, IRSC_OR, and IRSC_GS curves represent the results obtained by regulating the three risk subsystems of operating cost, operating revenue, and government subsidies.
As can be seen from the diagram, the risk subsystem of government subsidies has the greatest impact on the IRSC, thus reducing its value by 47.13%. In contrast, the operating cost and operating revenue subsystems have a smaller impact on the IRSC, thus causing its value to decrease by 17.23% and 20.73%, respectively. This could be because social capital has difficulty recovering its investment and costs. The minimum acceptable return on investment is harder to achieve by relying solely on the fare and non-fare revenue during the operation period (Bian et al. Citation2021). Without government subsidies, most projects may face a cash flow shortfall, thus making their financial viability extremely poor. Consequently, government subsidies are crucial in ensuring financial viability. Besides, Rahman et al. (Citation2019) have indirectly verified this.
4.4. Analysis of boundary risks
The effect of boundary risk on the total system and the three subsystems can be explored by regulating the original value of the boundary risk on a case-by-case basis to reduce it by 50%. Moreover, the effect can be seen by observing the changes in the IRSC, operating cost risk, operating revenue risk, and government subsidy risk.
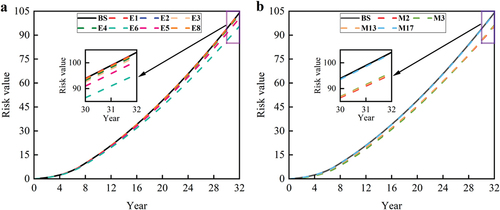
4.4.1. Investment risk system
The simulation results are presented in ), where BS indicates the initial IRSC’s variation curve without controlling any boundary risks. Compared with the BS curve, the decline in the other curves reveals the boundary risks that significantly reduce the IRSC. They are, in order of magnitude: design risk (M2), contractual risk (M3), force majeure (E6), other revenue risk (M13), nature risk (E5), interest rate fluctuation (E3), exchange rate fluctuation (E4), inflation (E2), inadequate supervision (M17), technological complexity (E8), and legislation change (E1).
Figure 7. Simulation results for the investment risk system.
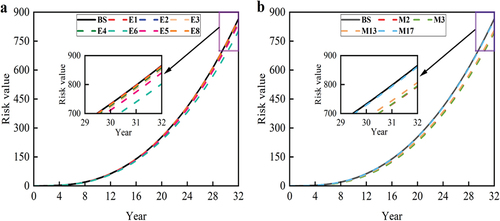
After regulating boundary risks on a case-by-case basis, the maximum value of IRSC can be controlled at [793.79, 865.12], and the overall risk level is reduced by [0.11%, 8.35%]. Notably, the most significant decline in the IRSC is achieved by separately controlling the design risk (M2) and contractual risk (M3), both of which can reduce its final value by more than 8%. Accordingly, these two risk factors are the focus of prevention and control.
4.4.2. Operating cost risk subsystem
The simulation findings, as shown in ), demonstrate that managing the quality risk (M2) and force majeure (E6) separately can mitigate operation cost risk the most.
Figure 8. Simulation results for the operating cost risk subsystem.
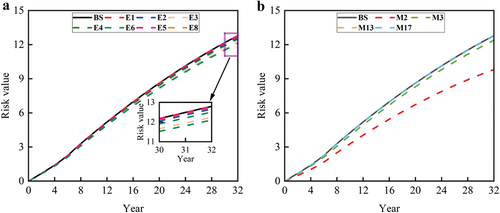
Specifically, as seen in , for boundary risks from the external environment, controlling force majeure is the most effective in reducing operation cost risk, as it has resulted in a 5.43% reduction in its final risk level. Some public health emergencies in recent years, such as COVID-19, have seriously affected people’s lives, incomes, and daily activities. It has also caused a structural imbalance in passenger traffic, which has put unprecedented pressure on the operation of many infrastructure PPP projects (Casady and Baxter Citation2020). However, no solution has addressed the epidemic completely. Hence, the long-term and lasting effects of health events call for the prevention and control of such force majeure. As seen in , among the boundary risks from the scope of the main stakeholders, controlling design risk is the most effective, resulting in a 23.27% decline in the final operating cost risk level. This is probably because poor design quality can seriously affect the project’s quality (Fucic, Soldo, and Ojvan Citation2022) so that the construction cannot play a normal role and function, thus aggravating the later operation and maintenance cost.
4.4.3. Operating revenue subsystem
As can be seen from , the two boundary risks that most affect operating revenue are other revenue risk (M13) and force majeure (E6). Concretely, when the two risk levels are each decreased by 50%, the final operating revenue risk level is lowered by more than 10% in each case. The moderation of other revenue risk has the most significant effect on mitigating operating revenue risk, thus leading to a 16.68% drop in its final level. In China’s URT, non-ticketing revenue contributes significantly to the total operating revenue, accounting for approximately 46.9% (Shanghai E-House Real Estate Research Institute, 2022). Moreover, non-ticketing revenue is unstable and more challenging to obtain than ticket revenue. If the SPV cannot fully exploit the land space resources for secondary development to generate revenue during the operation period, then the total operating revenue will be seriously affected (LIU et al. Citation2022). In this scenario, the company may not meet the need to recover the investment or achieve the pre-determined project profit. As a result, related business areas must be expanded to generate revenue from multiple types of resources.
Figure 9. Simulation results for the operating revenue risk subsystem.
4.4.4. Subsidy risk subsystem
As seen from , adopting the risk prevention strategy allows the maximum value of subsidy risk to be controlled at [95.60, 104.00], and the overall risk level is decreased by [0.07%, 8.14%]. In the figure, the three boundary risks that most affect subsidy risk are force majeure (E6), design risk (M2), and other revenue risk (M13), which reduce its final level by 8.14%, 8.10%, and 7.84%, respectively. Interestingly, managing these three boundary risks can also significantly reduce operating costs and operating revenue risks. The government subsidies granted depend on the operating revenue and costs of the project. If the project’s operational costs are too high and operational revenues are insufficient, the project may require government subsidies. Consequently, this scenario may place a higher demand on the government’s ability.
Figure 10. Simulation results for the subsidy risk subsystem.
5. Conclusions and implications
5.1. Conclusions
This study identified risk factors based on the perspective of the social capital side. Then, SD was used to analyze the causal feedback relationships of factors within the social capital investment risk system to construct the investment risk model. Next, combined with information on the practical project, the IRSC was evaluated. The influence of boundary risk on different risk subsystems was also analyzed. The results show that (1) the investment risk system contains 27 risk factors and comprises three risk subsystems, namely, operating cost, operating revenue, and government subsidy. Among them, the subsidy risk subsystem most significantly influences the IRSC. (2) Furthermore, of the boundary risks, the design risk (M2) and the contractual risk (M3) are the most vital factors in preventing and controlling the IRSC. (3) Differences exist in the boundary risks that most affect the regulation of the three risk subsystems. More specifically, controlling design risk (M2) and force majeure (E6) is critical to the operating cost risk subsystem. As for the operating revenue risk subsystem, regulating other revenue risk (M13) and force majeure (E6) plays the most crucial role. Concerning the subsidy risk subsystem, the prevention and control of M2, M13, and E6 can have the most significant role.
5.2. Implications
5.2.1. Theoretical implications
On the one hand, this paper complements and completes the research in the field of URTP and fills the research gap in this field. Currently, there are more studies on the risk of PPP projects but fewer on URTP. It is well known that different types of projects have different characteristics. In addition to the positive externalities of infrastructure, URTP has the nature of quasi-public goods, making them different from other projects in risk management (Liao Citation2016). Moreover, few studies have investigated the risk of URTP from the social capital perspective. In fact, risk avoidance and control is the key to social capital participating in such projects. How to allow social capital to operate in PPP projects in a stable and long-term manner has also been a concern of the nation in recent years. As a consequence, it is necessary and innovative to analyze and assess the risks social capital faces in investing in the URTP from its perspective. Not only will this enhance the motivation of social capital to participate in such projects, but it will also contribute to advancing large-scale urban infrastructure. Additionally, the findings of this paper provide further support for previous studies. It is observed that IRSC exhibits slow growth during the pre-period, followed by a substantial increase during the operation phase, characterized by an average yearly growth rate of 18.04%. This supports the finding by Wang et al. (Citation2022). We also recognize the significance of government subsidy risk in mitigating the IRSC, aligning with the view of Rahman et al. (Citation2019).
On the other hand, system dynamics theory has been combined with risk assessment in studies of enterprise management, health care, environmental pollution, and other aspects. The relevant practical results are abundant. In this context, it can simulate the risk of large, complex systems and analyze the impact of risk factors dynamically and systematically (Rathore, Thakkar, and Jha Citation2021; Wang and Yuan Citation2017). Currently, for different project types like the high-speed railway project, renewable energy project, and underground pipeline project, Xue et al. (Citation2020), Liu et al. (Citation2017) and Liu et al. (Citation2021) have constructed the corresponding risk assessment models by applying SD, respectively. On this basis, this study further applied the system dynamics approach to the study of large infrastructure PPP projects, constructing a system dynamics model to dynamically assess and analyze the level of IRSC during the simulation period. In contrast to the models mentioned above, this SD model can be utilized to find the critical risk factors affecting the IRSC and clarify the mechanism of risk coupling. Utilizing it assists social capital in managing investment risk. This is an innovative application of system dynamics in engineering project management.
5.2.2. Managerial implications
The findings have significant implications for the risk management of social capital. First, the social capital and the government should actively explore a more reasonable subsidy model. They can adopt additional indirect subsidies, such as preferential electricity fees, to reduce direct government financial subsidies. And the dynamic adjustment of subsidy standards during the operation phase is also necessary. URTP’s operation phase is fraught with substantial uncertainty. Changes in ticket prices, operating costs, and the market environment may affect the sustainable operation of the project. As a result, introducing a dynamic adjustment mechanism for the subsidy standard can provide certain incentives for the social capital on the premise of maintaining the sustainable operation of the project.
Second, the prevention and control of key risk factors should be strengthened. As for the contractual risk, for instance, the social capital ought to strengthen contract management and effectively perceive and prevent the risks caused by contract terms from various aspects, such as the duration of cooperation, the standard of project output, and the price mechanism of project operation. For the design risk, the social capital should collaborate with the government to monitor the design quality at different stages, strengthen the designers’ awareness, and deepen the depth and level of design.
5.3. Limitations and future studies
There exist some limitations in this paper. To begin with, some risk factors may not be identified in the process of risk identification. In the future, a comprehensive identification of risk factors will be carried out, and new parameters will be introduced to represent the relationship of risk factors to improve the authenticity and comprehensiveness of the model. Besides, the causal feedback relationships between risks were obtained in the modelling process mainly based on Chinese literature and cases. The model will be further optimized by combining international projects and relevant information.
Nomenclatures
| PPP | = | Public-Private Partnership |
| IRSC | = | Investment risk of social capital |
| SD | = | System dynamics |
| URT | = | Urban rail transit |
| URTP | = | Urban rail transit PPP project |
| IRMSC | = | Investment risk model of social capital |
| SPV | = | Special purpose vehicle |
Disclosure statement
No potential conflict of interest was reported by the author(s).
Additional information
Notes on contributors
Yuhao Sun
Yuhao Sun is a master’s student in the School of Economics and Management at Beijing Jiaotong University. He completed his undergraduate program at Wuhan University of Science and Technology. His research interests are project risk management and emission reduction in the construction industry. He can be reached at [email protected].
Mengkai Liu
Mengkai Liu is a professor in the School of Management at Wuhan University of Science and Technology. He received his Ph.D. in Engineering from Wuhan University. Liu has published several articles in journals, including Engineering Construction and Architectural Management. He is a reviewer for Engineering, Construction and Architectural Management and Humanities and Social Sciences Communications. He can be reached at [email protected].
Shengyue Hao
Shengyue Hao is a professor in the School of Economics and Management at Beijing Jiaotong University. He received his Ph.D. in Engineering from Beijing Jiaotong University and his M.S. in Engineering from Beijing Jiaotong University. Hao has published several articles in journals, including Building and Environment, Engineering Construction and Architectural Management and China Soft Science. His areas of interest include international construction management and project management. He can be reached at [email protected].
Meng Wei
Meng Wei is a Ph.D. researcher working for China Mobile Research Institute. She graduated from Beijing Jiaotong University. Her areas of interest include project management, team resilience and knowledge transfer. She can be reached at [email protected].
References
- Ahmadabadi, A. A., and G. Heravi. 2019. “Risk Assessment Framework of PPP-Megaprojects Focusing on Risk Interaction and Project Success.” Transportation Research Part A: Policy and Practice 124:169–188. https://doi.org/10.1016/j.tra.2019.03.011.
- Akcay, E. C. 2021. “An Analytic Network Process Based Risk Assessment Model for PPP Hydropower Investments.” Journal of Civil Engineering and Management 27 (4): 268–277. https://doi.org/10.3846/jcem.2021.14650.
- Aladag, H., and Z. Isik. 2022. “Political and legal risks in public–private partnership mega transportation projects.” Proceedings of the Institution of Civil Engineers - Municipal Engineer 175 (2): 95–106. https://doi.org/10.1680/jmuen.21.00017.
- Aladağ, H., and Z. Işık. 2019. “Design and Construction Risks in BOT Type Mega Transportation Projects.” ECAM 26 (10): 2223–2242. https://doi.org/10.1108/ECAM-08-2018-0351.
- Bian, F., H. Y. Chong, W. Zhang, and C. Ding. 2021. “Government Subsidy Strategy for Public-Private-Partnership Retrofit Buildings in China.” Energy and Buildings 252:111455. https://doi.org/10.1016/j.enbuild.2021.111455.
- Bing, L., A. Akintoye, P. J. Edwards, and C. Hardcastle. 2005. “The Allocation of Risk in PPP/PFI Construction Projects in the UK.” International Journal of Project Management 23 (1): 25–35. https://doi.org/10.1016/j.ijproman.2004.04.006.
- Cao, G., C. Guo, and H. Li. 2022. “Risk Analysis of Public–Private Partnership Waste-To-Energy Incineration Projects from the Perspective of Rural Revitalization.” Sustainability 14 (13): 8205. https://doi.org/10.3390/su14138205.
- Cao, Y., C. Zhang, H. Li, L. Su, and M. S. Kuinkel. 2023. “Research Status and Trend of PPP in the US and China: Visual Knowledge Mapping Analysis.” Journal of Asian Architecture and Building Engineering 1–14. https://doi.org/10.1080/13467581.2023.2208197.
- Casady, C. B., and D. Baxter. 2020. “Pandemics, public-private partnerships (PPPs), and force majeure | COVID-19 expectations and implications.” Constr Manag Econ 38 (12): 1077–1085. https://doi.org/10.1080/01446193.2020.1817516.
- Chan, A. P. C., J. F. Y. Yeung, Y. CCP, S. Q. Wang, and Y. Ke. 2011. “Empirical Study of Risk Assessment and Allocation of Public-Private Partnership Projects in China.” Journal of Management in Engineering 27 (3): 136–148. https://doi.org/10.1061/(ASCE)ME.1943-5479.0000049.
- Duan, Y. Q., X. Y. Fan, J. C. Liu, and Q. H. Hou. 2020. “Operating Efficiency-Based Data Mining on Intensive Land Use in Smart City.” Institute of Electrical and Electronics Engineers Access 8:17253–17262. https://doi.org/10.1109/ACCESS.2020.2967437.
- Ehrlich, M., and R. L. K. Tiong. 2012. “Improving the Assessment of Economic Foreign Exchange Exposure in Public–Private Partnership Infrastructure Projects.” Journal of Infrastructure Systems 18 (2): 57–67. https://doi.org/10.1061/(ASCE)IS.1943-555X.0000069.
- El-Khalek, H. A., R. F. Aziz, and E. S. Morgan. 2019. “Identification of Construction Subcontractor Prequalification Evaluation Criteria and Their Impact on Project Success.” Alexandria Engineering Journal 58 (1): 217–223. https://doi.org/10.1016/j.aej.2018.11.010.
- Eskander, R. F. A. 2018. “Risk Assessment Influencing Factors for Arabian Construction Projects Using Analytic Hierarchy Process.” Alexandria Engineering Journal 57 (4): 4207–4218. https://doi.org/10.1016/j.aej.2018.10.018.
- Fan, Y., M. Heydari, M. Saeidi, K. K. Lai, J. Yang, X. Cai, Y. Chen, et al. 2023. “Corruption and infrastructure development based on stochastic analysis.” Archives for Technical Sciences 1 (28): 11–28. https://doi.org/10.59456/afts.2023.1528.011Y.
- Fathi, M., and P. P. Shrestha. 2023. “Identification of Critical Success and Risk Factors for Public–Private Partnership Highway Projects.” The Journal of Legal Affairs and Dispute Resolution in Engineering and Construction 15 (1): 04522051. https://doi.org/10.1061/(ASCE)LA.1943-4170.0000587.
- Feng, Y., X. Guo, B. Wei, and B. Chen. 2021. “A fuzzy analytic hierarchy process for risk evaluation of urban rail transit PPP projects.” Journal of Intelligent & Fuzzy Systems 41 (4): 5117–5128. https://doi.org/10.3233/JIFS-189997.
- Fucic, L., B. Soldo, and D. Ojvan. 2022. “Continuous Construction Work’s Design Quality Monitoring in the Republic of Croatia.” Tehnicki Vjesnik-Technical Gazette 29 (3): 1019–1030. https://doi.org/10.17559/TV-20210621211941.
- Gallimore, P., W. Williams, and D. Woodward. 1997. “Perceptions of Risk in the Private Finance Initiative.” Journal of Property Finance 8 (2): 164–176. https://doi.org/10.1108/09588689710167852.
- Gao, Y., C. K. Lau, and K. K. Lai. 2021. “Risk Assessment of Urban Rail Transit Project Using Interpretative Structural Modelling: Evidence from China.” Mathematical Problems in Engineering 2021:1–10. https://doi.org/10.1155/2021/5581686.
- Garbolino, E., J. P. Chery, and F. Guarnieri. 2016. “A Simplified Approach to Risk Assessment Based on System Dynamics: An Industrial Case Study.” Risk Analysis: An Official Publication of the Society for Risk Analysis 36 (1): 16–29. https://doi.org/10.1111/risa.12534.
- Ge, Y., J. Qu, X. Gao, C. Liu, J. Tang, X. Song, et al. 2022. “Simulation of Chinese Household Carbon Emission Based on System Dynamics.” Science and Technology Management Research 42 (21): 239–246.
- Grimsey, D., and M. K. Lewis. 2002. “Evaluating the Risks of Public Private Partnerships for Infrastructure Projects.” International Journal of Project Management 20 (2): 107–118. https://doi.org/10.1016/S0263-7863(00)00040-5.
- Hell, M., and L. Petric. 2021. “System Dynamics Approach to TALC Modeling.” Sustainability 13 (9): 4803. https://doi.org/10.3390/su13094803.
- Heydari, M., K. K. Lai, V. Shi, and F. Xiao. 2023. “Public Health Risk Evaluation Through Mathematical Optimization in the Process of PPPs.” International Journal of Environmental Research and Public Health 20 (2): 1175. https://doi.org/10.3390/ijerph20021175.
- Hou, W., and L. Wang. 2022. “Research on the refinancing capital structure of highway PPP projects based on dynamic capital demand.” ECAM 29 (5): 2047–2072. https://doi.org/10.1108/ECAM-05-2020-0321.
- Huang, Y., W. Xu, and C. Li. 2022. “Information Integration Framework for a Public–Private Partnership System of an Urban Railway Transit Project (Part A: System Architecture).” Journal of Industrial Information Integration 25:100244. https://doi.org/10.1016/j.jii.2021.100244.
- Hwang, S., J. Lee, J. S. Yi, and M. Kim. 2019. “Korean Public Rental Housing for Residential Stability of the Younger Population: Analysis of Policy Impacts Using System Dynamics.” Journal of Asian Architecture & Building Engineering 18 (3): 185–194. https://doi.org/10.1080/13467581.2019.1615494.
- Jiang, W., Q. Yang, J. Jiang, I. Martek, and F. Gao. 2022. “Operational Risk Management of Public-Private Partnership Infrastructure Projects: A Bibliometric Literature Review.” BUILDINGS-BASEL 12 (11): 1905. https://doi.org/10.3390/buildings12111905.
- Kumaraswamy, M. M., and X. Q. Zhang. 2001. “Governmental Role in BOT-Led Infrastructure Development.” International Journal of Project Management 19 (4): 195–205. https://doi.org/10.1016/S0263-7863(99)00069-1.
- Lee, H., Y. Eun 2022. “Advertisement Revenue and Exposure Optimization for Digital Screens in Subway Networks Using Smart Card Data.” In IEEE Trans Intell Transp Syst, https://doi.org/10.1109/TITS.2022.3203705
- Liao, C. 2016. “The Economic Effect Analysis of PPP Model in Urban Rail Transit — Illustrated by the London Underground and Beijing Metro Line 4.” In 2016 International Conference on Industrial Economics System and Industrial Security Engineering (IEIS), IEEE:1–6. https://doi.org/10.1109/IEIS.2016.7551885
- Li, X., P. E. D. Love, H. Luo, and W. Fang. 2022. “A Systemic Model for Implementing Land Value Capture to Support Urban Rail Transit Infrastructure Projects.” Transportation Research Part A: Policy and Practice 156:90–112. https://doi.org/10.1016/j.tra.2021.12.010.
- Liu, A., K. Chen, X. Huang, D. Li, and X. Zhang. 2021. “Dynamic Risk Assessment Model of Buried Gas Pipelines Based on System Dynamics.” Reliability Engineering & System Safety 208:107326. https://doi.org/10.1016/j.ress.2020.107326.
- Liu, J., R. Gao, C. Y. J. Cheah, and J. Luo. 2017. “Evolutionary Game of investors’ Opportunistic Behaviour During the Operational Period in PPP Projects.” Constr Manag Econ 35 (3): 137–153. https://doi.org/10.1080/01446193.2016.1237033.
- Liu, J., Z. Hua, Y. Pang, and X. Wang. 2022. “Risk Sharing for PPP Project in Construction Waste Recycling Industry in China.” Environmental Science and Pollution Research 29 (9): 12614–12628. https://doi.org/10.1007/s11356-021-15816-z.
- Liu, Z., Y. Jiao, A. Li, and X. Liu. 2021. “Risk Assessment of Urban Rail Transit PPP Project Construction Based on Bayesian Network.” Sustainability 13 (20): 11507. https://doi.org/10.3390/su132011507.
- Liu, J., J. Liu, Z. Bu, Y. Zhou, and P. He. 2022. “Path Analysis of Influencing Government’s Excessive Behavior in PPP Project: Based on Field Dynamic Theory.” Transportation Research Part A: Policy and Practice 166:522–540. https://doi.org/10.1016/j.tra.2022.11.011.
- Liu, K., Y. Liu, Y. Kou, X. Yang, and G. Hu. 2023. “Efficiency of Risk Management for Tunnel Security of Megaprojects Construction in China Based on System Dynamics.” Journal of Asian Architecture and Building Engineering 2023:1–13. Published online June 17. https://doi.org/10.1080/13467581.2023.2223696.
- LIU, L., Y. XING, M. LI, and X. LI. 2022. “Revenue and Expenditure Characteristics of Urban Rail Transit Operation.” Urban Rapid Rail Transit 35 (1): 140–146.
- Liu, X., and M. Zeng. 2017. “Renewable energy investment risk evaluation model based on system dynamics.” Renewable and Sustainable Energy Reviews 73:782–788. https://doi.org/10.1016/j.rser.2017.02.019.
- Liu, T., M. Zhang, J. Song, and Y. Zhao. 2022. “Multi‐Agent Evolutionary Game of Process Safety Culture in Chinese Chemical Industry Based on System Dynamics.” Systems Engineering 25 (2): 107–114. https://doi.org/10.1002/sys.21604.
- Lv, J., Z. Y. Ying, W. Zhou, and C. T. Chang. 2020. “Alternative Model to Determine the Optimal Government Subsidies in Construction Stage of PPP Rail Transit Projects Under Dynamic Uncertainties.” Mathematical Problems in Engineering 2020:1–12. https://doi.org/10.1155/2020/3928463.
- Maslyukivska, O., and M. Sohail. 2007. “European Infrastructure Procurement Through PPP.” Proceedings of the Institution of Civil Engineers - Management, Procurement and Law 160 (4): 159–167. https://doi.org/10.1680/mpal.2007.160.4.159.
- Musarat, M. A., W. S. Alaloul, and M. S. Liew. 2021. “Impact of Inflation Rate on Construction Projects Budget: A Review.” Ain Shams Engineering Journal 12 (1): 407–414. https://doi.org/10.1016/j.asej.2020.04.009.
- Ng, A., and M. Loosemore. 2007. “Risk Allocation in the Private Provision of Public Infrastructure.” International Journal of Project Management 25 (1): 66–76. https://doi.org/10.1016/j.ijproman.2006.06.005.
- Othman, K., and R. Khallaf. 2022. “Identification of the Barriers and Key Success Factors for Renewable Energy Public-Private Partnership Projects: A Continental Analysis.” BUILDINGS-BASEL 12 (10): 1511. https://doi.org/10.3390/buildings12101511.
- Pagoni, E. G., and G. Patroklos. 2019. “A System Dynamics Model for the Assessment of National Public–Private Partnership programmes’ Sustainable Performance.” Simulation Modelling Practice and Theory 97:101949. https://doi.org/10.1016/j.simpat.2019.101949.
- Rachmawati, T. S. N., and S. Kim. 2023. “A Risk Management Model of Apartment Development Projects Using System Dynamics.” Journal of Asian Architecture and Building Engineering 22 (3): 1492–1506. https://doi.org/10.1080/13467581.2022.2086558.
- Rafaat, R., H. Osman, M. Georgy, and M. Elsaid. 2020. “Preferred Risk Allocation in Egypt’s Water Sector PPPs.” International Journal of Construction Management 20 (6): 585–597. https://doi.org/10.1080/15623599.2019.1703087.
- Rahman, H. Z., P. Miraj, and A. Andreas. 2019. “Exploring Public–Private Partnership Scheme in Operation and Maintenance Stage of Railway Project.” Sustainability 11 (22): 6517. https://doi.org/10.3390/su11226517.
- Rathore, R., J. J. Thakkar, and J. K. Jha. 2021. “Impact of Risks in Foodgrains Transportation System: A System Dynamics Approach.” International Journal of Production Research 59 (6): 1814–1833. https://doi.org/10.1080/00207543.2020.1725683.
- Sehgal, P. C., A. K. Malhotra, and A. Kapoor. 2009. “Development of Effective Ventilation System for Electric Multiple Unit(emu) Train for Mumbai Suburban Railway.” International Journal of Ventilation 7 (4): 335–344. https://doi.org/10.1080/14733315.2009.11683823.
- Shrestha, A., J. Tamosaitiene, I. Martek, M. R. Hosseini, and D. J. Edwards. 2019. “A Principal-Agent Theory Perspective on PPP Risk Allocation.” Sustainability 11 (22): 6455. https://doi.org/10.3390/su11226455.
- Song, J., D. Song, X. Zhang, and Y. Sun. 2013. “Risk Identification for PPP Waste-To-Energy Incineration Projects in China.” Energy Policy 61:953–962. https://doi.org/10.1016/j.enpol.2013.06.041.
- Tang, L., Y. Yue, X. Xiahou, S. Tang, and Q. Li. 2021. “Research on Performance Measurement and Simulation of Civil Air Defense PPP Projects Using System Dynamics.” Journal of Civil Engineering and Management 27 (5): 316–330. https://doi.org/10.3846/jcem.2021.14919.
- Walworth, T., M. Yearworth, L. Shrieves, and H. Sillitto. 2016. “Estimating Project Performance Through a System Dynamics Learning Model.” Systems Engineering 19 (4): 334–350. https://doi.org/10.1002/sys.21349.
- Wang, H., Q. Lin, and Y. Zhang. 2022. “Risk Cost Measurement of Value for Money Evaluation Based on Case-Based Reasoning and Ontology: A Case Study of the Urban Rail Transit Public-Private Partnership Projects in China.” Sustainability 14 (9): 5547. https://doi.org/10.3390/su14095547.
- Wang, Y. F., B. Li, T. Qin, and B. Zhang. 2018. “Probability Prediction and Cost Benefit Analysis Based on System Dynamics.” Process Safety and Environmental Protection 114:271–278. https://doi.org/10.1016/j.psep.2018.01.002.
- Wang, Y., Z. Shao, and R. L. K. Tiong. 2021. “Data-Driven Prediction of Contract Failure of Public-Private Partnership Projects.” Journal of Construction Engineering and Management 147 (8): 04021089. https://doi.org/10.1061/(ASCE)CO.1943-7862.0002124.
- Wang, L. N., and Z. S. Xu. 2023. “A Coordination Game Model for Risk Allocation of a PPP Project with the Weakened Hedged Probabilistic Linguistic Term Information.” Ekon Istraz 36 (1): 593–613. https://doi.org/10.1080/1331677X.2022.2078988.
- Wang, X., Y. Yin, J. Deng, and Z. Xu. 2023. “Influence of Trust Networks on the Cooperation Efficiency of PPP Projects: Moderating Effect of Opportunistic Behavior.” Journal of Asian Architecture and Building Engineering 22 (4) . https://doi.org/10.1080/13467581.2021.1972002.
- Wang, J., and H. Yuan. 2017. “System Dynamics Approach for Investigating the Risk Effects on Schedule Delay in Infrastructure Projects.” Journal of Management in Engineering 33 (1): 04016029. https://doi.org/10.1061/(ASCE)ME.1943-5479.0000472.
- Wang, G., and Z. Zhang. 2021. “BIM Implementation in Handover Management for Underground Rail Transit Project: A Case Study Approach.” Tunnelling and Underground Space Technology 108:103684. https://doi.org/10.1016/j.tust.2020.103684.
- Wang, X., Q. Zhang, D. Wang, H. J. Liu, and M. C. P. Sing. 2023. “Conceptual Framework for Enabling PPP Project Sustainability: A System Thinking and Modelling.” Production Planning & Control 2023:1–16. Published online June 28. https://doi.org/10.1080/09537287.2023.2228733.
- Wang, L., F. Zhao, G. Zhang, and M. Chen. 2022. “Analysis on the Impact of Large-Scale Sports Events on Regional Economy Based on SWOT-PEST Model.” Journal of Mathematics 2022:1–12. https://doi.org/10.1155/2022/7769128.
- Wang, Y., J. Zheng, Y. Ding, and Z. Wang. 2022. “Study on Vulnerability Evaluation of Transportation PPP Projects Based on System Dynamics.” Construction Economy 43 (S1): 390–395. https://doi.org/10.14181/j.cnki.1002-851x.2022S10390.
- Whiteside, H. 2020. “Public-Private Partnerships: Market Development Through Management Reform.” Review of International Political Economy 27 (4): 880–902. https://doi.org/10.1080/09692290.2019.1635514.
- Wu, X., H. Yuan, G. Wang, S. Li, and G. Wu. 2019. “Impacts of Lean Construction on Safety Systems: A System Dynamics Approach.” International Journal of Environmental Research and Public Health 16 (2): 221. https://doi.org/10.3390/ijerph16020221.
- Xiang, P., Q. Zhang, Q. Jiang, and Z. Liu. 2022. “Operational Risk Allocation in Urban Rail Transit Public–Private Partnership Projects.” Frontiers in Environmental Science 10:900322. https://doi.org/10.3389/fenvs.2022.900322.
- Xue, Y., P. Xiang, F. Jia, and Z. Liu. 2020. “Risk Assessment of High-Speed Rail Projects: A Risk Coupling Model Based on System Dynamics.” IJERPH 17 (15): 5307. https://doi.org/10.3390/ijerph17155307.
- Zhang, S., M. Loosemore, R. Y. Sunindijo, S. Galvin, J. Wu, and S. Zhang. 2022. “Assessing Safety Risk Management Performance in Chinese Subway Construction Projects: A Multistakeholder Perspective.” Journal of Management in Engineering 38 (4): 05022009. https://doi.org/10.1061/(ASCE)ME.1943-5479.0001062.
- Zhang, L., J. Wu, J. Zhang, F. Su, H. Bian, and L. Li. 2022. “A Dynamic and Integrated Approach of Safety Investment Decision-Making for Power Grid Enterprises.” Process Safety and Environmental Protection 162:301–312. https://doi.org/10.1016/j.psep.2022.04.007.
- Zhou, Y., and J. Liu. 2021. “Influence of Government Credit Risk on Ppp Projects in Operation Stage.” International Journal of Strategic Property Management 25 (3): 216–227. https://doi.org/10.3846/ijspm.2021.14552.
- Zou, P. X. W., S. Wang, and D. Fang. 2008. “A Life‐Cycle Risk Management Framework for PPP Infrastructure Projects.” Journal of Fin Man of Prop and Cons 13 (2): 123–142. https://doi.org/10.1108/13664380810898131.
Appendix A
The causality diagram contains 14 causal feedback loops as follows.
(1) IRSC→+Financing risk→+Construction cost overrun→+Operating cost risk entropy increment→+Operating cost risk→+Investment risk entropy increment→+IRSC
The investment risk of social capital can affect the financing of the project. In this case, financial leasing of large machinery and equipment can be difficult, leading to the construction cost overrun. However, the total budget is limited, and construction cost overrun would reduce the operating budget to some extent, increasing the difficulty of operation and maintenance and impacting operating costs. Finally, if operating costs are overrun, social capital could not get an acceptable rate of return on investment, which could exacerbate investment risk.
(2) IRSC→+Financing risk→+Construction cost overrun→+Subsidy risk entropy increment→+Subsidy risk→+Investment risk entropy increment→+IRSC
It is worth noting that the same causal relationship explained in the above loop is not repeated in this loop and subsequent loops. In this loop, when the construction cost overruns, it is often unfavorable to apply for government subsidies, which can aggravate subsidy risk. And if there is a lack of government subsidies, most PPP projects may face a cash flow shortfall. As a result, it is more difficult for social capital to recover its investment, exacerbating the investment risk.
(3) IRSC→+Financing risk→+Schedule delay→+Construction cost overrun→+Operating cost risk entropy increment→+Operating cost risk→+Investment risk entropy increment→+IRSC
In the loop, if there is a problem with the financing of the project, the start of the project will be affected, which may easily result in delays in the construction period. Furthermore, if the schedule is delayed, the corresponding construction costs will increase, most likely resulting in its overrun.
(4) IRSC→+Financing risk→+Schedule delay→+Quality shortfall→+Operating cost risk entropy increment→+Operating cost risk→+Investment risk entropy increment→+IRSC
In the loop, when the schedule is delayed, the project team could sacrifice quality to maintain the schedule, resulting in the quality shortfall of the project. When it comes to the operational period, there will likely be various quality issues that need to be fixed, which will increase operating costs.
(5) IRSC→+Financing risk→+Schedule delay→+Construction cost overrun→+Subsidy risk entropy increment→+Subsidy risk→+Investment risk entropy increment→+IRSC
(6) IRSC→+Financing risk→+Construction cost overrun→+Poor service quality→+Operating revenue risk entropy increment→+Operating revenue risk→+Investment risk entropy increment→+IRSC
In this loop, due to the construction cost overrun in the early stage of the project, there could be a lack of sufficient funds for the project’s operation in the later stage. This can result in a lack of services to support the operation, leading to poor service quality. In this case, the consumers’ experience and feelings could be impacted seriously, thus affecting the operating revenue. In addition, the operating revenue also determines whether the social capital can successfully recover the investment.
(7) IRSC→+Financing risk→+Schedule delay→+Construction cost overrun→+Poor service quality→+Operating revenue risk entropy increment→+Operating revenue risk→+Investment risk entropy increment→+IRSC
(8) IRSC→+Financing risk→+Construction cost overrun→+Operating cost risk entropy increment→+Operating cost risk→+Subsidy risk entropy increment→+Subsidy risk→+Investment risk entropy increment→+IRSC
In the loop, as the operating cost risk rises, the government could be unable to increase subsidies due to limitations on the amount of the subsidy budget, resulting in cash flow pressure and exacerbating the subsidy risk.
(9) IRSC→+Financing risk→+Schedule delay→+Quality shortfall→+Poor service quality→+Operating revenue risk entropy increment→+Operating revenue risk→+Investment risk entropy increment→+IRSC
In that loop, some services often have to be lost during the project’s operation due to some quality issues, especially in the case of metro projects, which can easily lead to passenger dissatisfaction with the metro service.
(10) IRSC→+Financing risk→+Schedule delay→+Construction cost overrun→+Operating cost risk entropy increment→+Operating cost risk→+Subsidy risk entropy increment→+Subsidy risk→+Investment risk entropy increment→+IRSC
(11) IRSC→+Financing risk→+Schedule delay→+Quality shortfall→+Operating cost risk entropy increment→+Operating cost risk→+Subsidy risk entropy increment→+Subsidy risk→+Investment risk entropy increment→+IRSC
(12) IRSC→+Financing risk→+ Construction cost overrun→+Poor service quality→+Operating revenue risk entropy increment→+Operating revenue risk→+Subsidy risk entropy increment→+Subsidy risk→+Investment risk entropy increment→+IRSC
In this loop, like the operating cost risk, increased operating revenue risk exacerbates the subsidy risk.
(13) IRSC→+Financing risk→+Schedule delay→+Construction cost overrun→+Poor service quality→+Operating revenue risk entropy increment→+Operating revenue risk→+Subsidy risk entropy increment→+Subsidy risk→+Investment risk entropy increment→+IRSC
(14) IRSC→+Financing risk→+Schedule delay→+Quality shortfall→+Poor service quality→+Operating revenue risk entropy increment→+Operating revenue risk→+Subsidy risk entropy increment→+Subsidy risk→+Investment risk entropy increment→+IRSC
Appendix B
Survey of relative importance of risk factors
Hello! We are currently conducting a study on assessing the investment risk for social capital in urban rail transit PPP projects. Based on the perspective of the social capital, we have identified 27 risk factors in terms of the main stakeholders and the external environment. The 1–9 scale method of the Analytic Hierarchy Process (AHP) now needs to be used to score the independent variable risk to obtain the weights. Accordingly, we would like you to compare and score the significance of the independent variable risks that contribute to each dependent variable risk with your professional experience and knowledge. Thank you for your support and participation.
1. Scoring criteria
Table B1. Description and meaning of the 1–9 scale method.
2. Scoring of the relative significance of risks
Table B2. Investment risk of social capital.
Table B3. Subsidy risk entropy increment.
Table B4. Operating cost risk entropy increment.
Table B5. Operating revenue risk entropy increment.
Table B6. Government credit risk.
Table B7. Quality shortfall.
Table B8. Construction cost overrun.
Table B9. Poor service quality.
Table B10. Ticket revenue risk.
Table B11. Decision-making risk.
Table B12. Schedule delay.
Table B13. Financing risk.
Table B14. Construction safety risk.
Appendix C
Numerical Evaluation of boundary risks
Hello! In order to effectively assess the investment risks faced by social capitalists participating in the Wuhan Metro Line 12 PPP Project (Jiangbei Section), we have established an investment risk system based on system dynamics. We now invite you to make a proper numerical evaluation of the boundary risk of the investment risk system based on your abundant working experience and expertise. The content of this survey is for academic research purposes only, and your valuable input is an excellent help to me. Thank you for your support and participation.
1. Scoring criteria
Table C1. Scoring criteria.
2. Numerical evaluation
Table C2. Numerical evaluation of boundary risks.
Appendix D
Table D1. System dynamics equations.