
 ?Mathematical formulae have been encoded as MathML and are displayed in this HTML version using MathJax in order to improve their display. Uncheck the box to turn MathJax off. This feature requires Javascript. Click on a formula to zoom.
ABSTRACT
Urban vitality stands as a pivotal metric for evaluating the sustainability and appeal of urban environments. Global experiences underscore the significance of parks and shopping centers as crucial components of urban vitality spaces. However, existing literature predominantly concentrates on the individual impacts of parks or shopping centers on urban vitality, with limited exploration into the vitality relationship between them, often relying on linear correlation analyses. To address this gap, this study, centered on the renowned Park City of Chengdu in China, employs Baidu heatmap and POI data, utilizing a combination of spatial syntax and linear and non-linear analysis methods to examine the influence of road accessibility on the vitality of shopping malls and parks, as well as their correlation. Findings indicate: (1) High-vitality shopping malls primarily cluster within the first ring road, while park utilization is notably higher in the southern urban area. (2) High-vitality parks and shopping centers are situated in regions characterized by elevated global integration and efficiency values, suggesting their vitality is influenced by road accessibility. (3) Linear correlation analysis, with global integration and efficiency values controlled, yields correlation coefficients of 0.797 and 0.795 for high-vitality parks and shopping centers, respectively. Non-linear correlation analysis indicates a correlation coefficient close to 0.7 between park vitality and shopping mall vitality, highlighting a strong correlation between them. This study elucidates the critical relationship between park vitality and commercial vitality in urban layout, offering valuable insights for urban planning strategies aimed at promoting sustainable urban development.
Graphical Abstract
1. Introduction
In the development of cities, urban vitality is a crucial concept. Urban vitality can be understood as the intensity and frequency of social, economic, and cultural activities in urban areas, serving as a significant indicator for assessing urban health and sustainability (Lee and Kang Citation2022). Both commerce and parks, as two essential urban elements, play pivotal roles in urban vitality. Commerce constitutes a vital component of urban economies, not only generating employment opportunities and economic income but also providing residents with various goods and services to meet their daily needs (Wang et al. Citation2022). Additionally, commercial areas serve as crucial hubs for social interaction and communication among urban residents (Zhou, Wang, and Xie Citation2023). On the other hand, parks, as integral parts of urban green spaces, offer spaces for leisure and recreation, enriching the cultural lives of urban residents while also contributing to environmental purification and ecological improvement (Mu et al. Citation2021). The vitality of commerce and parks exerts significant influence on urban vitality. Strengthening commercial vitality can promote economic development and social prosperity in cities, attracting more people to engage in commercial activities and enhancing the quality of life and the image of the city (Yu et al. Citation2022). Meanwhile, enhancing park vitality can improve the quality of life for urban residents, foster social harmony, and enrich the cultural heritage of the city (Zhu et al. Citation2020). Therefore, the enhancement of both commercial and park vitality is essential for overall urban vitality. In existing research, numerous scholars have conducted in-depth studies on overall urban vitality, commercial vitality, and park vitality separately.
Some researchers focus on commercial vitality itself and the relationship between commercial vitality and urban vitality, exploring the impact of factors such as the scale, diversity, and accessibility of commercial areas on urban vitality, and proposing a series of evaluation indicators and methods (Gómez-Varo, Delclòs-Alió, and Miralles-Guasch Citation2022). Regarding the study of commercial vitality itself, Xu, Y. J. delves into the internal spatial vitality of commercial complexes from aspects such as internal business formats and traffic flow, capacity and spatial layout, consumer behavior, and spatial performance (Xu and Chen Citation2023). Some researchers not only investigate the internal diversity of shopping centers but also comprehensively consider the connections between similar commercial complexes, treating the entire city’s commercial complexes as a system to study, suggesting a complex relationship between the supply of commercial complexes and urban demand (Hong et al. Citation2024; Qin et al. Citation2022). Some scholars also link the vitality of shopping malls with rail transit, exploring the correlation between transit station structure and mall vitality, analyzing and summarizing four factors affecting commercial vitality: commerce, space, transportation, and environment, and providing optimization strategies for commercial complexes from the perspective of vitality regeneration (Li and Zhao Citation2023). In terms of studying the relationship between commercial vitality and urban vitality, Tang, S. W. investigates the influencing mechanisms of urban vitality, finding that the combined weight of entertainment, shopping, dining, and accommodation on urban vitality exceeds 0.7, indicating a close correlation between urban vitality level and commercial vitality (Tang and Ta Citation2022).
Some researchers focus on the vitality of parks themselves and the relationship between park vitality and urban vitality, studying the impact of factors such as park size, facilities, and greening level on urban residents’ quality of life and urban vitality, and proposing corresponding evaluation systems (Xu and Chen Citation2023). In exploring the vitality of parks themselves, early researchers including (Sugier Citation2001) and (Benson Citation2002) created an evaluation system for the vitality of park landscape spaces, and Dong, Q. D. and Cai, J. analyzed the spatiotemporal changes and influencing factors of urban green space vitality, exploring strategies to promote the vitality of urban park green spaces. With the development and utilization of big data, research on park vitality has been further deepened. For example, many scholars use multi-source data to evaluate the vitality of urban parks from multiple dimensions, filling the gaps in existing studies on public space vitality from a single perspective (Guo, Lei, and Zhang Citation2023; Li, Chen, and Yan Citation2021). For instance, Li, Q. et al. quantitatively studied the influencing factors of urban park vitality using multi-source data such as land use, architecture, commercial points of interest (POI), and mobile phone signaling (Sun et al. Citation2021). In 2020, following the outbreak of the COVID-19 pandemic, scholars paid more attention to the study of park vitality (Sun et al. Citation2021; Sung and Liu Citation2022). Banchiero et al. based on Jan Gehl’s theory of urban park vitality, constructed a method for evaluating the vitality of parks adjacent to cities (NPV potential), which considers the surrounding urban areas of the park as external vitality factors and the organization and design of the park as internal factors. They conducted a comprehensive evaluation of both aspects, obtaining an overall score of NPV potential, which serves as a reference for urban planning and design.
Research has demonstrated that shopping malls and parks, as crucial public activity spaces in urban areas, have become a focal point in urban planning research, with most scholars concentrating on factors influencing the vitality of these two spaces (Li et al. Citation2022; Zhang et al. Citation2022). However, there has been limited research on whether the vitality of these spaces is correlated when they are co-located and how this correlation can be improved. Some scholars argue that the co-location of these entities is meaningful. For example, Tang, S. W explored the complementary patterns between commercial centers and park development, explicitly stating that this spatial development model aligns with the high-density development of cities and could provide better references for the spatial development of urban core areas (Tang and Ta Citation2022). He further suggests that this pattern may become a trend in the future development of cities.
Simultaneously, some scholars focus on the overall vitality of cities, emphasizing the exploration of data and methods for quantitatively assessing urban vitality. While traditional data sources such as census data and mobile phone signaling data are important, their application scope is limited due to issues such as data privacy and accessibility (Jing et al. Citation2020). To address this limitation, researchers have begun exploring alternative open geographic information data sources, such as Points of Interest (POI), street view maps, Baidu heat maps, and taxi GPS data (Wang et al. Citation2022; Wei et al. Citation2022). These various types of geographic big data can reflect urban vitality from different perspectives. For example, POI data highlights the diversity and density of urban facilities and activities, while Baidu heat maps provide an intuitive display of the distribution of human activity intensity in cities (Li and Pan Citation2023). For instance, Song, Y utilized dynamic big data provided by Baidu heat maps to study the changes in population center of gravity, aggregation degree, and aggregation location of people at different times during a week, thereby exploring urban spatial structure (Song et al. Citation2022). Lv, G. Y et al. quantitatively analyzed the vitality of subway station service areas using Baidu heat maps, thereby uncovering the correlation between vitality performance and the built environment of service areas (Lv, Zheng, and Hu Citation2022). Furthermore, the combination of open geographic information data with various methods has become a research hotspot in recent years. For example, by integrating Baidu heat maps with Geographic Information System (GIS) technology, active areas in cities and their spatial distribution characteristics can be identified (Fan et al. Citation2021). Additionally, Peng, Y. S. combined Baidu heat maps with spatial statistical methods to detect hotspots in cities and analyze the spatial clustering degree and distribution patterns of these hotspots (Peng et al. Citation2021). Moreover, based on Baidu heat map data, machine learning algorithms such as random forests and support vector machines can be used to establish predictive models to forecast trends in urban vitality or influencing factors. These algorithms can also be used to predict the flow of people or levels of commercial activities in specific areas and analyze their relationship with other variables such as weather and traffic conditions (Zhao et al. Citation2021).
Furthermore, some scholars propose that spatial syntax can assist researchers in understanding the spatial correlations between different areas within cities. By analyzing the spatial layout and correlations between different areas in cities, it is possible to reveal the spatial distribution patterns of urban vitality and the interactive relationships between regions, thereby aiding in a deeper understanding of the mechanisms and influencing factors behind urban vitality. Spatial syntax is a method proposed by scholars such as Bill Hillier from the University of London, which objectively describes and measures the configurational features of space based on graph theory and urban morphology (Yang et al. Citation2023). Spatial syntax excludes factors beyond space, abstracting them into basic topological prototypes, and then explores the relationships between spaces. Lyu, Y quantitatively calculated the spatial topological parameters of various blocks within urban zones using spatial syntax theory and used this as a basis to analyze the evolution of urban spatial forms. Mohamed, A. A proposed methods for addressing spatial layout issues in urban planning and management through the application of spatial syntax theory (Mohamed, Ubareviciene, and van Ham Citation2022).
Although, many international scholars use the above methods to quantitatively analyze the vitality of urban space. However, there are few studies on the combination of Baidu heat map and spatial syntax, and there are relatively few studies on the relationship between road accessibility and park vitality, commercial vitality, and how commercial vitality and park vitality interact. Therefore, this paper uses spatial syntax theory to quantitatively analyze the spatial form of urban roads, and then combines Baidu heat map to count the vitality of parks and commercial vitality. In addition, the correlation between the vitality of commercial space and the vitality of park space is analyzed by combining linear and nonlinear analysis methods. The main objectives of our research are : (1) What is the relationship between urban road accessibility and park vitality, commercial vitality? (2) What are the most important indicators of road accessibility for park vitality and business vitality? (3) What is the relationship between park vitality and commercial vitality ?nalysis, it validates the correlation between the vitality of urban commercial space and park space.
This article selects the main urban area of Chengdu as the research area. Chengdu is a renowned “Park City” in China, boasting a plethora of high-quality parks. Furthermore, in recent years, Chengdu’s rapid development has led to a swift increase in commercial space and vitality, making it a hub of consumption in China (Dong et al. Citation2022). The main urban area of Chengdu has a large number of parks and shopping centers, with a relatively concentrated distribution, which enhances the significance of the analysis results. The theoretical significance of this study lies in exploring the correlation between different measurement methods and advancing research on the mutual influence of commercial vitality and park vitality. The practical significance lies in providing more effective strategies and suggestions for urban planning and design in emerging Chinese cities represented by Chengdu, optimizing urban spatial layout and functional combinations, and promoting the sustainable development of the economy, society, and environment in cities.
2. Materials and methods
2.1. Study area
This work takes Chengdu was selected as the study site. As an important central city in western China, Chengdu is known as the “Land of Heaven” because of its secluded landscapes and humanities. The air quality of six districts and counties under its jurisdiction reached the national secondary standard, and the proportion of good water bodies in the city’s surface water section reached 95.4%. From the first proposal of building a park city in 2018 to the approval of the State Council in 2022 to practice the new development concept of park city demonstration area, Chengdu has a large number of parks and high quality, and its development is at the forefront of the country. In addition, with the outward development of Chengdu, the second-ring regional business district has developed and matured, and the commercial trend has begun to spread from the city center to the second and third rings, with the commercial pattern of three core business districts as the main business district and several regional centers as the supplement gradually taking shape. The number of urban regional parks and shopping centers within the third ring of Chengdu are more numerous and concentrated, and the analysis results are more meaningful.
In addition to the large number of parks and shopping malls, Chengdu has a relatively complete and open dataset, including a road network and population dynamics heat map. Access to this data offers possibilities for further exploration. The results of this study provide a scientific basis for urban spatial layout optimization and population vitality enhancement.
2.2. Data acquisition
2.2.1. Baidu heat map data
Baidu Heat Map data for the study area was obtained from the Baidu Map website (http://map.baidu.com.) using Python, two days were selected within the Third Ring Road on 18 February 2022 (weekday) and 20 February 2022 (rest day), considering the difference between the activities of city residents on weekdays and rest days. A total of 36 heatmaps were crawled from 7:00 to 24:00, with a one-hour interval. The scaling level of the Baidu heat map was 19. The higher the level, the smaller the scale. The scaling level of the heat map obtained in this study was 17, with a spatial resolution of approximately 1.07. The scale of the data is 1:100 m. The final acquired data are raster data in TIFF format. Baidu software users have more than 100 million people, and Baidu heat map update time (15 min/time) is shorter to provide researchers with more accurate and dynamic population distribution.
2.2.2. Road network data
In the open source page of the open street map website (https://www.openstreetmap.org/), the road network data in the study area were selected and packaged for downloading, and the obtained data were imported into ArcGIS software to be projected by using the projection tool, and then the vectorized data were vectorized to obtain the shape of the road network. Then the converted ”.shp” format file is exported from ArcGIS and imported into Depthmap software to interrupt the topology, and a total of 2440 road axial segments are finally obtained.
2.2.3. POI data
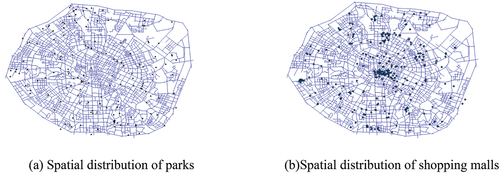
The POI data of parks and shopping malls in the study area were obtained from Gaode POI database (https://lbs.amap.com/). Gaode map has an open data platform and the most complete POI data, so the crawler software can crawl all the parks and shopping malls data in the study area, screen out the blank data and other ineffective data, and then import them into ArcGIS to perform the projection transformation and coordinate correction, and ultimately get the required POI data points, and the amount of POI data of parks and shopping malls is 149,313 points respectively. The amount of POI data is 149,313 for parks and shopping centers respectively ().
Figure 1. Spatial distribution of POI data points.
2.3. Research methodology
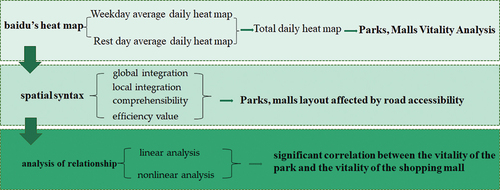
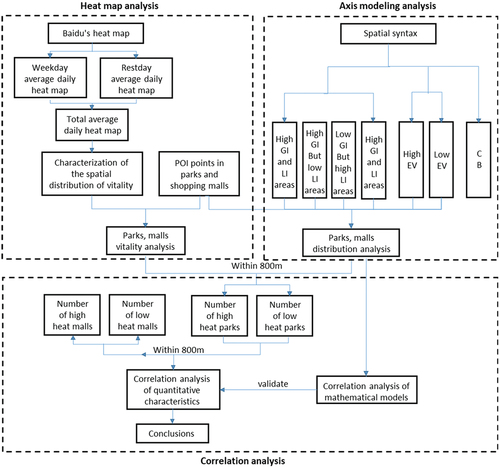
In this study, we utilized Baidu heat map data, Gaode POI data, and Open Street Map road network data to analyze the interaction and underlying patterns between park vitality and mall vitality. The research workflow of this study is illustrated in . Initially, the Baidu heat map was imported into ArcGIS to extract data and assign heat values to POI points for preliminary analysis of mall and park vitality. Subsequently, the spatial syntax axis model was imported into ArcGIS and overlaid with POI data to generate spatial distribution maps of both, revealing that the spatial vitality of both is influenced by road accessibility. Then, the POI points on the central axis of the adjacent road network are summarized in Arc GIS with a radius of 800 m, and the attribute table is exported to SPSS. Taking the road accessibility parameters as the control variables in the mathematical model, the linear and nonlinear analysis methods are used to verify the correlation between the four variables of high vitality shopping malls, low vitality shopping malls, high vitality parks and low vitality parks. Finally, it is concluded that there is a correlation between the vitality of shopping malls and the vitality of parks.
Figure 2. Research route.
2.3.1. Extraction of vitality values
The Baidu Heat Map data is in TIFF format, which is raster data. The acquired Baidu heat map data are imported into ArcGIS software for projection transformation (geographic coordinate system GCS_WGS_1984). The heat map data from selected weekdays and weekends are processed by the raster calculator to obtain averaged heat maps for weekdays and weekends. Subsequently, the same procedure is applied to the heat maps of the two days to derive the overall average daily heat map for the entire week. Next, the preprocessed POI data are overlaid with the overall average daily heat map. Utilizing the “zonal statistics” tool, the “overall average daily heat map” is employed as raster data to assign a heat value to each POI point. The heat map data is directly sourced from the Baidu Maps platform, ensuring authenticity and reliability, and Baidu Maps has been ethically authorized by users to disclose their location data. However, despite being an image with data, the heat map does not provide real-time information but serves as a depiction of the past spatial and temporal distribution of users (Lv, Zheng, and Hu Citation2022).
2.3.2. Spatial syntax
Spatial syntax theory was first proposed by Professor Bill Hillier of the University of London in 1970, based on the principles of graph theory, to describe architecture and urban space from a new perspective and relate it to human society. Spatial syntax theory has been commonly applied in urban planning and architecture. In this paper, the four variables of global integration, local integration, comprehensibility, and efficiency value of the spatial syntax axis model are selected for analysis.
The Axis Analysis method is based on an axis model for analysis and provides metrics for the space. Global integration of axes is the integration of axes at an unrestricted radius, which is used to express the integration pattern at the largest scale; local integration of axes is the integration of axes at a radius of 3 (the starting axis itself is 1 step by default, and 2 steps from the starting axis to other axes), which expresses the integration pattern of a localized space; comprehensibility of axes is the degree of importance of a particular axis in the whole system, which is based on the number of axes that are directly connected to that axis; higher correlation indicates higher comprehensibility, implying the importance of a local spatial structure from a localized perspective. A higher correlation indicates a higher degree of comprehensibility, implying that the overall spatial structure can be inferred from the local spatial structure; the efficiency value can be regarded as a measure of cost and benefit, which is used to measure the degree of efficient operation of the spatial network (Yang et al. Citation2023).
The axial segments of the road network can be processed directly in Depthmap with the help of “axial analysis” function to get the global integration degree and efficiency value, and then carry out “axial analysis” again to set the appropriate radius value to get the local integration degree. The axial model of Depthmap is imported into ArcGIS, and then the data table of axial model is exported from ArcGIS as a “txt file”, and then the file is transformed into an Excel table, and then imported into SPSS to carry out regression analysis on the global and local integration degree, and finally get the comprehensibility degree. The purpose of choosing these four parameters is mainly to serve as control variables when doing the impact analysis of mall vitality and park vitality, and to explore the correlation between the two under different road axis models. Secondly, by adding the road network morphology analysis, the layout of the current parks and shopping malls can be analyzed, and more reasonable planning advice can be given for future urban construction by combining the main research results of this paper.
Spatial syntactic theory recognizes and quantifies the interactions between space and social relations through topological relations, thus guiding spatial analysis. However, the method simply describes space by using spatial factors as parameters only, and the final parameter values obtained are rough.
2.3.3. Correlation analysis
Correlation analysis is utilized to scrutinize the relationship between two variables. In everyday scenarios, the correlation between these variables is often impacted by a third variable, rendering the correlation coefficient incapable of fully reflecting the linear correlation between them. Hence, this study further employs road network morphology as a control variable and utilizes both linear and nonlinear methods for correlation analysis. The outcomes authentically delineate the extent of the influence of mall vitality on park vitality, serving as a measure of their correlation. The larger the correlation coefficient, the stronger the correlation, with values ranging from −1 to 1.
(1) Linear analytical method: partial correlation analysis.
The computational steps are as follows:
a: The partial correlation coefficient r
Where is the correlation coefficient between X and Y;
is the correlation coefficient between X and Z; and
is the correlation coefficient between Y and Z.
b: Correlation coefficient r’
where is the observation value from the x sample;
is the observation value from the y sample;
and
are the average values of each sample, respectively.
c: The basic steps in testing the judgment of whether there is a significant partial correlation between the two totals from which the sample comes are:
1) Establish the test hypothesis and determine the test level. H0: there is no linear correlation between the two variables; H1: there is a linear correlation between the two variables. α = 0.05
2) Calculate the test statistic t
where r is the coefficient of partial correlation, n is the sample size, and q is the order of partial correlation. The statistic t follows a t-distribution with n-q-2 degrees of freedom.
3) Determine the p-value and make inferential conclusions
According to the degree of freedom as ν=n-q-2, check the “t-boundary value table” to obtain the p value. Compare the p value with α, when p < α, then reject H0, indicating that there is a linear correlation between the two, the degree of correlation is the correlation coefficient r; on the contrary, there is no linear correlation.
When r > 0, there is a positive correlation between the two variables; when r < 0, there is a negative correlation between the two variables. When 0.7 ≤ |r| ≤ 1, the correlation between the two variables is extremely strong; when 0.5 ≤ |r| ≤ 0.7, the relationship between the two variables is strong; when 0.3 ≤ |r| ≤ 5, the correlation is fair; when 0 ≤ |r| ≤ 0.3, the correlation is weak; and when r = 0, the correlation is not relevant.
Partial correlation analysis can only measure linear relationships, but recent studies have shown that nonlinear techniques should be more suitable for urban environmental research because cities are self-organizing complex systems. Therefore, this paper also uses a statistical test method for the degree of non-linear correlation, namely Kendall ‘s tau.
(2) Nonlinear analysis method : Kendall ‘s tau
Kendall ‘s tau is a statistic used to measure the order relationship between two variables. It is calculated based on ranking data, rather than using raw data directly (Shi et al. Citation2023). Kendall “s tau can provide a more accurate correlation measure in the urban field, especially in the analysis of urban planning decisions, traffic flow, urban spatial structure, etc., because it does not require specific distribution assumptions on the data. It mainly includes a series of correlation coefficients such as Somers ” D, Goodman-kruskal ‘s gamma (γ) and Kendall ‘s tau (a, b, c). The most commonly used correlation coefficients are Kendall ‘s tau-b and Kendall ‘s tau-c. It is generally believed that tau-b is more suitable for the case of equal number of two-variable classifications, and tau-c is more suitable for the case of unequal number of two-variable classifications. In this paper, the tau-b correlation coefficient in Kendall ‘s is calculated, and the calculation formula is as follow (Bukovsek and Stopar Citation2023; Shi et al. Citation2023):
Where, C is the number of concordant pairs in pairwise comparison pairs; D is the number of non-concordant pairs in pairwise comparisons; T is the total logarithm of pairwise comparison, n (n-1)/2, n is the sample size; refers to the number of invariant pairs in which the X value is constant;
refers to the number of invariant pairs with constant Y value.
3. Data analysis
3.1. Vitality analysis
The heat map in TIFF format was imported into ArcGIS, and the heat maps of two days were obtained using the raster calculator to obtain the average daily heat maps of weekdays () and rest days (), and the total average daily heat map of a week was obtained using the average daily heat maps of weekdays and rest days (). In this study, the heat map was divided into six levels, with levels 1–2 being the low-heat zone, levels 3–4 being the secondary heat zone, and levels 5–6 being the high-heat zone.
Figure 3. Daily average heat map.
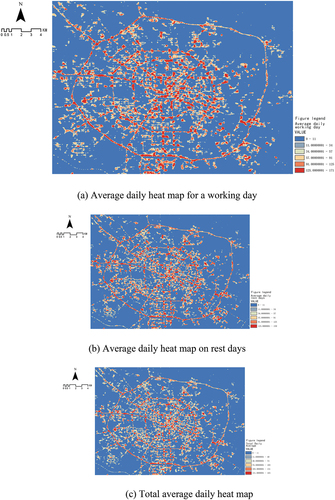
Comparing the average daily heat map on rest days with the average daily heat map on weekdays, we can see that the trend of crowd vitality decreases from the center of the first ring to the outside, and the high vitality areas are mainly concentrated in the center of the first ring, the three-ring roads, and some major roads, indicating that crowd activities in the city are mainly concentrated in the traffic arteries and commercial leisure areas. Compared with the rest of the days, the high and sub-heat areas increased significantly on weekdays, mainly including the entire first ring area and the area around Tianfu Interchange.
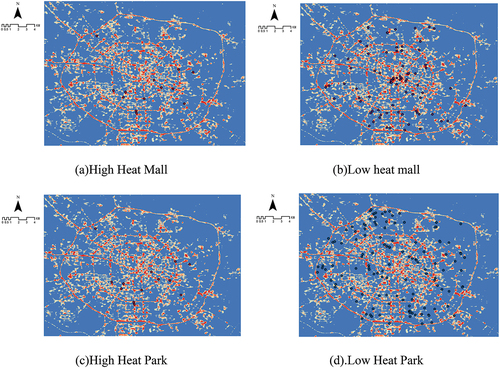
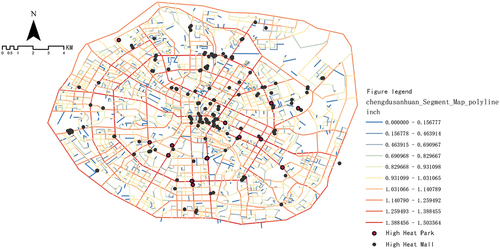
The collated Excel tables of malls and parks were imported into ArcGIS, converted into elemental points, and exported to maps to obtain the POI points of malls and parks, which were overlaid with the total average daily heat map. The heat value was assigned to each POI point by zoning statistics using the average daily heat map as the raster data, and 151 high-heat malls (), 85 low-heat malls (), 13 high-heat parks (), and 128 low-heat parks () were selected. The data showed that the number of high-heat malls within the third ring of Chengdu was significantly higher than that of low-heat malls, indicating the overall high vitality and utilization of malls in the urban areas within the third ring of Chengdu. There was a clear clustering of both high- and low-heat malls within the First Ring, and there were multiple clusters of high-heat malls with a more even distribution overall. Almost all the high-heat parks are located south of the First Ring Road, while the low-heat parks are more evenly distributed, reflecting the fact that the utilization and development of urban parks within the Third Ring Road are not reasonable, which may be related to the uneven development of the southern and northern parts of the city. Studying the correlation between park vitality and commercial vitality, and exploring the possibility of a joint layout of parks and shopping malls may be able to make some improvements to this current situation.
Figure 4. Distribution of parks and shopping malls.
3.2. Syntactic analysis
3.2.1. Global integration degree
The global integration degree describes the “accessibility” of the research object in the entire system space; the higher the value, the stronger the connection between the research object and the space. In this study, the global accessibility of an object in a space was expressed by the global integration degree of the object’s location.
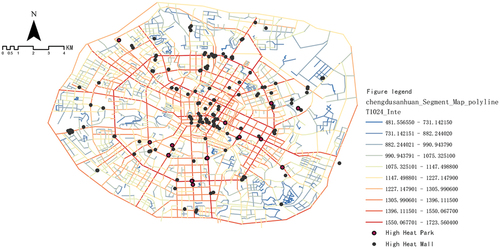
A warmer color of the axis segments in the depth map indicates higher values. By overlaying the high thermal parks and shopping malls with the global integration axis model (), we can see that the global integration of the road network within the First Ring is high, and that most of the axis segments are in the high integration range, reflecting its high accessibility, centrality, and pedestrian aggregation power. At the same time, the global integration of roads in the northwest, northeast, southwest, and south directions centered on the First Ring Road is also high, which is in line with the regional development strategy of “eastward, southward, westward control, north reform, and middle excellence” proposed by Chengdu in 2017. Second, it is easy to observe the distribution of high-heat parks and shopping malls, which are basically located in high-integration areas, and almost all high-heat parks are adjacent to high-heat shopping malls, indicating that the vitality of parks and shopping malls is related to global road accessibility.
Figure 5. Overlay of high heat park, mall and global integration.
3.2.2. Local integration degree
Unlike global integration, local integration is a radius of 3 (actually the axis itself defaults to 1 step from the starting axis) The axis integration degree (2 steps to other axes) is the degree of integration of the study object in the local space (Yang et al. Citation2023). According to the daily living habits of the residents, a ten-minute living circle is appropriate; therefore, the radius of the local integration degree is set to 800 m (The screening distance range below is based on a ten-minute living circle of 800 m).
From the overlay of local integration with high-vitality parks and shopping malls (), it can be seen that the road axis sections with high local integration are still mainly concentrated in the first ring area, and there is also a large distribution in the northwest, while the local integration of roads in the northeast direction is generally low. Looking at the locations of high-vitality parks and high-vitality shopping malls, we can see that most of the high-vitality parks are located in areas with low local integration, indicating that park vitality is less affected by local integration, while the distribution of high-vitality shopping malls has no obvious relationship with local integration.
Figure 6. Overlay of high heat park, mall and local integration degree.
The global integration and local integration values were filtered in ArcGIS, and four maps were obtained: the area with high global and local integration (), the area with high global and low local integration (), the area with low global and low local integration (), and the area with low global and high local integration (), which showed that the road structure within the first ring of Chengdu was the most reasonable and perfect, while many areas outside this range The accessibility of the roads in the Third Ring Road area as a whole needs to be improved. Then, using the “Data Management Tool,” we filtered out the high- and low-heat parks in the area, and further calculated the number of shopping malls within 800 m of the park and the number of high-heat malls, and finally obtained the results in . Among them, the global low and local high regional road axis segments are too few, which affects the data analysis; therefore, they are not recorded. It can be seen from that the ratios of high-heat malls and low-heat malls to high-heat parks in each region are greater than those to low-heat parks, and the ratio of the number of high-heat malls to low-heat malls within 800 m of the high-heat parks is higher than that of the low-heat parks. These data indicate that there is a positive correlation between mall vitality and park vitality (positive correlation) and that the correlation between the two vitalities is influenced by road accessibility. The correlation between mall vitality and park vitality and the magnitude of the correlation are verified in the following section.
Figure 7. Integration degree screening chart.
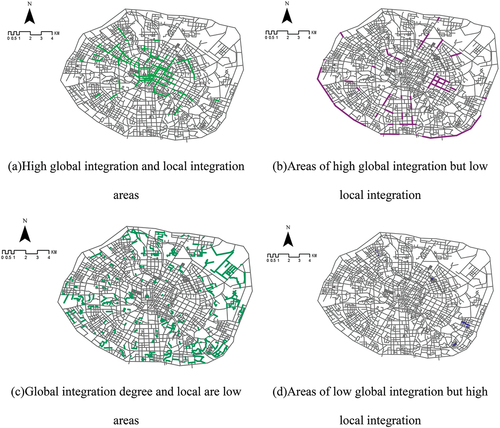
Table 1. Number of parks and malls statistics (degree of integration).
3.2.3. Comprehensibility
Comprehensibility is a variable that describes the importance of the object of study in the overall system and is expressed as the correlation between local and global integration. A higher correlation indicates higher comprehensibility, that is, it is easier to infer the overall spatial structure from the local space (Yang et al. Citation2023).
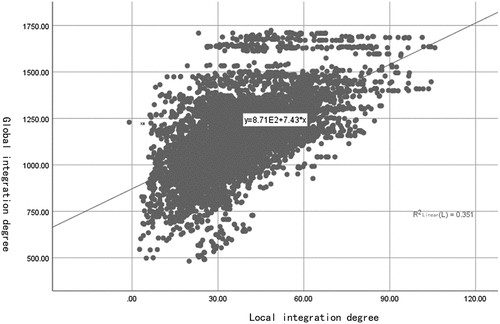
After importing the axial model in Depthmap into ArcGIS and exporting its attribute table, then open the processed Excel table in SPSS and utilize its data analysis function to do regression analysis on the global integration degree and the local integration degree, and finally get the scatter plot of the comprehensibility of the axial system (). The linear regression equation was y = 8.71E2 + 7.43*x. Spatial syntax theory suggests that when R2 < 0.5, the comprehensibility of space is poor. From the results of the regression analysis, it can be seen that the fitted value of R2 = 0.351 < 0.5 for the comprehensibility of the urban area within the third ring of Chengdu, which is not highly comprehensible, indicates that it is difficult to infer the overall spatial structure within the third ring of Chengdu from the local space, and this should be improved in the future urban planning and construction.
Figure 8. Comprehensibility of the axial system within the three rings.
3.2.4. Efficiency value
The efficiency value is the quotient of the selectivity and total depth, and is used to measure how efficiently the spatial network operates. The total depth can be considered as a cost, that is, the cost of distance for a person to travel from all surrounding cells to a destination cell, while selectivity can be considered as a benefit, that is, the ability of a person to encounter all people from other cells just in that cell. Thus, the efficiency value can also be considered a measure of cost and benefit (Yang et al. Citation2023).
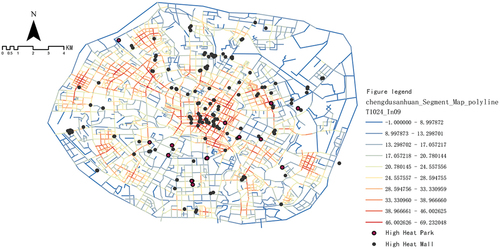
The analysis of the model overlay of high-heat parks, shopping malls, and efficiency value axis segments () shows that the overall road network structure in the urban area within the Third Ring Road of Chengdu has a high efficiency value, which is reflected in the efficiency of the traffic operation. The high heat park and shopping mall are also located in the area with high efficiency values, indicating that the road network efficiency values have some influence on the vitality of both.
Figure 9. High heat park, mall and efficiency value overlay graph.
In ArcGIS software, the axial segment model of efficiency value is divided into two parts: high efficiency value and low efficiency value, then use “data management tool” to filter and count the number of high heat and low heat parks in different areas, then count the number of malls and high heat malls within 800 m of the park, and finally get . It can be seen that the ratio of high-heat malls, low-heat malls, to high-heat parks is greater than that of low-heat parks, and the ratio of high-heat malls to low-heat malls within 800 m of high- heat parks is higher than that of low-heat parks, which is consistent with the above conclusion and further confirms that mall vitality has an impact on park vitality. In addition, comparing the ratios of high-efficiency areas with low-efficiency areas, we found that the influence of mall vitality on park vitality was not related to the road efficiency value.
Table 2. Number of parks and malls statistics (Efficiency Values).
3.2.5. Correlation analysis
3.2.5.1 Partial correlation analysis
In ArcGIS software, the POI data points of high heat park, low heat park, shopping mall, and high heat mall were summarized on the adjacent road network axis segments with 800 m as the search radius, and then the final summarized attribute table was exported to the Excel table and imported into SPSS. The global integration degree, local integration degree, and efficiency value were used as the control variables to make partial correlations between high heat park, low heat park, high heat mall, and low heat mall (). The results of the correlation analysis showed that the correlations between the global integration degree, low heat park, high heat mall and low heat mall were 0.777 and 0.820 respectively, and the correlations between high heat park, high heat mall and low heat mall were 0.797 and 0.872 respectively; the correlations between low heat park, high heat mall and low heat mall were 0.797 and 0.872 respectively with the local integration degree as the control variable. 0.739 and 0.780 for high heat mall, and low heat mall, and 0.770 and 0.842 for the high heat park, high heat mall, and low heat mall, respectively, with the efficiency value as the control variable, the correlations between the low heat park, high heat mall and low heat mall are 0.774 and 0.820, and the correlations between high heat park, high heat mall and low heat mall were 0.795 and 0.871, respectively. This shows that park vitality is significantly influenced by mall vitality, confirming the inference that mall vitality has an effect on park vitality. It can also be found that high-heat parks are significantly more influenced by mall vitality than low-heat parks. The effect of low-heat malls on park vitality was slightly stronger than that of high-heat malls, a phenomenon that may be due to the more even distribution of low-heat malls compared to high-heat malls.
Table 3. Correlation analysis between park vitality and mall vitality.
3.2.5.2 Kendall’s tau rank correlation coefficient
Partial correlation analysis can only measure linear relationships, but recent studies have shown that nonlinear techniques should be more suitable for urban environmental research because cities are self-organizing complex systems. We use nonlinear analysis method to further confirm the correlation between the vitality of shopping malls and the vitality of parks. is the result of our nonlinear correlation analysis of high-heat and low-heat parks and high-heat and low-heat shopping malls using Kendall ‘s tau rank correlation coefficient. The Kendall ‘s correlation coefficient ranges from-1 to 1, where 1 indicates a completely positive correlation, −1 indicates a completely negative correlation, and 0 indicates no correlation. In the calculation process, we take the global integration degree, local integration degree and efficiency value as control variables, and exclude the influence of road accessibility on the vitality of the mall crowd and the park crowd. In terms of correlation strength, the analysis results show that : in the case of global integration as the control variable, the correlation between parks with high crowd vitality and shopping malls with high crowd vitality is 0.71. In the case of local integration as the control variable, the correlation between parks with high crowd vitality and shopping malls with high crowd vitality is 0.69. With the efficiency value as the control variable, the correlation between the parks with high population vitality and the shopping malls with high population vitality is 0.71. The absolute value of the correlation coefficient is close to 0.7, so the park crowd vitality and shopping mall crowd vitality are considered to be strong correlation.
Table 4. Nonlinear correlation analysis of park vitality and shopping mall vitality.
Based on the above analysis, it is recommended to consider that the crowd vitality of the mall may have an impact on the crowd vitality of the park. Therefore, in the future urban planning, it is recommended to adopt a joint layout strategy to arrange shopping malls and parks in adjacent or close areas to promote interaction and vitality within the city. This joint layout can increase the attractiveness of the city, enhance the experience of residents and tourists, and contribute to the sustainable development of the city.
4. Discussions
4.1. Correlation between park vitality and business vitality
The study initially speculated that there is a correlation between mall vitality and park vitality through quantitative characterization of the axial model, and that the correlation is affected by the global and local integration of the roadway. The correlation analysis further verified that mall vitality has an impact on park vitality, and the correlation between both high and low vitality malls and park vitality exceeds 0.7, which is significant. The above study indicates the deficiencies of the road network structure in the study area, which can provide guidance for road planning and layout, and also proves the correlation between park vitality and shopping mall vitality, which can provide suggestions for the future land use layout pattern in Chengdu City.
Compared with previous studies, this paper integrates Baidu heat map and space syntax model, and uses linear and nonlinear correlation analysis methods. It shows the influence of road network structure on the vitality of the two, and further verifies the vitality correlation between parks and shopping malls.
4.2. Strengths and limitations of the article
In this study, Baidu heat map data was coupled with the spatial syntactic axis model to analyze the spatial distribution maps of shopping malls and parks with different vitality. Partial correlation analysis and Kendall ‘s tau analysis were used to prove the correlation between the vitality of shopping malls and the vitality of parks. This method combines linear and nonlinear methods to analyze the complex system of the city, which can clearly explain the relationship between variables and help us analyze the mechanism and reasons behind the data (Elmarakby and Elkadi Citation2024).
However, as a complex nonlinear giant system, we only use correlation analysis to analyze the current situation of the city and put forward planning suggestions. However, in terms of detecting the influencing factors of park vitality and mall vitality, artificial intelligence models such as random forest will have better performance, especially good at dealing with high-dimensional and complex data (Lin, Wei, and Guan Citation2024; Lin, Zhuang, et al. Citation2023).
In addition, this study chooses Baidu heat map for vitality measurement, although it has the advantages of high data accuracy and short update cycle compared with other data such as social media data and cell phone signaling data (Lin, Zhang, et al. Citation2023), it is still a static data study of the past, and it is difficult to analyze the correlation changes in real time. Meanwhile, the selection of independent variables in the study is insufficient, and more factors can be selected as control variables to get more accurate correlation.
In future research, we will use more complex artificial intelligence models to measure the relationship between park vitality and shopping mall vitality, and increase the analysis of the correlation between park vitality and shopping mall vitality at different times of the day. In addition, more factors will be selected to analyze their effects on the correlation between the two activities.
5. Conclusions
In this study, we analyzed the distribution of high and low vitality values of shopping malls and parks within the third ring of Chengdu using Baidu heat maps. Then, we computed road accessibility within the study area based on spatial syntax theory, finding that vitality values of both shopping malls and parks vary with road accessibility. Subsequently, we performed linear and non-linear analysis methods to examine the correlation between park and mall vitality values to determine their significance. Our conclusions are as follows:
Firstly, regarding mall vitality, Chengdu’s inner urban area within the third ring exhibits overall high and relatively evenly distributed mall vitality, with high-vitality malls concentrated mainly within the first ring road. Concerning park vitality, high-vitality parks are notably more prevalent in the southern part of the city compared to the northern part, reflecting urban planning policies focusing on the development of the first ring road and the southern region.
Secondly, the overall road accessibility within Chengdu’s third ring urban area is relatively high, ranging from 0.9 to 1.5, but there are areas with low local integration. Which is shows that the overall accessibility of the city is good, but the local roads have the problems of complex network structure, many branches or unclear road connections. High vitality parks and shopping malls are located in areas with high global integration and efficiency values. The calorific value of parks and shopping malls varies with road accessibility. In places with high road accessibility, the calorific value of parks and shopping malls is higher. Therefore, focusing on improving the accessibility of roads around parks and shopping malls is critical to improving urban vitality.
In addition, the partial correlation method was used for linear analysis. The results showed that the correlation between the vitality of shopping malls and the vitality of parks was significant, and the correlation between high-vigor shopping malls and high-vigor parks exceeded 0.7. The impact of high vitality parks on the vitality of shopping malls is significantly greater than that of low vitality parks. For example, with efficiency value as the control variable, the correlation between low vitality parks and high vitality shopping malls and low vitality shopping malls is 0.774 and 0.820, respectively. The correlation between high vitality parks and high vitality shopping malls and low calorific value shopping malls is 0.795 and 0.871, respectively, indicating that the vitality of shopping malls can promote the vitality of parks. Using Kendall ‘s tau method for nonlinear analysis, the results show that the correlation coefficients of the four variables of high thermal value park, high thermal value shopping mall, low thermal value shopping mall and low thermal value park are all positive. There is a positive correlation between the variables, that is, the increase of one variable is accompanied by the increase of another variable. In addition, the absolute value of the correlation coefficient is close to 0.7, so the park crowd vitality and shopping mall crowd vitality are considered to be strong correlation.
Based on the empirical experience of “Park City” Chengdu, we propose the following recommendations: 1) Emphasize park construction while also focusing on improving the surrounding living environment to increase park utilization. 2) In view of the problems of complex local road network structure, numerous branches or unclear road connections, future planning and construction should focus on the overall space, optimize the road system and improve road accessibility. 3) The significant correlation between mall vitality and park vitality, influenced by road integration, suggests considering joint layouts in future planning to maximize commercial vitality. Our findings can assist urban planners and environmental managers in rational urban planning to boost urban vitality.
Disclosure statement
No potential conflict of interest was reported by the author(s).
Additional information
Notes on contributors
Lu Che
Lu Che is a PhD candidate at the College of Environment and Resources, southwest university of science and technology. She mainly researches city planning distribution.
Yuan Deng
Yuan Deng is a postgraduate student in the School of Civil Engineering and Architecture, southwest university of science and technology. His main research direction is Park city design.
Sidai Guo
Sidai Guo is a Professor and doctoral supervisor of southwest university of science and technology. He is mainly engaged in the research of environmental economy and management.
References
- Benson, E. 2002. “Rivers As Urban Landscapes: Renaissance of the Waterfront.” Water Science and Technology 45 (11): 65–70. https://doi.org/10.2166/wst.2002.0380.
- Bukovsek, D. K., and N. Stopar. 2023. “On the Exact Regions Determined by Kendall’s Tau and Other Concordance Measures.” Mediterranean Journal of Mathematics 20 (3). https://doi.org/10.1007/s00009-023-02350-0.
- Dong, Q. D., J. Cai, S. Chen, P. He, and X. Chen. 2022. “Spatiotemporal Analysis of Urban Green Spatial Vitality and the Corresponding Influencing Factors: A Case Study of Chengdu, China.” The Land 11 (10): 1820. https://doi.org/10.3390/land11101820.
- Elmarakby, E., and H. Elkadi. 2024. “Impact of Urban Morphology on Urban Heat Island in Manchester’s Transit-Oriented Development.” Journal of Cleaner Production 434:434. https://doi.org/10.1016/j.jclepro.2023.140009.
- Fan, Z. X., J. Duan, M. Luo, H. Zhan, M. Liu, and W. Peng. 2021. “How Did Built Environment Affect Urban Vitality in Urban Waterfronts? A Case Study in Nanjing Reach of Yangtze River.” ISPRS International Journal of Geo-Information 10 (9): 611. https://doi.org/10.3390/ijgi10090611.
- Gómez-Varo, I., X. Delclòs-Alió, and C. Miralles-Guasch. 2022. “Jane Jacobs Reloaded: A Contemporary Operationalization of Urban Vitality in a District in Barcelona.” Cities 123:123. https://doi.org/10.1016/j.cities.2022.103565.
- Guo, Y. Y., G. P. Lei, and L. Y. Zhang. 2023. “Quality Evaluation of Park Green Space Based on Multi-Source Spatial Data in Shenyang.” Sustainability 15 (11): 8991. https://doi.org/10.3390/su15118991.
- Hong, X. C., S. Li, T. Chen, X. Ji, and X. Song. 2024. “Spatial Performance Evaluation and Optimization of Integrated Aboveground and Underground Spaces in Urban Commercial Complexes.” Journal of Asian Architecture and Building Engineering: 1–27. https://doi.org/10.1080/13467581.2024.2306367.
- Jing, C. B., W. Zhou, Y. Qian, and J. Yan. 2020. “Mapping the Urban Population in Residential Neighborhoods by Integrating Remote Sensing and Crowdsourcing Data.” Remote Sensing 12 (19): 3235. https://doi.org/10.3390/rs12193235.
- Lee, S. H., and J. E. Kang. 2022. “Impact of Particulate Matter and Urban Spatial Characteristics on Urban Vitality Using Spatiotemporal Big Data.” Cities 131:131. https://doi.org/10.1016/j.cities.2022.104030.
- Li, Z. H., H. Chen, and W. T. Yan. 2021. “Exploring Spatial Distribution of Urban Park Service Areas in Shanghai Based on Travel Time Estimation: A Method Combining Multi-Source Data.” ISPRS International Journal of Geo-Information 10 (9): 608. https://doi.org/10.3390/ijgi10090608.
- Li, Q., C. Cui, F. Liu, Q. Wu, Y. Run, and Z. Han. 2022. “Multidimensional Urban Vitality on Streets: Spatial Patterns and Influence Factor Identification Using Multisource Urban Data.” ISPRS International Journal of Geo-Information 11 (1): 2. https://doi.org/10.3390/ijgi11010002.
- Lin, J. Y., K. Q. Wei, and Z. F. Guan. 2024. “Exploring the Connection Between Morphological Characteristic of Built-Up Areas and Surface Heat Islands Based on MSPA.” Urban Climate 53:53. https://doi.org/10.1016/j.uclim.2023.101764.
- Lin, J. Y., W. Zhang, Y. Wen, and S. Qiu. 2023. “Evaluating the Association Between Morphological Characteristics of Urban Land and Pluvial Floods Using Machine Learning Methods.” Sustainable Cities and Society 99:104891. https://doi.org/10.1016/j.scs.2023.104891.
- Lin, J. Y., Y. Zhuang, Y. Zhao, H. Li, X. He, and S. Lu. 2023. “Measuring the Non-Linear Relationship Between Three-Dimensional Built Environment and Urban Vitality Based on a Random Forest Model.” International Journal of Environmental Research and Public Health 20 (1): 734. https://doi.org/10.3390/ijerph20010734.
- Li, M. Y., and J. H. Pan. 2023. “Assessment of Influence Mechanisms of Built Environment on Street Vitality Using Multisource Spatial Data: A Case Study in Qingdao, China.” Sustainability 15 (2): 15(2. https://doi.org/10.3390/su15021518.
- Li, Z. T., and G. W. Zhao. 2023. “Revealing the Spatio-Temporal Heterogeneity of the Association Between the Built Environment and Urban Vitality in Shenzhen.” ISPRS International Journal of Geo-Information 12 (10): 433. https://doi.org/10.3390/ijgi12100433.
- Lv, G. Y., S. Zheng, and W. Hu. 2022. “Exploring the Relationship Between the Built Environment and Block Vitality Based on Multi-Source Big Data: An Analysis in Shenzhen, China.” Geomatics, Natural Hazards and Risk 13 (1): 1593–1613. https://doi.org/10.1080/19475705.2022.2091484.
- Mohamed, A. A., R. Ubareviciene, and M. van Ham. 2022. “Morphological Evaluation and Regeneration of Informal Settlements: An Experience-Based Urban Design Approach.” Cities 128:128. https://doi.org/10.1016/j.cities.2022.103798.
- Mu, B., C. Liu, T. Mu, X. Xu, G. Tian, Y. Zhang, and G. Kim. 2021. “Spatiotemporal Fluctuations in Urban Park Spatial Vitality Determined by On-Site Observation and Behavior Mapping: A Case Study of Three Parks in Zhengzhou City, China.” Urban Forestry & Urban Greening 64:127246. https://doi.org/10.1016/j.ufug.2021.127246.
- Peng, Y. S., J. Liu, T. Zhang, and X. Li. 2021. “The Relationship Between Urban Population Density Distribution and Land Use in Guangzhou, China: A Spatial Spillover Perspective.” International Journal of Environmental Research and Public Health 18 (22): 12160. https://doi.org/10.3390/ijerph182212160.
- Qin, Y. C., M. Yao, L. Shen, and Q. Wang. 2022. “Comprehensive Evaluation of Functional Diversity of Urban Commercial Complexes Based on Dissipative Structure Theory and Synergy Theory: A Case of SM City Plaza in Xiamen, China.” Sustainability 14 (1): 67. https://doi.org/10.3390/su14010067.
- Shi, X. Y., Y. Jiang, J. Du, and Z. Miao. 2023. “An Adaptive Test Based on Kendall’s Tau for Independence in High Dimensions.” Journal of Nonparametric Statistics: 1–24. https://doi.org/10.1080/10485252.2023.2296521.
- Song, Y., Y. Lyu, S. Qian, X. Zhang, H. Lin, and S. Wang. 2022. “Identifying Urban Candidate Brownfield Sites Using Multi-Source Data: The Case of Changchun City, China.” Land Use Policy 117:106084. https://doi.org/10.1016/j.landusepol.2022.106084.
- Sugier, P. 2001. “The Dynamics of Aquatic and Rush Vegetation and Landscape Changes of the Lake Moszne in the Polesie National Park.” In 12th International Symposium on Problems of Landscape Ecological, 257–264. Vol. 20. Ekologia-Bratislava.
- Sung, W. P., and C. H. Liu. 2022. “Effects of COVID-19-Epidemic-Related Changes in Human Behaviors on Air Quality and Human Health in Metropolitan Parks.” Atmosphere 13 (2): 276. https://doi.org/10.3390/atmos13020276.
- Sun, D., Q. Li, W. Gao, G. Huang, N. Tang, M. Lyu, Y. Yu, et al. 2021. “On the Relation Between Visual Quality and Landscape Characteristics: A Case Study Application to the Waterfront Linear Parks in Shenyang, China.” Environmental Research Communications 3 (11): 115013. https://doi.org/10.1088/2515-7620/ac34c7.
- Tang, S. W., and N. Ta. 2022. “How the Built Environment Affects the Spatiotemporal Pattern of Urban Vitality: A Comparison Among Different Urban Functional Areas.” Computational Urban Science 2 (1). https://doi.org/10.1007/s43762-022-00069-4.
- Wang, B., Y. Lei, D. Xue, J. Liu, and C. Wei. 2022. “Elaborating Spatiotemporal Associations Between the Built Environment and Urban Vibrancy: A Case of Guangzhou City, China.” Chinese Geographical Science 32 (3): 480–492. https://doi.org/10.1007/s11769-022-1272-6.
- Wang, T. W., Y. Li, H. Li, S. Chen, H. Li, and Y. Zhang. 2022. “Research on the Vitality Evaluation of Parks and Squares in Medium-Sized Chinese Cities from the Perspective of Urban Functional Areas.” International Journal of Environmental Research and Public Health 19 (22): 19(22. https://doi.org/10.3390/ijerph192215238.
- Wei, J. X., W. Yue, M. Li, and J. Gao. 2022. “Mapping Human Perception of Urban Landscape from Street-View Images: A Deep-Learning Approach.” International Journal of Applied Earth Observation and Geoinformation 112:102886. https://doi.org/10.1016/j.jag.2022.102886.
- Xu, Y. J., and X. S. Chen. 2023. “Uncovering the Relationship Among Spatial Vitality, Perception, and Environment of Urban Underground Space in the Metro Zone.” Underground Space 12:167–182. https://doi.org/10.1016/j.undsp.2023.02.010.
- Yang, H., Q. He, L. Cui, and A. M. Mohamed Taha. 2023. “Exploring the Spatial Relationship Between Urban Vitality and Urban Carbon Emissions.” Remote Sensing 15 (8): 2173. https://doi.org/10.3390/rs15082173.
- Yu, D. J., X. Wang, P. Liang, and X. Sun. 2022. “Spatio-Temporal Convolutional Residual Network for Regional Commercial Vitality Prediction.” Multimedia Tools and Applications 81 (19): 27923–27948. https://doi.org/10.1007/s11042-022-12845-9.
- Zhang, Z. H., Y. Zhang, T. He, and R. Xiao. 2022. “Urban Vitality and Its Influencing Factors: Comparative Analysis Based on Taxi Trajectory Data.” IEEE Journal of Selected Topics in Applied Earth Observations and Remote Sensing 15:5102–5114. https://doi.org/10.1109/JSTARS.2022.3183176.
- Zhao, X., Y. Zhou, W. Chen, X. Li, X. Li, and D. Li. 2021. “Mapping Hourly Population Dynamics Using Remotely Sensed and Geospatial Data: A Case Study in Beijing, China.” GIScience & Remote Sensing 58 (5): 717–732. https://doi.org/10.1080/15481603.2021.1935128.
- Zhou, J. L., P. H. Wang, and L. F. Xie. 2023. “Exploring the Interplay Between Small-Scale Commerce and Traffic Flow Dynamics in Macao Historical Districts for Sustainable Urban Development.” Journal of the Knowledge Economy. https://doi.org/10.1007/s13132-023-01653-7.
- Zhu, J. Y., H. Lu, T. Zheng, Y. Rong, C. Wang, W. Zhang, Y. Yan, and L. Tang. 2020. “Vitality of Urban Parks and its Influencing Factors from the Perspective of Recreational Service Supply, Demand, and Spatial Links.” International Journal of Environmental Research and Public Health 17 (5): 1615. https://doi.org/10.3390/ijerph17051615.