
ABSTRACT
City color, serving as a pivotal element within the urban landscape, has garnered significant scholarly attention. Numerous cities have diligently instituted city color planning initiatives to enhance urban landscapes and cultivate city images. The color preference of citizens serves as a crucial foundation for the systematic development of city color planning. Nevertheless, the dynamic aspect of city color preferences is frequently neglected in previous research. Therefore, this article examined seasonal variations in city color preferences using Busan Metropolitan City, South Korea, as an illustrative case. Data collected through a questionnaire survey underwent statistical analyses, including the chi-square test, Wilcoxon rank sum test, and multiple logistic regression, to investigate the influence of seasons on city color preference. The findings revealed that seasons primarily impact the hue preferences in city colors, rather than brightness and chroma preferences. Furthermore, sex and age factors were introduced, and the Cochran–Mantel–Haenszel (CMH) test was employed to identify demographic groups exhibiting seasonal variations in city color preferences. The analysis disclosed noteworthy seasonal disparities in city color preference, particularly among middle-aged and elderly males, who exhibited a significant decrease in preference for yellow and a notable increase in preference for green during winter compared to summer. The outcomes of this study provide valuable insights for informing city color planning. Additionally, the distinctive city color preferences observed among different demographic groups can be effectively applied in urban regeneration initiatives, thereby contributing to human well-being.
1. Introduction
Human experience is predominantly influenced by perceptions, encompassing the acceptance and interpretation of information from the external environment. Our sensory organs collect these perceptions, with visual stimuli constituting 87% of sensory input and color representing 70% of visual stimuli (Correy Citation1982). Consequently, scholars from various disciplines extensively research color, including color science, color psychology, and color geography. Color preference, among the facets of color study, has consistently captivated researchers across diverse fields, such as psychologists, planners, and artists. Studying color preferences provides a means to understand how perceptual experiences map onto cognitive and affective judgments (Schloss et al. Citation2018). Moreover, numerous studies confirm substantial individual differences in color preferences, with sex and age being prominent areas of exploration. Notably, there is robust evidence indicating significant age-related disparities in color preferences (Gong and Lee Citation2017; Ou et al. Citation2004). Wijk et al. (Citation1999) observed a decline in the preference for blue and an increase in the preference for red with advancing age. Similarly, Yujing et al. (Citation2019) reported that preferences for orange and several dark colors increased with age among Chinese adults, while preferences for bluish, purple, yellow, white, black, and light colors decreased. Actually, age-related weaknesses in color discrimination and color perception intensity are primarily attributed to the rise in optical density of the crystalline lens and reduced illuminance of the retina (Beke et al. Citation2008). This decline in transmission during aging is particularly noticeable for short-wavelength light, resulting in increased absorption of the blue part of the visible spectrum (Ken and Yasuro Citation2001). Consequently, scenes perceived by elderly observers tend to appear more yellowish due to the absorbed blue content (Beke et al. Citation2008). Besides the nonlinear optical density changes of the lens, neural functions also seem to decline (Werner John Citation1996). Hence, elderly observers are presumed to perceive visual information, including colors and also spatial and temporal information, in a manner distinct from young adults.
Differently, the existence of sex differences in color preference has been a subject of contention. Certain scholars argue that there are no significant gender differences in color preferences (Eysenck Citation1941; Hurlbert and Ling Citation2007; Wijk et al. Citation1999). Conversely, other studies affirm the presence of noteworthy sex differences in color preferences (Bakker et al. Citation2015; Bonnardel et al. Citation2018; Elliot and Niesta Citation2008; George Citation1938). On average, men and women exhibit different preferences for colors; furthermore, some scholars have tried to explain why sex differences were not consistently identified in previous studies. Ellis and Ficek (Citation2001) speculated that the absence of sex differences in past studies might be attributed to the elderly age of participants, suggesting that sex differences could potentially diminish with age. He et al (Wei et al. Citation2011) pointed out that the contradictory results regarding the color preferences of different sexes may stem from a lack of consistent controls for color stimuli. Zhang et al (Yujing et al. Citation2019) argued that previous studies did not establish consistent levels of brightness and chroma for each color. In fact, some scholars have confirmed the existence of differences in lightness and chroma preferences between men and women (Kazuhiko et al. Citation2015; Yujing et al. Citation2019).
City color, including architectural color, as a branch of color research, has garnered increasing attention recently. Serra and Codoñer (Serra and García Codoñer Citation2014) conducted an analysis of color compositions in postmodern Western architecture, exploring the color of new utopias, neo-illuminist rationalism, figurative postmodernity, and deconstructivism. Li, Yang, and Zheng (Citation2020) surveyed the color harmony of building facades, revealing that a high brightness of a building’s primary color correlates with increased building color harmony, whereas harmony diminishes when the color falls within the green or blue sector. Chen et al (Chen et al. Citation2022) developed a method for quantitatively expressing the degree of color harmony (DCHs), finding that London and Tokyo exhibited the highest DCHs values, followed by Chicago and Paris, with Beijing registering the lowest. Except for aspects of color investigation and color harmony, architectural and city color research extends to color planning and design. For instance, Jaglarz (Jaglarz Citation2023) emphasizes the pivotal role of color in shaping architecture and urban spaces, proposing color strategies for architectural and urban design. Categorizing existing city color guidelines in urban landscape planning. Hirata, Okamura, and Kawahara (Citation2013) discovered that guidelines recommending specific symbolic colors could serve purposes beyond architecture, such as product and brand communication. Jang (Jang Citation2014) examined criteria for selecting urban landscape colors, focusing on color plans in Japan and Korea. In addition, Wen, Himeno, and Chung (Wen, Himeno, and Chung Citation2023a) explored city color planning systems in East Asia through qualitative analysis methods, employing Tokyo, Seoul, and Beijing as case study examples. Simultaneously, there are also some papers focusing on city color planning methods. Simultaneously, papers have focused on city color planning methods. Li, Xu, and Zhang (M. Li, Xu, and Zhang Citation2017) proposed the coordination ranks of city colors and control intensities in city color planning through a geographical information system spatial-sensitivity analysis method based on the theories of geography of colors and city image.
Similarly, some scholars also have delved into researching city color preferences. Hu et al (Hu et al. Citation2023) explored the relationship between street color environment and residents’ perceptions, revealing that red, orange, and blue exhibit a strong positive correlation with the interesting score, while black is positively correlated with a sense of safety. Gou et al (Aiping et al. Citation2022) emphasized the importance of citizens’ color preferences as a fundamental requirement for the scientific formulation of city color planning. Additionally, they examined the color preferences and contributing factors of urban architecture in Shanghai, discovering that citizens favor urban architecture with a predominant red hue, high whiteness, and mid-low chroma. In addition, studies have also confirmed individual differences in city color preferences. For example, Gou et al (Aiping et al. Citation2022) highlighted the influence of gender, age, and monthly income on citizens’ city color hue preferences, with gender and age significantly affecting chroma preferences. Similarly, Wen, Himeno, and Chung (Wen, Himeno, and Chung Citation2023b) identified age as the most significant factor among various individual factors on city color preferences. Furthermore, individual factors predominantly influence the hue and chroma preferences of city colors.
However, a frequently overlooked aspect in the aforementioned research is the dynamic nature of color preferences. There are indications that color preferences can and do vary systematically over time, depending on the temporal context in which the measurements are taken (Schloss and Palmer Citation2017). Arik et al (Arik et al. Citation2016) found that Turkish four-season colors of spring, summer, autumn and winter were bright green, vivid yellow, dull yellow, and dark grayish brown, respectively. Schloss et al (Schloss et al. Citation2017) evaluated the same participants’ preferences for the same colors during fall, winter, spring, and summer in the northeastern United States and found that participants liked fall-associated dark-warm colors more during fall than other seasons. Furthermore, many studies have proved that environmental landscapes and colors change greatly with seasons, accordingly, affecting people’s perceptions and preferences (Yan et al. Citation2022; Yang Citation2020). As a result, seasonal differences in city color preferences deserve careful consideration.
Therefore, our study aimed to investigate the city color preferences of residents across different seasons, encompassing preferences for hue, lightness, and chroma. Moreover, considering significant age and sex differences in city color preferences, we also recorded the sex and age of participants to explore further seasonal variations in city color preferences among residents of different sex and age. Specifically, we sought to answer two research questions: (1) Are there seasonal differences in hue, lightness, and chroma preferences in city colors? (2) which sex and/or age groups of residents exhibit significant seasonal differences in city color preference? This study seeks to examine the seasonal dynamics of city color preferences and identify groups with notable seasonal differences in city color preference, thereby providing recommendations for city color planning. The remainder of the article is structured as follows: Section 2 presents the materials and methods, Section 3 details the results, Section 4 discusses the findings, and Section 5 concludes the paper.
2. Materials and methods
2.1. Stimulus
Experimental methods for color preference research generally encompass four types: N-alternative forced choice, rank-order, rating, and paired comparison. Among these, the N-alternative forced choice method is deemed more suitable for experiments with large samples (Luwen et al. Citation2023). However, existing color cards, such as the NCS INDEX 1950 ORIGINAL, feature an excessive number of colors, posing challenges in the selection process. To facilitate the investigation in this study, a color chart with fewer colors was employed as a stimulus. Furthermore, given that the Munsell color system is the most widely used, including in South Korea, and that Munsell notation aligns with hue, brightness, and chroma (Pastilha et al. Citation2019), it was chosen for scientific statistical analysis. The Munsell color notation, represented as HV/C (e.g., 5 R 8/4 indicating hue 5 R, value 8, and chroma 4), provides a comprehensive description of color attributes. Therefore, Munsell hues were divided into 40 categories at 2.5 intervals, such as 2.5 R, 5 R, 7.5 R, and 10 R for the preliminary survey, ensuring an equal number of color samples for each hue. From the results of the pre-survey, it was observed that colors in the purple series (P and RP hue) were seldom chosen. This observation aligns with the fewer colors in the purple series in the NCS color system, which is based on visual perception (Pastilha et al. Citation2019). This study, rooted in human visual perception, decided to reduce purple series in the formal color chart. Moreover, the quantitative proportions of each hue in the color chart for the formal survey were determined based on the interrelations between the NCS and Munsell System of F.W. Billmeyer (Billmeyer and Bencuya Citation1987) and the color distribution of NCS 1950. In addition, considering the pre-survey results, the lightness range of the color samples was finalized at 3–9 and the chroma range was set at 0–14. The resulting stimulus comprised a “color chart” with 233 colored samples, including 6 achromatic colors and 227 chromatic colors, as outlined in .
Table 1. The composition of the color samples.
2.2. Procedure
Before conducting the formal survey, a preliminary survey was undertaken in May 2021, resulting in a collection of 60 valid samples that were subsequently excluded from the formal survey. Busan Metropolitan City, South Korea, experiences a temperate maritime climate with four distinct seasons. Spring spans from March to May, with an average temperature of 13.3°C; summer extends from June to August, with an average temperature of 23.6°C; autumn prevails from September to November, with an average temperature of 17.2°C; and winter lasts from December to February, with an average temperature of 4.7°C. To explore the seasonal differences in city color preferences, we collected the data through the formal questionnaire survey in Busan Metropolitan City from June to August 2021 (summer) and January to February 2022 (winter). The formal survey adopts random sampling survey. Considering that the spectral character of an illuminant significantly influences the appearance of a colored object in terms of hue and relative brightness (Luckiesh Citation1916), the survey days were deliberately chosen to be sunny, and the survey took place between 10 am and 5 pm to ensure sufficient light. Given that architectural façade colors constitute a significant portion of city colors, as indicated by the pre-survey resident interviews, this study replaced city colors with the facade colors of buildings. Consequently, the survey question related to city color was framed as follows: “If a new building were being constructed near your home, what color would you prefer as the main color (constituting more than 70% of the total color area) for its facade?” Additionally, basic information such as the participants’ sex and age were collected during the survey.
2.3. Participants
The questionnaire was anonymous, and verbal educated consent was obtained from the participants. Of the total of 700 (665 valid) questionnaires, 310 was valid in summer and 355 valid in winter. Overall, the composition of participants in summer and winter was similar, as shown in . The samples consisted of 152 (49%) men and 158 (51%) women in summer and 186 (52%) men and 169 (48%) in winter. Regarding the age group, 85 (28%) respondents in summer and 83 (23%) in winter were younger than 25 years old, 87 (28%) in summer and 129 (36%) in winter were between 25 and 40 years old, 57 (18%) in summer and 86 (24%) in winter were between 40 to 60 years old, and 81 (26%) in summer and 57 (16%) in winter were older than 60 years provide the composition of participants.
Table 2. The composition of participants.
2.4. Statistics
shows the flow chart of statistics, illustrating the utilization of both descriptive and inferential statistics in the scientific analysis of data. Descriptive statistics serve to summarize a set of observations, conveying a maximal amount of information as succinctly as possible (Bland Citation2015). In this study, descriptive statistical analysis was mainly performed using frequency measures through cross-tabulation. Cross-tabulation analysis, also known as contingency table analysis, is commonly used for analyzing categorical (nominal measurement scale) data (Dickinson Citation2020).
Figure 1. Flow chart of statistics.
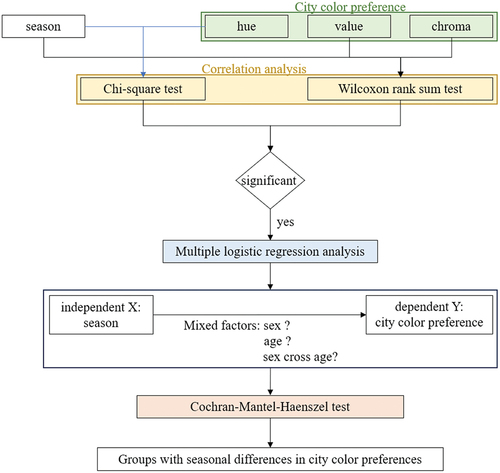
Following the descriptive statistical analysis, the chi-square test was employed to investigate the correlation between season and hue preference. The chi-square is a robust statistic that enables researchers to test hypotheses about variables measured at the nominal level (McHugh Citation2013). It conducts correlation analysis by comparing observed frequencies in cells with those expected under the assumption of no correlation between the two nominal variables (Dulan and Cho Citation2020). As expect frequencies are based on the absence of an association, a greater association between the two nominal variables results in a larger difference between observed and expected frequencies. The chi-square test for association provides evidence against the null hypothesis by calculating a significance value (p-value). If the p-value is sufficiently small, it can be concluded that there is significant evidence against the null hypothesis of independence, suggesting an association between the two variables (Dulan and Cho Citation2020). Additionally, considering that value and chroma are ordinal variables, the Wilcoxon rank sum test was employed to investigate the correlation between season and value or chroma preference. The Wilcoxon rank sum test, also known as the Mann-Whitney U test, is the nonparametric alternative to the 2-sample t test. Because ordinal data can be ranked, a statistical test based on ranks, the Wilcoxon rank sum test, is a natural choice for generating a p value to test for a difference between two sets of ordinal values (Divine George et al. Citation2013).
After the correlation analysis, variables that passed the significance test were chosen for multiple logistic regression analysis to delve deeper into the impact of season on city color preference. Multiple logistic regression is employed when dependent variables have more than two values and are not continuous (H. Li et al. Citation2016). It relies on data sampling to ascertain the role and intensity of explanatory variable Xn in determining the probability of the occurrence of the predicted categorical dependent variable Y (Aiping et al. Citation2022). Furthermore, to explore whether sex and age have an impact on seasonal differences in city color preferences, addressing the second research question, this paper introduced the CMH test. The CMH test is a statistical tool for examining the association between two categorical variables while controlling for the effects of a third variable. By calculating a test statistic that follows a chi-squared distribution, the CMH test determines whether the association between the variables of interest is statistically significant after accounting for the stratifying variable (de la Rubia and Adrián Valle de la Citation2023). All the statistical analyses mentioned above were conducted using IBM SPSS Statistics version 26.
3. Results
3.1. Seasonal variations in city color preference including hue, value, and chroma preference
is the crosstabulation of season and hue. Because the season has two variables and the hue has 11 variables, it is a 2 × 11 crosstabulation. It can be seen from that the most preferred hue for residents in summer was Y (21.3%), followed by N (15.2). However, the least favorite hues among residents were P (2.3%), RP (2.9%), and G (2.9%). In winter, residents were more willing to choose GY (19.4%) and N (19.2%) instead of P (1.7%), RP (2.8%) and G (2.8%). In general, hue preferences of residents for R, GY, BG, PB, and N increase and their preferences for YR, Y, G, B, P, and RP decrease in winter than in summer.
Table 3. Season * hue cross tabulation.
is the chi-square tests with the test value is 21.561. Compare this value with a chi-square distribution with 10 degrees of freedom (i.e., the “df” column) to test for statistical significance, i.e., asymptotic significance (2-sided). In the test, p = 0.018 < 0.0.5, which means there were statistically significant differences in hue preferences (X2 = 20.637) between summer and winter at 95% confidence. In other words, there was a significant correlation between season and hue preference of city color.
Table 4. Results of chi-square test.
shows a histogram comparing the frequency distributions of city color value and chroma preferences in summer and winter. Overall, the trends in value preference or chroma preference were similar in summer and winter. Specifically, for the selection frequency of low brightness, i.e., value 3 was the lowest, accounting for only in summer and 2.54% in winter; it gradually increased, reaching its peak at value 9, accounting for 33.55% and 29.30% in summer and winter, respectively. Regarding the chroma preference, residents’ favorite chroma value was 0 both in summer and winter, that is, neutral color, accounting for 15.16% and 19.15%, respectively. For colored colors, as the chroma value increased, the residents’ preference gradually increased, and at chroma value 8, it reached a peak, accounting for 14.19% in summer and 15.49% in winter and then gradually declined. In addition, in terms of seasonal change in value preference, although summer and winter had similar preference trends, summer preferred high values of lightness 8 and 9 over winter, while winter preferred medium values of lightness 6 and 7 more than summer. In addition, residents were more willing to choose neutral colors with a chroma of 0 and medium-high chroma with a chroma higher than 6 in winter than in summer and preferred low chroma with a chroma of less than 6 in summer than in winter.
Figure 2. Seasonal changes in value and chroma preference of city color.
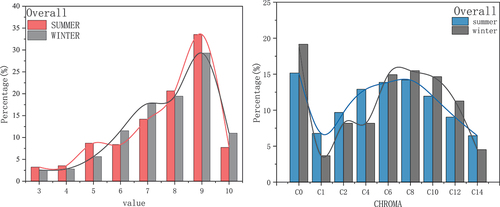
presents the results of Wilcoxon rank sum test of value and chroma preference. From , asymptotic significance value of value preference and chroma preference is 0.768 and 0.604, respectively, both values are greater than 0.05. It means that regardless of value preference or chroma preference, their seasonal differences are statistically insignificant. In other words, there is no significant correlation between season and value preference or chroma preference of city color. However, combined with , residents preferred city colors with higher brightness and lower chroma in summer than in winter.
Table 5. Results of wilcoxon rank sum test of value and chroma preference.
3.2. The impact of season on city color preference
Based on the above, a significant correlation exists between season and city color hue preference, but not with value or chroma. Therefore, this section uses multiple logistic regression for further analysis. Because hue is not an ordinal variable, multinomial logistic regression analysis rather than ordinal logistic regression was chosen to investigate the impact of the season (independent variable) on the city color hue preference (dependent variable). Considering that the most preferred hues of residents in summer and winter are Y and GY, respectively, Y and GY hues were selected as reference categories for logistic regression analysis.
In the results of parameter estimates, B represents the regression coefficients and p value refers to the significance of regression analysis. A positive regression coefficient indicates that the occurrence ratio will increase correspondingly when the explanatory variable increases. On the contrary, when the regression coefficient is negative, it means that the occurrence ratio will decrease correspondingly when the explanatory variable increases (Aiping et al. Citation2022). p values are obtained by wale test. When p value is less than 0.05, there is a significant correlation between dependent variables and independent variables. Exp(B) equals to odds ratio (OR). In general, the probabilities of dependent variables increase along with OR values (H. Li et al. Citation2016). From , when the reference category is Y, hues with p-values less than 0.05 include R, GY, BG, PB, and N. Moreover, their corresponding regression coefficients are all negative, which means that compared to Y, residents prefer R, GY, BG, PB, and N in winter than in summer. From , the p values corresponding to Y and YR are less than 0.05, and the regression coefficients are both positive, indicating that compared to GY, residents are more likely to choose Y and YR in summer than in winter. In particular, the OR value corresponding to Y is 3.239, which means that residents’ preference for Y is 3.239 times greater than GY in summer than in winter.
Table 6. Results of parameter estimates (The reference category: Y).
Table 7. Results of parameter estimates (The reference category: GY).
3.3. Seasonal variations in city color preferences of different sexes and ages
To explore whether sex and age have an impact on seasonal differences in city color hue preferences, sex and age were used as the stratifying variables in turn, and the CMH test was used. From , in summer, men’s favorite hue was Y, accounting for 25.7%, followed by N, GY, and YR. In winter, men were more willing to choose N, accounting for 22.6%, followed by GY, PB, and Y. In terms of women, they were preferred PB in summer, accounting for 18.4%, and GY in winter, accounting for 20.1%. Regarding the seasonal differences of different sexes, men’s preference for GY, BG, PB, and N increased in winter compared to summer, and their preference for Y and YR decreased. Differently, seasonal differences in women’s hue preferences appear to be relatively small. In general, women’s preference for GY and N increased in winter compared to summer, and their preference for Y, PB, and B decreased.
Table 8. Season * hue * sex cross tabulation.
presents the results of CMH test of different sexes. The chi-square values for males and females are 23.866 and 6.939, respectively, and the asymptotic significance is 0.008 and 0.731, respectively. 0.008 is less than 0.05 and 0.731 is greater than 0.05, indicating that the seasonal difference in men’s hue preference of city color is statistically significant within the 95% confidence interval, that is, the season affects men’s hue preference but not women’s. In other words, women’s hue preferences show greater stability across seasons than men’s.
Table 9. Results of CMH test.
From , residents younger than 25 years old preferred Y in summer, accounting for 22.4%, and N in winter, accounting for 20%. Residents aged 25 to 40 preferred N in both summer and winter, followed by Y and GY, respectively. Residents over 40 years old were more likely to choose Y in summer and GY in winter. Seasonal differences in hue preference appeared to be the least for those younger than 25 years of age. In winter compared to summer, their preference for N, B, R, and YR slightly increased, while for PB and YR decreased. In contrast, the seasonal differences in hue preferences show to be most obvious among those over 60 years of age. In winter, their preference for warm colors such as R, YR, and Y was obviously less than that in summer, whereas their preference for GY was greatly increased. In winter, the 25- to 40-year-old group had more preferences for red and green series, such as R, YR, GY, G, and BG, than summer, while their preference for yellow and blue series, such as Y, B, and PB, decreased. Differently, the 40- to 60-year-old group had an increased preference for blue series, such as BG, B, and PB, in winter than in summer.
Table 10. Season * hue * age cross tabulation.
The chi-square test requires that the value of the cell expected should be 5 or more in at least 80% of the cells, and no cell should have an expected value of less than one. This assumption is most likely to be met if the sample size equals at least the number of cells multiplied by 5 [46]. In other words, if the sample size is too small, the chi-square test is not very applicable and may cause errors. In this case, Fisher’s exact test that is more accurate than the chi-square test needs to be used. Thus, in the subsequent chi-square test, Fisher’s exact test was used for variables with small samples, while the chi-square test was still used for at least 80% of the cells that have an expected value greater than 5. According to , the p values of seasonal differences in hue preference in different age groups from low to high are 0.770 (exact significance), 0.075 (asymptotic significance), 0.114 (exact significance), and 0.059 (exact significance), respectively. All p values are greater than 0.05, indicating that the seasonal differences in hue preference of residents of any age group are not statistically significant within the 95% confidence. However, for residents aged 25 to 40 and over 60 years old, the p value is greater than 0.05 and less than 0.1, which can say that the seasonal difference in their hue preference is significant at the 90% confidence level.
Table 11. Results of CMH test.
3.4. Seasonal variations in city color preference of different ages under different sexes
Overall, sex factor has a more significant impact than age on seasonal differences in hue preference of city color. Moreover, the seasonal differences in hue preference are more significant in men than in women and in the elderly than in young and middle-aged people. To further explore the specific groups with seasonal differences in city color hue preferences, sex and age were then crossed to analyze the seasonal differences among age groups under different sexes. That is, sex and age were simultaneously used as the stratifying variables for CMH testing. shows the cross tabulation of the frequency of hue preference across seasons for different age groups under different sexes. For men, residents under 25 years old preferred N most both in summer and winter, accounting for 26.3% and 32.7%, respectively, followed by Y, accounting for 23.7% and 16.3%, respectively. However, their preference for N increased in winter than in summer, and their preference for Y decreased. Men aged 25 to 40 were more willing to choose N and Y in summer and N and PB in winter. Moreover, their preference for Y is greatly reduced in winter than in summer, while their preference for PB and G increased. Men over 40 years old were more likely to choose Y in summer and GY in winter. At the same time, their preference for Y is significantly reduced in winter than in summer, while their preference for GY is greatly increased. Regarding women, those younger than 40 years old preferred PB most in summer, accounting for 27.7%, and N most in winter, accounting for 20.6%. Moreover, their preference for Y decreased and for N increased more in winter than in summer. The seasonal difference in hue preference appears to be smallest among women aged 40 to 60, who liked GY most in both summer and winter, accounting for 23.5% and 28.6%, respectively. In addition, their preference for PB increased and for Y decreased in winter compared with summer. For older women over 60 years old, they were more willing to choose B in summer, followed by YR and GY, and preferred PB in winter, followed by Y and GY. In other words, they preferred blue and yellow series of city colors in both summer and winter.
Table 12. Season * hue * age * sex cross tabulation.
To test whether the above differences are statistically significant, chi-square test and Fisher’s exact test were performed. It can be clearly seen from that the p value for women of any age group is greater than 0.05, which indicates that the seasonal differences in hue preference for women of any age group are not statistically significant. To put it from another way, the city color hue preferences of women of any age group tend to be stable across seasons. On the contrary, the p values of Pearson chi-square test and Fisher’s exact test for men over 40 years old and Pearson chi-square test for men aged 25 to 40 years old are all less than 0.05, indicating that the seasonal differences in hue preference among men over 25 years old are statistically significant. Consequently, seasonal effects on city color hue preferences mainly affect middle-aged and older men, rather than young men and women of all ages.
Table 13. Results of CMH test.
4. Discussion
4.1. Dynamic changes in city color preference
Schloss (Schloss and Palmer Citation2017) confirmed that color preferences can systematically change based on the degree to which different kinds of color-associated objects are activated in observers’ minds at different times. Similarly, this study identified dynamic changes in city color preferences across seasons. Overall, there are significant seasonal differences in city color preferences, mainly in hue differences, while the differences in brightness and chroma preferences are not statistically significant. Regardless of summer or winter, residents preferred city colors with high brightness and medium chroma. Fan, Yocom, and Guo (Rong, Yocom, and Guo Citation2023) also discovered that greenway segments with high values of the visual attraction element exhibit high color brightness.
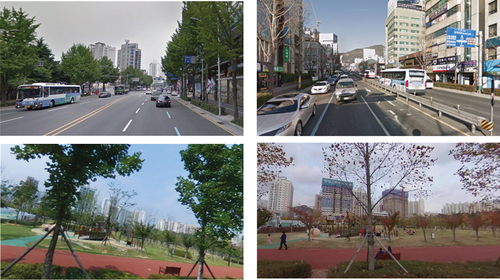
Regarding dynamic changes in hue preference, residents exhibited a preference for Y and N in summer, while in winter they were more inclined to choose GY and N. Notably, the preference for Y decreased, and instead, the preference for GY increased. The shift from Y to GY indicates residents’ preference for green in winter. To explain why people are more likely to choose green city colors in winter, various factors were considered. First, green is commonly associated with safety and stability (Edwards-Wright Citation2011; Gi-Yeon and Lee Citation2011). In addition, green spaces, being significant sources of green vision in urban environments, serve as restorative settings and places for physical activity, mitigating the negative psycho-physiological effects of densely built environments (Arnberger and Eder Citation2015). Numerous studies suggest that residents living in areas that lack green space may be more vulnerable to the negative impacts of stressful life events because they have less opportunities for nature-based coping strategies than residents living in areas with abundant green space (Kaplan, Kaplan, and Brown Citation1989; Kondo et al. Citation2018; Van den Berg et al. Citation2010). According to the Ecological Valence Theory (EVT), color preference is derived from people’s average affective responses to color-associated objects (weighted affective valence estimate – WAVE). This implies that people prefer colors strongly associated with objects they like and dislike colors strongly associated with objects they dislike (Palmer and Schloss Citation2010). With the accelerated urbanization process, the preference for green vision is undoubtedly evident. However, Busan Metropolitan City experiences distinct seasons, and in winter, deciduous plants and green spaces lose their green color, appearing gray and brown, as illustrated in . Consequently, residents’ preference for green city colors in winter finds a plausible explanation.
Figure 3. Environment vision in summer (left) and winter (right) of Busan city.
4.2. Groups with seasonal differences in city color preference
This study discovered that seasonal differences in city color hue preferences are predominantly associated with sex rather than age. Specifically, men’s city color preferences exhibited significant variations across seasons, while those of women remained more stable. Accordingly, efforts are made to elucidate the seasonal disparities in city color preferences across sexes, drawing on two interconnected theories proposed in previous literature predicting sex differences in color preference. One theory is the social structural theory, positing that differences in color preference may reflect attempts to enhance sex role equality in society. According to this theory, men might prefer stimulating colors to enhance sociability, while women might lean towards energetic and vibrant colors to boost aggression-hostility (Wei et al. Citation2011). In the context of South Korea’s historical context, women were traditionally assigned household responsibilities due to perceived physical and moral unsuitability for wage labor. Although more women now participate in paid employment, they continue to shoulder the majority of unpaid work (Noh et al. Citation2017). This demonstrates that women still carry the bulk of housekeeping work, and excessive unpaid labor decreases recreational time and increases pressure. According to the hypothesis, Smock (Smock Citation1955) proposed and confirmed that psychological stress will lead to the adherence to the recognition “hypothesis” and consequently a retarded recognition of stimuli that deviate from the expected or familiar. Consequently, we propose that higher stress levels may weaken women’s perceptions of urban environments, resulting in a more stable trend in women’s preference for city colors across different seasons.
The other theory is the hunter-gatherer theory, suggesting that in early hunter-gatherer societies, men primarily undertook hunting tasks, while women focused on gathering-related tasks (Groyecka et al. Citation2019). Thus, men would prefer calming colors such as blue and green to promote patience, while women would prefer food-related colors such as pink and purple (Wei et al. Citation2011; Yujing et al. Citation2019). Additionally, as gatherers, women would have a heightened awareness of color information, leading to greater certainty and stability in their color preferences (Hurlbert and Ling Citation2007; Noh et al. Citation2017). This perspective aligns with our study’s findings, indicating that city color preference dynamics are more stable in women than in men.
Furthermore, this study highlighted that the shift in city color preference from yellow to green, observed from summer to winter, is predominantly evident among middle-aged and elderly male groups. A study on the relationship between the number of family members and stress by gender in South Korea (Noh et al. Citation2017) revealed that as Korean individuals age, they appear to be at a lower risk of stress. Essentially, middle-aged and elderly Korean men experience less stress than their younger counterparts, affording them more time and a better mood to perceive the urban environment. This increased perceptual acuity makes it easier for them to capture visual differences across different seasons. Moreover, Dittmar (Dittmar Citation2001) suggested the possibility that the heightened preference for green with age might be attributed to older adults spending more time on gardening. Additionally, in a study exploring visual perception, Ma, Luo, and Furuya (Ma, Luo, and Furuya Citation2023) confirmed that men moved their eyes more and observed a wider area, as well as gazed longer at trees than women did. The results of this article are consistent with these notions, that is middle-aged and older men are more likely to perceive changes in overall landscape color in urban environments.
4.3. Proposals for city color planning
Our findings may have implications for the design, planning, and management of city landscape color. First, recognizing that city color preferences are dynamic rather than static, it is imperative to understand the evolving patterns when formulating city color planning. Specifically, when carrying out city color planning, it is necessary to conduct a survey on the color preferences of residents. However, the survey should not be confined to a single season. Instead, it should be conducted across different seasons and the results should be considered holistically. Second, given that green vision is favored by residents in both summer and winter, and there are more preferences in winter than in summer, incorporating a mix of evergreen and deciduous trees is recommended to maintain appealing green vista, especially during winter. Additionally, some green building decoration or flexible urban furniture can be added. Third, considering the significant seasonal differences in city color preferences among middle-aged and elderly men, their dynamic preferences should be focused on when formulating city color planning. Lastly, acknowledging that different demographic groups exhibit varied color preferences, it is essential to consider users’ specific preferences when making color planning and design, thereby ensuring that the built environment aligns with their needs and desires, ultimately contributing to their overall satisfaction and well-being.
4.4. Limitation and prospects
The study acknowledges certain limitations that warrant consideration in the interpretation of its findings. First, the surveys were conducted on different days and times, and while the weather conditions were consistently sunny, variations in light conditions may have occurred. Second, due to the study’s scale, the sample size is relatively small, and a more adequate sample could yield more precise results. Third, the current study specifically compares dynamic changes in city color preferences between summer and winter; future research endeavors could extend this analysis to include data from spring and autumn, capturing dynamic patterns across all seasons. Additionally, while the study explores age and sex groups and demonstrates the impact of these demographic factors on seasonal differences in city color preference, future research could broaden the scope to consider other factors such as occupation and education level. Furthermore, the limitation of this study is also reflected in the fact that it primarily focuses on the human perspective, neglecting objective variables such as shape and height of buildings, the width of streets, and the historicity of constructions. Future research aims to adopt a multi-dimensional approach, considering these variables in conjunction with residents’ color preferences, thereby providing a more comprehensive contribution to city color planning.
5. Conclusion
The study employs various statistical analyses, including the chi-square test, Wilcoxon rank sum test, and logistic regression model, to examine the influence of seasons on city color preference, including hue, value, and chroma preferences. Furthermore, sex and age factors are introduced, with the CMH test employed to explore groups with seasonal differences in city color preferences. The key findings are summarized as follows.
First, there are significant seasonal differences in city color preferences, mainly in hue differences, while the differences in brightness and chroma preferences are not statistically significant. Although residents consistently exhibit a preference for city colors with high brightness and medium chroma, they prefer higher brightness and lower chroma city colors in summer than in winter. Second, the primary effect of season on city color hue preference is that residents prefer Y and YR in summer than winter and GY and BG in winter over summer. Third, sex emerges as a more influential factor than age in seasonal differences in city color preferences. Notably, men’s city color preferences exhibited significant variations across seasons, while those of women remained more stable. More specifically, the group with significant seasonal differences consists predominantly of middle-aged and older men. The study’s insights into the dynamic changes in city color preferences can serve as valuable references for city color planning. Additionally, the specific color preferences identified within different demographic groups can find application in urban regeneration projects, particularly those focused on creating age-friendly renovation of the built environment, thereby contributing to human well-being.
Acknowledgements
We would like to express our gratitude to the College of Architecture and Urban Planning, Tongji University, and the Department of Architecture, Pusan National University, for their financial and administrative support. We also thank the anonymous reviewers and academic editors for their comments.
Disclosure statement
No potential conflict of interest was reported by the author(s).
Data availability statement
The data that support the findings of this study are available from the corresponding author, upon reasonable request.
Additional information
Funding
Notes on contributors
Yajun Wen
Yajun Wen is currently a postdoctoral researcher under the supervision of Prof. Yifan Yu in the College of Architecture and Urban Planning at Tongji University, China. She received her Ph.D. (2023.08) from Pusan National University, South Korea. Her research interests focus on city landscape color and color perception.
Jaehoon Chung
Jaehoon Chung is currently a Professor in the Department of Architecture at Pusan National University, South Korea. Ph.D. in Urban Planning/BS in Architecture, Seoul National University, South Korea. Dipl.-Ing. in Architecture at TU Darmstadt, Germany. He received a Ph.D. in a thesis on landscape colors and has been continuing research related to the landscape of Korea.
Yuka Himeno
Yuka Himeno is currently an Associate Professor at Oita University, Japan, with a Ph.D. in Urban Planning, BS, MS in Architecture from Oita University, Japan. After receiving a Ph.D. with the research on interpreting and evaluating the scenery of the Japanese hot spring area by multivariate analysis, she continues to study the Japanese endemic landscape characteristics.
Yifan Yu
Yifan Yu is currently a Professor in the College of Architecture and Urban Planning at Tongji University, China. She received her Ph.D. (2003) from School for Advanced Studies in the Social Sciences (EHESS), France. Her research interests focus on urban design and urban regeneration.
References
- Aiping, G., S. Binli, W. Jiangbo, and W. Hongwei. 2022. “Color Preference and Contributing Factors of Urban Architecture Based on the Selection of Color Samples—Case Study: Shanghai.” Color Research & Application 2021 (2): 1–21. https://doi.org/10.1002/col.22731.
- Arik, B., T. Sato, G. Sarikaya, and Y. Ikiz. 2016. “Seasonal and Emotional Associations of the Colours and Their Effects on Directing the Turkish Fashion.” Color Research & Application 41 (5): 523–529. https://doi.org/10.1002/col.21985.
- Arnberger, A., and R. Eder. 2015. “Are Urban visitors’ General Preferences for Green-Spaces Similar to Their Preferences When Seeking Stress Relief?” Urban Forestry & Urban Greening 14 (4): 872–882. https://doi.org/10.1016/j.ufug.2015.07.005.
- Bakker, I., T. van der Voordt, P. Vink, J. de Boon, and C. Bazley. 2015. “Color Preferences for Different Topics in Connection to Personal Characteristics.” Color Research & Application 40 (1): 62–71. https://doi.org/10.1002/col.21845.
- Beke, L., G. Kutas, Y. Kwak, G. Y. Sung, D.-S. Park, and P. Bodrogi. 2008. “Color Preference of Aged Observers Compared to Young Observers.” Color Research & Application 33 (5): 381–394. https://doi.org/10.1002/col.20434.
- Billmeyer, F. W., and A. K. Bencuya. 1987. “Interrelation of the Natural Color System and the Munsell Color Order System.” Color Research and Application 12 (5): 243–255. https://doi.org/10.1002/col.5080120505.
- Bland, M. 2015. An Introduction to Medical Statistics. 4th ed. Oxford: Oxford University Press.
- Bonnardel, V., S. Beniwal, N. Dubey, M. Pande, and D. Bimler. 2018. “Gender Difference in Color Preference Across Cultures: An Archetypal Pattern Modulated by a Female Cultural Stereotype.” Color Research & Application 43 (2): 209–223. https://doi.org/10.1002/col.22188.
- Chen, N., X. Xu, M. Tan, and X. Wang. 2022. “A Spatial Analysis of Urban Color Harmony in Five Global Metropolises.” Journal of Resources and Ecology 13 (2): 238–246. https://doi.org/10.5814/j.issn.1674-764x.2022.02.007.
- Correy, A. 1982. Visual Perception and Scenic Assessment in Australia. XX World Congress IFLA+ AILA. https://scholar.google.com.hk/scholar?hl=zh-CN&as_sdt=0%2C5&q=Visual+Perception+and+Scenic+Assessment+in+Australia&btnG=.
- de la Rubia, J. M., and O. Adrián Valle de la. 2023. “Everything You Wanted to Know but Could Never Find from the Cochran-Mantel-Haenszel Test.” Journal of Data Analysis and Information Processing 11 (3): 310–339. https://doi.org/10.4236/jdaip.2023.113016.
- Dickinson, J. R. 2020. “MTABS Analyses of Chi-Square Cross-Tabulations at ABSEL.” Developments in Business Simulation and Experiential Learning: Proceedings of the Annual ABSEL conference, 47. https://scholar.google.com.hk/scholar?hl=zh-CN&as_sdt=0%2C5&q=+MTABS+Analyses+of+Chi-square+Cross-tabulations+at+ABSEL.+In+Developments+in+Business+Simulation+and+Experiential+Learning&btnG=.
- Dittmar, M. 2001. “Changing Colour Preferences with Ageing: A Comparative Study on Younger and Older Native Germans Aged 19-90 Years.” Gerontology 47 (4): 219–226. https://doi.org/10.1159/000052802.
- Divine George, H. J. N., H. J. Norton, R. Hunt, and J. Dienemann. 2013. “A Review of Analysis and Sample Size Calculation Considerations for Wilcoxon Tests.” Anesthesia & Analgesia 117 (3): 699–710. https://doi.org/10.1213/ANE.0b013e31827f53d7.
- Dulan, S., and N. Cho. 2020. “The Analysis of Association Between Learning Styles and a Model of IoT-Based Education: Chi-Square Test for Association.” Journal of Information Technology Applications and Management 27:19–36. https://doi.org/10.21219/jitam.2020.27.3.019.
- Edwards-Wright, T. 2011. “Your Favorite Color Has a Meaning.“ Lulu com 11. Lulu Enterprises.
- Elliot, A. J., and D. Niesta. 2008. “Romantic Red: Red Enhances Men’s Attraction to Women.” Journal of Personality and Social Psychology 95 (5): 1150–1164. https://doi.org/10.1037/0022-3514.95.5.1150.
- Ellis, L., and C. Ficek. 2001. “Color Preference According to Gender and Sexual Orientation.” Personality and Individual Differences 31 (8): 1375–1379. https://doi.org/10.1016/S0191-8869(00)00231-2.
- Eysenck, H. J. 1941. “A Critical and Experimental Study of Colour Preferences.” The American Journal of Psychology 54 (3): 385–394. https://doi.org/10.2307/1417683.
- George, M. W. 1938. “Color Preferences of College Students with Reference to Chromatic Pull, Learning, and Association.” The American Journal of Psychology 51 (4): 714. https://doi.org/10.2307/1415705.
- Gi-Yeon, J., and K.-H. Lee. 2011. “Color Preference and Color Meaning of University Students.” Fashion & Textile Research Journal 13 (3): 346–352. https://doi.org/10.5805/KSCI.2011.13.3.346.
- Gong, S.-M., and W.-Y. Lee. 2017. “Colour Preference Model for Elder and Younger Groups.” Journal of the International Colour Association 18:33–42. http://www.aic-colour.org/journal.htm.
- Groyecka, A., C. Witzel, M. Butovskaya, and P. Sorokowski. 2019. “Similarities in Color Preferences Between Women and Men: The Case of Hadza, the Hunter-Gatherers from Tanzania.” Perception 48 (5): 428–436. https://doi.org/10.1177/0301006619840937.
- Hirata, N., Y. Okamura, and S. Kawahara. 2013. “A Study on Place Branding Using Color Guidelines in Landscape Planning: Focusing on Expressions Which Specify Recommended Symbolic Colors.” Journal of Architecture and Planning (Transactions of AIJ) 78 (685): 663–671. https://doi.org/10.3130/aija.78.663.
- Hurlbert, A. C., and Y. Ling. 2007. “Biological Components of Sex Differences in Color Preference.” Current Biology 17 (16): R623–R625. https://doi.org/10.1016/j.cub.2007.06.022.
- Hu, K., Z. Xu, X. Wang, Y. Wang, H. Li, and Y. Zhang. 2023. “Research on Street Color Environment Perception Based on CEP-KASS Framework.” Buildings 13 (10): 2649. https://doi.org/10.3390/buildings13102649.
- Jaglarz, A. 2023. “Perception of Color in Architecture and Urban Space.” Buildings 13 (8): 2000. https://doi.org/10.3390/buildings13082000.
- Jang, Y.-S. 2014. “Urban Landscape Color Planning.” The Journal of the Korea Contents Association 12 (4): 51–54.
- Kaplan, R., S. Kaplan, and T. Brown. 1989. “Environmental Preference: A Comparison of Four Domains of Predictors.” Environment and Behavior 21 (5): 509–530. https://doi.org/10.1177/0013916589215001.
- Kazuhiko, Y., B. Schloss Karen, A. Michiko, and E. Palmer Stephen. 2015. “Ecological Effects in Cross-Cultural Differences Between U.S. and Japanese Color Preferences.” Cognitive Science 40 (7): 1590–1616. https://doi.org/10.1111/cogs.12291.
- Ken, S., and T. Yasuro. 2001. “Spectral Luminous Efficiency As a Function of Age.” Journal of the Optical Society of America A 18 (11): 2659–2667. https://doi.org/10.1364/JOSAA.18.002659.
- Ke-Run, L., Y.-Q. Yang, and Z.-Q. Zheng. 2020. “Research on Color Harmony of Building façades.” Color Research & Application 45 (1): 105–119. https://doi.org/10.1002/col.22448.
- Kondo, M. C., J. M. Fluehr, T. McKeon, and C. C. Branas. 2018. “Urban Green Space and Its Impact on Human Health.” International Journal of Environmental Research and Public Health 15 (3): 445. https://doi.org/10.3390/ijerph15030445.
- Li, H., C. Wu, D. Chu, M. Zhong, and Y. Li. 2016. “Drivers’ Hazard Perception Analysis Based on Logistic Regression and Cochran–Mantel–Haenszel Test.” Advances in Mechanical Engineering 8 (9): 1687814016670059. https://doi.org/10.1177/1687814016670059.
- Li, M., J. Xu, and X. Zhang. 2017. “Spatial-Sensitivity Analysis for Urban Color Planning: Study of Luoyang City, China.” Journal of Urban Planning and Development 143 (1): 05016014. https://doi.org/10.1061/(ASCE)UP.1943-5444.0000345.
- Luckiesh, M. 1916. “A Note on Color Preference.” The American Journal of Psychology 27 (2): 251–255. https://doi.org/10.2307/1413177.
- Luwen, Y., C. Yun, G. Xia, S. Westland, Z. Li, and V. Cheung. 2023. “Analysis of Research Strategies to Determine Individual Color Preference: N‐Alternative Forced Choice, Rank‐Order, Rating and Paired Comparison.” Color Research & Application 48 (2): 222–229. https://doi.org/10.1002/col.22836.
- Ma, R., Y. Luo, and K. Furuya. 2023. “Gender Differences and Optimizing Women’s Experiences: An Exploratory Study of Visual Behavior While Viewing Urban Park Landscapes in Tokyo, Japan.” Sustainability 15 (5): 3957. https://doi.org/10.3390/su15053957.
- McHugh, M. L. 2013. “The Chi-Square Test of Independence.” Biochemia Medica 23 (2): 143–149. https://doi.org/10.11613/BM.2013.018.
- Noh, J.-W., K.-B. Kim, J. Park, J. Hong, and Y. D. Kwon. 2017. “Relationship Between the Number of Family Members and Stress by Gender: Cross-Sectional Analysis of the Fifth Korea National Health and Nutrition Examination Survey.” PLOS ONE 12 (9): e0184235. https://doi.org/10.1371/journal.pone.0184235.
- Ou, L. C., M. Ronnier Luo, A. Woodcock, and A. Wright. 2004. “A Study of Colour Emotion and Colour Preference. Part II: Colour Emotions for Two-Colour Combinations.” Color Research & Application 29 (4): 292–298. https://doi.org/10.1002/col.20024.
- Palmer, S. E., and K. B. Schloss. 2010. “An Ecological Valence Theory of Human Color Preference.” Proceedings of the National Academy of Sciences 107 (19): 8877–8882. https://doi.org/10.1073/pnas.0906172107.
- Pastilha, R. C., J. M. M. Linhares, A. I. C. Rodrigues, and S. M. C. Nascimento. 2019. “Describing Natural Colors with Munsell and NCS Color Systems.” Color Research and Application 44 (3): 411–418. https://doi.org/10.1002/col.22355.
- Rong, F., K. P. Yocom, and Y. Guo. 2023. “Utilizing Fractal Dimensions As Indicators to Detect Elements of Visual Attraction: A Case Study of the Greenway Along Lake Taihu, China.” The Land 12 (4): 883. https://doi.org/10.3390/land12040883.
- Schloss, K. B., L. Lessard, C. Racey, and A. C. Hurlbert. 2018. “Modeling Color Preference Using Color Space Metrics.” Vision Research 151:99–116. https://doi.org/10.1016/j.visres.2017.07.001.
- Schloss, K. B., R. Nelson, L. Parker, I. A. Heck, and S. E. Palmer. 2017. “Seasonal Variations in Color Preference.” Cognitive Science 41 (6): 1589–1612. https://doi.org/10.1111/cogs.12429.
- Schloss, K. B., and S. E. Palmer. 2017. “An Ecological Framework for Temporal and Individual Differences in Color Preferences. Vision Research.” Vision Research 141:95–108. https://doi.org/10.1016/j.visres.2017.01.010.
- Serra, J., and Á. García Codoñer. 2014. “Color Composition in Postmodern Western Architecture.” Color Research & Application 39 (4): 399–412. https://doi.org/10.1002/col.21814.
- Smock, C. D. 1955. “The Influence of Stress on the Perception of Incongruity.” The Journal of Abnormal and Social Psychology 50 (3): 354. https://doi.org/10.1037/h0046181.
- Van den Berg, A. E., J. Maas, R. A. Verheij, and P. P. Groenewegen. 2010. “Green Space As a Buffer Between Stressful Life Events and Health.” Social Science & Medicine 70 (8): 1203–1210. https://doi.org/10.1016/j.socscimed.2010.01.002.
- Wei, H., Y. Zhang, J. Zhu, Y. Xu, W. Yu, W. Chen, Y. Liu. 2011. “Could Sex Difference in Color Preference and Its Personality Correlates Fit into Social Theories? Let Chinese University Students Tell You.” Personality and Individual Differences 51 (2): 154–159. https://doi.org/10.1016/j.paid.2011.03.035.
- Wen, Y., Y. Himeno, and J. Chung. 2023a. “City Color Planning Systems in East Asia in the 21st Century: A Comparative Investigation of Three Capital Cities.” Social Sciences 12 (6): 327. https://doi.org/10.3390/socsci12060327.
- Wen, Y., Y. Himeno, and J. Chung. 2023b. “Potential Conflicts Between Individual Preferences and City Color Planning: A Case Study of Busan, South Korea.” Journal of Asian Architecture and Building Engineering 22 (6): 3649–3664. https://doi.org/10.1080/13467581.2023.2172342.
- Werner John, S. 1996. “Visual Problems of the Retina During Aging: Compensation Mechanisms and Color Constancy Across the Life Span.” Progress in Retinal and Eye Research 15 (2): 621–645. https://doi.org/10.1016/1350-9462(96)00001-8.
- Wijk, H., S. Berg, L. Sivik, and B. Steen. 1999. “Colour Discrimination, Colour Naming and Colour Preferences Among Individuals with Alzheimer’s Disease.” International Journal of Geriatric Psychiatry 14 (12): 1000–1005. https://doi.org/10.1002/(SICI)1099-1166(199912)14:12<1000:AID-GPS46>3.0.CO;2-E.
- Yang, M. 2020. “Investigating Seasonal Color Change in the Environment by Color Analysis and Information Visualization.” Color Research & Application 45 (3): 503–511. https://doi.org/10.1002/col.22484.
- Yan, Z., L. Yang, J. Yu, and S. Guo. 2022. “Do Seasons Matter? Exploring the Dynamic Link Between Blue-Green Space and Mental Restoration.” Urban Forestry & Urban Greening 73:127612. https://doi.org/10.1016/j.ufug.2022.127612.
- Yujing, Z., P. Liu, B. Han, Y. Xiang, and L. Li. 2019. “Hue, Chroma, and Lightness Preference in Chinese Adults: Age and Gender Differences.” Color Research & Application 44 (6): 967–980. https://doi.org/10.1002/col.22426.