
 ?Mathematical formulae have been encoded as MathML and are displayed in this HTML version using MathJax in order to improve their display. Uncheck the box to turn MathJax off. This feature requires Javascript. Click on a formula to zoom.
ABSTRACT
Defects in buildings accelerate the deterioration of building conditions and threaten the structural safety of buildings. Building condition assessments are essential to identify and assess building defects. However, with the vast number of buildings, individual inspections are nearly impossible, highlighting the need for innovative solutions. Therefore, this study presented a safety inspection process that automatically detects and classifies defects using image data that can be easily acquired at a low cost and confirms the location of defects through 3D modeling. A CNN model is developed to detect defects in images of aging buildings, and the proposed process is validated through a case study to demonstrate its effectiveness. The case study focused on the effectiveness and convenience improvement of the proposed process compared to the existing methods of inspecting the exterior of buildings. The effectiveness of the proposed process was reviewed through the case study, and it was confirmed that more efficient safety inspections could be supported using only image data compared to the existing methods. In particular, the safety inspection process of this study is expected to be applied in practical use within a short period since it is an easily utilizable method for inspectors.
1. Introduction
Currently, major developed countries are preparing countermeasures by emphasizing the importance of investment and proper maintenance for the aging social infrastructure. According to the “2021 Report Card for America’s Infrastructure,” as of 2021, the U.S. infrastructure status rating was evaluated as a “C-” rating on average. In addition, ASCE estimated the amount of investment as $ 5.94 trillion in order to keep proper maintenance and to get a grade B in each infrastructure sector once every four years American Society of Civil Engineers (Citation2021). Furthermore, according to the Ministry of Land, Infrastructure, Transport, and Tourism of Japan (MLIT Citation2018), it is projected that by 2033, 63% of Japan’s road bridges, 42% of tunnels, 62% of river management facilities, and 58% of port docks will have surpassed 50 years since their initial construction. As such, the post-preservation maintenance method of social infrastructure threatens serious national economic loss and public safety. Consequently, the construction industry is changing from a focus on the construction of new buildings to a focus on maintenance for the safety and longevity of deteriorated buildings according to the trends (Ferraz et al. Citation2016).
The most important thing for the proper maintenance of facilities is to determine the degree of deterioration of the targeted facilities and the structure, and an inspector with specialized knowledge conducts a visual inspection to determine the degree of deterioration of the structure. A manual visual inspection is a major form of evaluating the physical and functional conditions of any infrastructure (Koch et al. Citation2015). In general, condition assessment is a procedure for identifying defects and damages (cracks, peeling, delamination, corrosion, etc.) that occur in infrastructure such as roads, tunnels, buildings, and bridges. The results of the condition assessment are used to improve physical and functional conditions after establishing a maintenance plan and budget allocation for the facility. However, existing methods for investigating defects in facilities are manpower-dependent and have the disadvantage of taking a lot of time and cost. In addition, there are problems such as a lack of professional inspectors due to the rapid increase in old facilities, risk of subjective judgment, little work experience of inspectors, inability to check defects in tricky locations which visual inspection can hardly do, and the risk of omission of information due to manual work (Agnisarman et al. Citation2019; Spencer, Hoskere, and Narazaki Citation2019; Tan et al. Citation2021). To solve these problems, many researchers have been researching on the state evaluation of deteriorated facilities using advanced technologies (drones, laser scanners, robots, AR/VR, etc.) and artificial intelligence (AI) technology. Advanced technologies and artificial intelligence are not only employed to assess the condition of aging infrastructure, but are also widely utilized across various sectors of the construction industry, including construction project monitoring (Rahimian et al. Citation2020), worker monitoring (Ogunseiju et al. Citation2022), and preservation of cultural heritage (Mansuri and Patel Citation2022). These tools effectively analyze complex data and proactively address potential problems, enhancing project success rates, reducing risks, and preserving infrastructure efficiently.
Seo et al. (Citation2018) examined the drone’s ability to perform activities related to bridge inspection and compared the damage detected using drones with the inspection report provided by the SD Department of Transportation (SDDOT). As a result, the drone was able to identify various types of damage such as cracking, spalling, and corrosion, and also to closely inspect areas that are difficult to access directly, and it was proved that the drone can detect more damage and defects efficiently. Munawar et al. (Citation2021) used UAVs for collecting crack data from middle- and high-rise buildings (higher than five stories) in Sydney, Australia, and proposed a CNN-based architecture for crack detection. The performance of the proposed model was verified to be within a similar performance range as indicated by performance evaluation metrics reported in previous studies. However, the authors pointed out that current research focuses on middle- and high-rise buildings, and mentioned the necessity of developing drone-based monitoring frameworks for various types of buildings including small buildings in the future. Additionally, the paper has the limitation of being unable to detect defects other than cracks. Similarly, many related studies have focused primarily on cracks. According to Guo et al. (Citation2024), who reviewed 237 journal papers on deep learning-based surface defect detection using images, it has been pointed out that previous research primarily focused on specific types of defects, such as cracks. Meanwhile, Alshawabkeh et al. (Citation2020) presented a 3D modeling method combining photogrammetry and laser scanning to monitor the progress of surface cracks and the aging of cultural heritage. And it was confirmed that it is an efficient and effective tool to identify the characteristics, scope, and severity of surface aging. In addition, research by Mansuri and Patel (Citation2022) and Mishra et al. (Citation2022) developed artificial intelligence models for detecting defects such as spalling, exposed bricks, and cracks in cultural heritage. However, since the material properties differ from concrete, which is the main material in modern architecture, there is a need for the development of models suitable for it. In addition, Kung et al. (Citation2021) proposed a CNN model for automatic detection and localization of major defects (whitening, exfoliation, cracks, and damage) of buildings based on the image of exterior wall tiles of buildings acquired using a UAV. This study used mobile devices and UAVs to detect real-time defects in outer wall tiles of buildings and showed that they can effectively detect outer wall defects when applied with deep learning. However, this CNN model has the disadvantage of being time-inefficient as it cannot consider multiple types of defects simultaneously in a single image. As such, numerous studies have proven that the use of advanced technology and artificial intelligence is useful for increasing the objectivity and efficiency of condition evaluation of social infrastructure. However, the CNN models in related studies were limited to detecting only certain defects, such as cracks, or had limitations in the types of defects that could be detected in an image. This has highlighted the necessity to develop CNN models capable of detecting a wider variety of defects in one image than previously possible.
Meanwhile, existing relevant studies have been mainly conducted on large facilities (e.g., pavement and bridge) (Guo et al. Citation2024). Buildings that are aging in the same way as large facilities such as bridges, dams, and roads have been alienated from safety inspection and condition evaluation due to their small size. The largest number of facilities in the world are buildings where people inhabit and live in. Buildings require high safety standards because they are the places where people spend most of their time. However, it is practically impossible to check all the conditions of numerous buildings. In the near future, to solve these problems, even those with insufficient expertise will need a way to easily evaluate the condition of the building. Therefore, in this study, a maintenance process study using advanced technology and artificial intelligence was conducted to perform efficient safety inspections for small- and medium-sized deteriorated buildings. This study aims to present a safety inspection process that can automatically detect and classify defects using image data that can be easily acquired at a low cost and check the location of defects by three-dimensional modeling. A CNN model for detecting defects in deteriorated building images is developed, and the effectiveness of the proposed process is verified through a case study. The case study is intended to focus on improving the efficiency and convenience of the proposed process compared to the existing building exterior survey method.
1.1. Generation of reverse design model using photogrammetry technique
Photogrammetry means interpreting the shape of an object using light and is a technique for extracting 3D modeling data using 2D images. In the 2D image taken by the camera, the reflected light of the 3D object is projected onto the 2D sensor, so the distance information between the camera and the object among the 3D information disappears. However, distance information can be restored by calculating three-dimensional information of an object from multiple images taken at different locations for the same object. In general, in order to acquire the shape of a large-scale object such as a building or facility, photogrammetry using a drone that can efficiently acquire data from a large-scale area is performed (Achille et al. Citation2015; Fawzy Citation2019; Galantucci and Fatiguso Citation2019). Drone photogrammetry obtains data through image sensors such as cameras mounted on drones, LiDARs, thermal imaging cameras, and multi-spectral cameras.
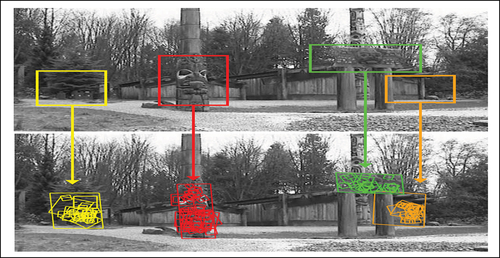
Photogrammetry using drones creates an automatic matching three-dimensional point cloud using the Scale-Invariant Feature Transform (SIFT) method and the Structure From Motion (SFM) method. SIFT extracts and matches key points that are invariant to scale and rotation from photographic images and is a suitable method for photographic imaging techniques acquired with rocking drones. According to Lowe (Citation2004), the SIFT performance stage consists of (1) scale-space extreme detection, (2) keypoint localization, (3) orientation assignment, and (4) keypoint descriptor. is an example of location recognition using the SIFT technique, and feature points are marked with squares.
Figure 1. Example of position recognition of an object using SIFT technique (Lowe Citation2004).
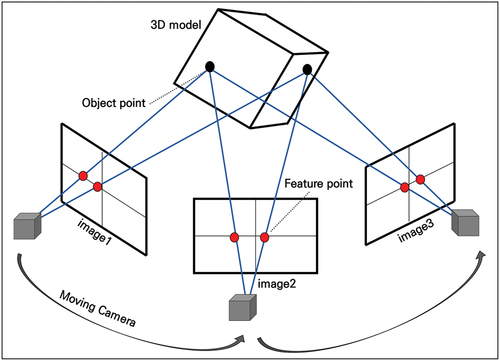
SFM is a method of estimating the camera position and direction from numerous 2D images taken from various viewpoints and generating a 3D point cloud of the captured object or scene (Green, Bevan, and Shapland Citation2014). The SFM technique has the advantage of being able to locate the camera by finding and matching unique feature points of each captured image as shown in and processing a large number of images taken by drones in a short time (Jones and Church Citation2020). In addition, SFM increases the precision of 3D modeling as the number of pictures taken increases.
Figure 2. Structure from motion (SFM).
2. Deep learning algorithm for image processing
2.1. Deep learning overview
Deep learning can be defined as a machine learning technique using a deep neural network. Deep learning has made great progress based on the emergence of methods that can overcome the limitations of existing artificial neural networks, the development of computer performance, and big data. Deep learning has various models, such as Convolutional Neural Network (CNN), Recurrent Neural Network (RNN), and Generative Adversarial Network (GAN), depending on various data formats and methods of analysis. CNN is a technique that mimics the structure of the human optic nerve and is an effective model for analyzing two-dimensional data such as images or videos(Yamashita et al. Citation2018). CNN has an excellent performance in image recognition and classification and is used in fields such as computer vision (Ekanayake et al. Citation2021; Luo et al. Citation2018), self-driving cars (Chishti et al. Citation2018; Ouyang et al. Citation2019), and face recognition(Coşkun et al. Citation2017; Xie, Li, and Shi Citation2019). RNN is a model that processes inputs and outputs considering the order of data and has strengths in sequential data analysis. In general, RNN is a model mainly used for time series prediction, and natural language processing (NLP) (Hu et al. Citation2020; Qin et al. Citation2017; Yao and Huang Citation2016). GAN refers to a model in which a generator and a discriminator compete with each other to generate data and a voice or image is generated using the pattern learned by the unsupervised learning method. GAN is mainly applied to the image and voice restoration (J. Qiu and Xie Citation2019; Z. Qiu et al. Citation2022), and deep fake techniques (Frank et al. Citation2020) are typically made with GAN techniques. Since this study will apply deep learning technology based on image data of buildings, we intend to adopt the most suitable CNN model among deep learning models.
2.2. CNN for image data analysis
CNN is a representative deep learning model for analyzing image data (Mikołajczyk and Grochowski Citation2018). CNN extracts and classifies the features of the image while maintaining spatial information of the image. shows the conceptual structure of CNN and consists of a step of extracting features of an input image (feature learning) and a step of classifying feature images (classification). The feature extraction neural network consists of several layers of convolution layer and pooling layer. The convolution layer uses a kernel to detect the characteristics of the image when the input image comes in and generates an extracted feature map. The kernel is a two-dimensional matrix that uses a matrix (n×n) smaller than the image size to multiply the kernel size by the value of the element in the area where the image area overlaps. The kernel is determined through learning, and the features extracted from the convolution layer are determined depending on which filter is used. The feature map is output through an activation function, which is a nonlinear function. The feature map obtained through the convolution operation is smaller than the initial input, and if you want the size of the feature map to be the same as the input size, padding is applied. Padding means filling a dummy value around input data. The pooling layer reduces the size of the data after the convolution process to increase computational efficiency and prevent overfitting. Overfitting means that the model is over-optimized for the learning data, providing accurate predictions for the learning data, but degrading performance for the actual data. The pooling method includes max pooling, average pooling, and stochastic pooling, and CNN mainly uses max pooling.
Figure 3. CNN model conceptual structure.
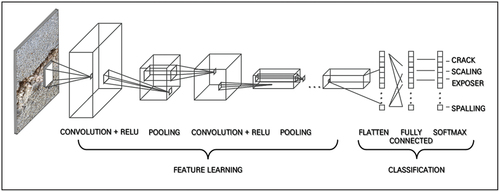
In the classification step, a flattening operation is performed to convert a matrix-type characteristic map, which is a result of the final pooling, into a vector. Flattened input data in the form of a one-dimensional array and weights are delivered to a fully-connected neural network (fully-connected layer) corresponding to one-to-one. In the final output layer, an activation function such as softmax is used to output the probability that the image classification for the class is correct.
3. Deep learning algorithm for image processing
3.1. Design of defect image classification model
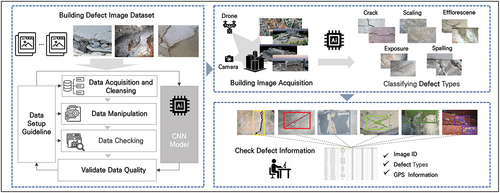
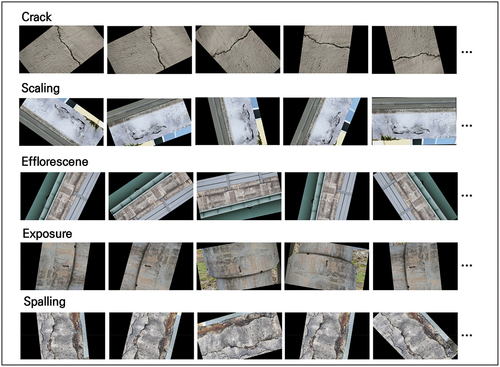
This study aims to build a CNN-based deep learning model that detects defects in structural members and exterior walls of deteriorated buildings using image data of deteriorated buildings and classifies them by defect type. The process of building a deep learning model is shown in . It collects learning data for each type of defect in deteriorated buildings and performs a process to improve the quality of data sets through data processing and reclassification. In addition, data augmentation is performed to prevent overfitting due to the lack of data in the deep learning model. The finalized data set is used to train an image classification deep learning model. The input of the model is defect image data, and an image containing one or more defects among five defect types may be included. The output of the model is five categories to which the defects included in the image belong. Using a trained deep learning model, we validate the automatic defect classification performance through deteriorated building image data acquired in the actual field. As a selection criterion, the type of defects that can be confirmed with the naked eye and can be clearly distinguished was selected. In addition, the scope was set based on the safety inspection and evaluation items of concrete structures, which account for the largest proportion of small and medium-sized buildings. Finally, five types of defects (crack, leak and efflorescence, exposure, delamination, spalling, and layer separation) were selected as classification criteria.
Figure 4. Process for building a deep learning model.
3.2. Collecting and augmentation of learning image data
3.2.1. Collecting defect image data
The quality and amount of data have a significant impact on the performance of the deep learning model (Khosla and Saini Citation2020). Therefore, the process of securing high-quality defect image data in large quantities is very important (Kaur, Khehra, and Mavi Citation2021. In this study, the AI Hub platform provided by the Ministry of Science and ICT and the National Information Society Agency (NIA) secured a data set of defects of buildings for AI learning. The dataset was built to train large SOCs and artificial intelligence to detect cracks in large buildings using drones.
Data construction was carried out through this process; planning → data acquisition → annotation → quality verification. Various defects were photographed and labeled using drones and smartphones for large buildings, dams, bridges, retaining walls, steel structures, and plants. The labeling information consists of dataset information, image information, license information, labeling object classification information, and labeling object information. shows defect image data information provided by the AI Hub platform. The major categories are classified as defects in concrete structures and steel structures, and a total of six types of defects, such as concrete crack, spalling, efflorescence, rebar exposure, steel defect, and paint damage. In addition, a photography guide was established in advance to obtain image data that can be recognized by a computer and acquired based on this.
Table 1. Defect image data information provided by the AI Hub platform.
However, the dataset in contains a wider range of data than the scope of this study, and the criteria for classifying defects are not specific. Therefore, in this study, the scope was limited to the classification of defects in concrete structures excluding steel structures, and it was subdivided into five items with “spalling and layer separation” added to the existing 4 sub-category items. The dataset provided by AI Hub enclosed three items: delamination, spalling, and layer separation into subcategories called “delamination”, but in this study, they were categorized directly into delamination, spalling, and layer separation. The AI Hub-provided data were reclassified into five items in according to the added items. To improve the accuracy of the model, we reviewed the entire source data for each item and selected images with clearly identifiable defects and no significant contrast differences. The reclassification work was carried out by three entry-level construction technicians, completing manual categorization according to the concrete defect criteria of the Korea Authority of Land and Infrastructure Safety, and then being inspected by two advanced technicians. Finally, source data classified into 600 sheets for each defect item is used as training data for the deep learning models.
Table 2. Defect image reclassification results.
3.2.2. Augmentation of defect image data
In this section, a process of increasing the amount of defect image data is performed using a data augmentation technique. In this study, the training data set was expanded using Imgaug, a python data augmentation package. Data augmentation techniques include various skills such as symmetry conversion, shear, cutting, rotation, and position change. However, reckless data augmentation can negatively affect learning performance by destroying the characteristics that data had. Therefore, considering the characteristics of each of the five types of defect image data, the basic augmentation techniques, rotation and shear, were applied to the extent that the shape of the defect was maintained rather than the enhancement techniques that made a big change. The image was randomly applied for rotation from −180 to 180 degrees, and the shear was randomly applied from −20 to 20 degrees. The defect image data resolution used for data augmentation has a file extension png of 1920 × 1080pixels. An example of data augmentation result is shown in (), and augmented image data were calculated for each source image data. Finally, 6,000 augmented image data for each of the five defect types were generated.
Figure 5. Example of training image data augmentation results.
3.3. Automatic defect detection and learning a classification model
In this study, we adopt a method of building an image classification model and learning from training data using Azure Custom Vision. Microsoft Azure’s Custom Vision API is a cloud-based application programming interface (API) and an image-aware AI service. The Custom Vision service can train a customized deep learning model that allows users to label and recognize the desired image dataset. It also has the advantage of being able to use the trained deep learning model as a web-based interface.
The automatic defect detection and classification deep learning model was trained several times on the defect image dataset built on the Convolutional Neural Network of Custom Vision API. Defect image data, which varies upon camera angle, lighting, background, size, and type, were used to effectively train the model. Images by defect type were uploaded and tagged manually. Sufficient data was applied for each label so that the Convolutional Neural Network could easily determine the differences between the labels. After the first training, the training set is adjusted to balance the dataset. Submission of images for testing after refinement of all datasets can be done either programmatically or manually, and image test results are returned in the form of a json document.
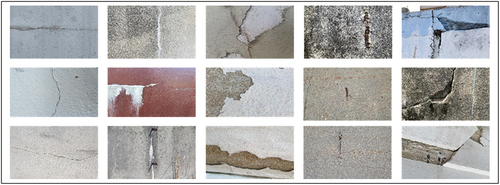
In the learning image data used in this study, there are many cases in which several types of defects are mixed in one image, so we proceeded with Multilabel (Multiple tags per image). Therefore, if there are multiple defects in one image, multiple tags were displayed. A total of five tags were used and were classified as “crack”, “scaling”, “spalling”, “efflorescence”, and “exposure”. Some of the data in the final dataset are shown in ().
Figure 6. Part of the learning image dataset.
3.4. Automatic defect detection and classification model performance evaluation
In order to evaluate the accuracy of the trained model, precision, recall, and AP performance metrics, which are mainly used in classification performance evaluation, were reviewed.
is a confusion matrix and is a table for comparing predicted values and actual values to measure prediction performance through learning. The confusion matrix represents the relationship between the actual value and the predicted value, and the value consists of Positive and Negative. In , True Positive (TP) and True Negative (TN) are the predicted parts consistent with the actual values, and False Positive (FP) and False Negative (FN) mean the predicted part that is different from the actual value.
Figure 7. Confusion matrix.
Precision represents the ratio of actual True among what the model detects as True, and is expressed as Eqn (1). For example, if the model identified 100 crack images and 91 were actually crack images, The precision is 91%. Recall is the ratio of what the model predicts to be true among what is actually True, and expressed as an equation, it is the same as Eqn (2). For example, if there were actually 100 crack images and the model recognized 95 of them as cracks, Recall would be 95%. Average Precision (AP) refers to the area below the PR curve using Precision and Recall and is a quantitative measure of the object detection algorithm
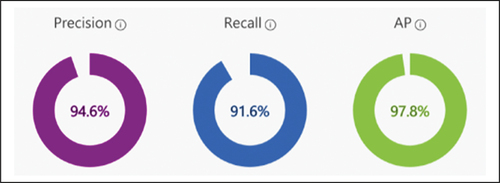
shows the precision, recall, and AP measurements of the trained model. It was confirmed that the trained model has a high accuracy of Precision: 94.6%, Recall: 91.6%, and AP: 97.8%. As such, automatic defect detection and classification deep learning models with confirmed accuracy can perform evaluations on single or multiple images, and the results are presented in percentage format per tag.
Figure 8. Defect detection and classification model performance metrics.
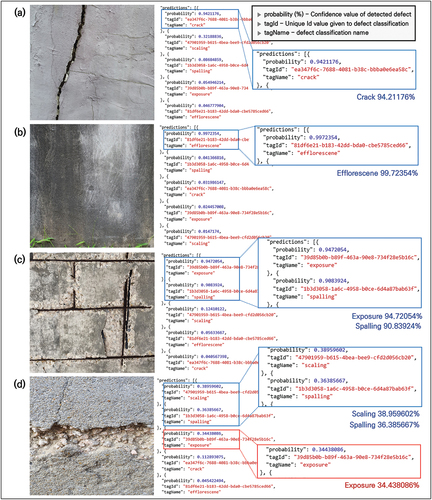
is the result of a defect classification prediction test by uploading a new image that has not been trained before to the model. The “probability” indicates the confidence value of the defect detected in the image. The “tagId” represents a unique ID value assigned to the defect classification. The “tagName” indicates the type of defect detected in the image. The corresponding model represents the highest percentage of tags in which defect information should be classified within the image. In , the blue square shows an accurate classification of the defect types shown in the image, and the red square shows an incorrect classification. The model proposed in this study can detect multiple defects in a single image. (a) and (b) of are cases where a single defect exists in the image, and (c) and (d) of are cases where two or more defects exist. In , it can be seen that the type of defect is detected with high probability with “crack (about 94.21%)” and “efflorescence (about 99.72%)”, respectively. In addition, in , where rebar exposure occurred due to spalling, it can be confirmed that both defects “exposure (about 94.72%)” and ‘spalling (about 90.84%) are detected and classified. In the case of , both “scaling (about 38.96%)” and “spalling (about 36.39%)” were detected, but a low probability error was detected. This can be attributed to the detection of “exposure”, which does not exist in the image of . The reason for this is the lack of closely captured rebar exposure data during the model training, especially in comparison to other types of defects. Therefore, it is anticipated that acquiring and incorporating high-resolution images of closely captured rebar exposures into the training process will enhance the accuracy of the model.
Figure 9. Result of a defect classification prediction test.
4. Case study
4.1. Data collection and creating 3d model
This study acquired image data of the entire shape of the target deteriorated building using a drone. Since the target building is relatively small with a total floor area of 753.38 ㎡, and located in a housing complex, a low-altitude flight is required. In addition, drones equipped with high-performance cameras were required to identify defect information based on images. In this study, DJI’s Mavic 2 model equipped with a 1-inch sensor camera was used. The Mavic 2 is a rotorcraft that supports GPS automatic flight and has the advantage of good portability due to its small size. In this study, GPS automatic flight function was used to obtain image data captured at a certain altitude, and the shooting time took 26 minutes. Pix4D Mapper software was used to convert 2D image data acquired at a uniform altitude into 3D modeling. Image data is based on Point Cloud with color information, so height values on the ground and coordinates of specific points can be precisely measured. All image data were processed through Pix4D Mapper and a Point Cloud with coordinate values was created, and this process took 1 hour and 10 minutes. The steps for collecting image data using drones are as follows ().
Figure 10. Creating of image-based 3D model.
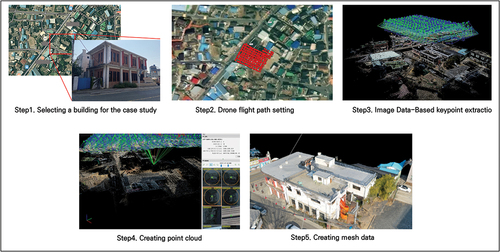
Step 1: Selecting a building for the case study
Step 2: Establishing a drone flight path for the target building
Step 3: Image data-based Keypoint extraction
Step 4: Creating point cloud
Step 5: Creating mesh data
4.2. Results of defect prediction using cnn model
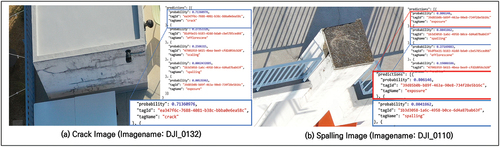
shows the defect type prediction values applied to drone image data and deep learning models. The automatic detection and classification of defects based on the CNN model took 12 minutes. In , a clear crack is confirmed on the outer wall of the building, and the prediction result of the type of defect in also shows that it is a crack with a probability of 71.36%. On the other hand, (b) of shows that concrete is spalled off from the outer wall column. However, it can be confirmed that not only “spalling”, which means exfoliation, was detected at 80.41% of the predicted value of the defect type of the image, but also “exposure”, which means exposure of rebar, was also detected. It is judged that this was incorrectly detected in (b) of due to the roof railing and the shadow of the railing caused by sunlight. In this way, it can be seen that the data taken by the drone includes many unnecessary backgrounds other than the defective area and is affected by the brightness of the surroundings like shadows. These issues can be overcome by conducting the photography during the time when the sun is at its zenith, resulting in the shortest shadows, and by utilizing image processing techniques for shadow detection and elimination.
Figure 11. Predicted values of drone imaging crack and spalling images.
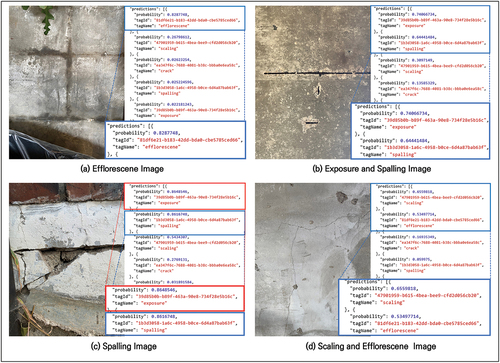
is an image of a leak investigated on the inside wall of the second floor, and the deep learning model shows that it is “efflorescence,” which means leak and efflorescence, with an accuracy of about 82%. is an image of rebar exposure due to concrete flakes found on the ceiling of the second floor. The deep learning model detected “exposure,” which means rebar exposure at about 74%, and “spalling” which means exfoliation at about 64%. In this way, it may be confirmed that the deep learning model may detect various defects in one image. On the other hand, in , spalling was detected with a high probability (about 86%), but it can be seen that exposure was falsely detected with a similar probability. This is believed to have mistakenly recognized the flakes generated in the form of thick straight lines as rebar exposure. The results of detecting scaling and efflorescence are shown in , and the prediction probabilities are about 65% and about 53%, respectively, compared to defects with clear features such as cracks, rebar exposure, and spalling.
Figure 12. Defect image predicted value.
4.3. Identification of defect locations based on the 3d point cloud model
In the existing site safety inspection, when there is no drawing of the deteriorated building, the location information of the defect is recorded using a roughly drawn 2D paper drawing. At this time, the number of the defect image taken with the digital camera must also be manually indicated on the drawing. However, this is an inefficient method in which manually written defect information and locations must be input again as digital data, and corresponding image numbers are also individually searched and matched. This is a work that is prone to human error, and it is difficult to grasp the exact location information of the defect on the 2D drawing. Therefore, in this section, a method to overcome this problem is presented.
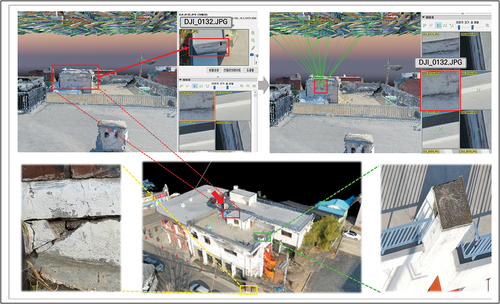
As for the image data, the coordinate value and the altitude value on which the image is photographed may be checked through a sensor embedded in the photographing apparatus. In addition, through these image data and the SFM technique mentioned in Section 1, it is possible to determine which part of the building a specific image is located in the 3D point cloud shape generated. Therefore, in this study, the three-dimensional point cloud model generated from the image data of the case study building was used to determine the location of the desired defect image. This was implemented using the Pix4D Mapper software, which supports SFM technique, enabling easy identification of the location of defects by searching for the image ID where they were detected. Furthermore, by clicking on the defects visible in the 3D point cloud model, one can determine the image ID that contains these defects. shows the location of the crack image (Image name: DJI_0132.JPG) in in the 3D point cloud model. intuitively shows that the crack in the image is located on the outer wall of the rooftop structure of the case study building. Thus, the proposed method can overcome the limitations of traditional approaches, which struggled to accurately determine the location of defects on 2D drawings. Furthermore, it is anticipated that this method will efficiently improve the conventional workflow, which manually marks the image ID of actual defects on 2D drawings.
Figure 13. 3D point cloud model-based defects image location.
5. Discussion and conclusion
The majority of smart maintenance-related studies have been carried out focusing on large-scale facilities (tunnels, roads, bridges, etc.), and the research on small and medium-sized buildings has been relatively insufficient. Therefore, in this study, a case study was conducted to apply the smart maintenance process to small and medium-sized deteriorated buildings, and the feasibility of the proposed process was confirmed.
Drones were used to acquire exterior images of buildings, and based on this, three-dimensional modeling was performed using Structure From Motion (SFM). Compared to laser scanning technology, this has the advantage of shortening the 3D modeling work time but has limitations in acquiring high-precision 3D point clouds. However, there was no problem in showing the exterior shape of the building and locating the image where the defect was detected. The image-based 3D point cloud model intuitively shows where the defect-detected image exists in the building. The existing method is an inefficient method of recording defect information and location through 2D drawings in the field, manually marking the image number taken separately, and then finding and matching them one by one at the office. It was confirmed that the image-based 3D point cloud model can overcome these shortcomings.
The trained deep learning model was used to predict the type of defects caused by the deterioration of the building using the interior and exterior images of the case study building. However, the probability of detecting defects was low because it was difficult to obtain close-up images of the target building data taken by drones, and many unnecessary backgrounds other than the defective area were included. This is an issue caused by the fact that in the process of photographing the exterior of a building in an deteriorated housing complex with a drone, it is difficult to take close-up shots due to electric wires and trees although there are no high-rise buildings around. To overcome this, a new image acquisition method such as ultra-close shooting using small drones is required.
Additionally, a cost analysis for efficacy validation was conducted through a case study of the proposed process. The time taken to capture image data of the building was 26 minutes. The process of aligning image-based 3D Point Clouds took 1 hour and 10 minutes, and the task of automatically detecting and classifying defects using the CNN model took 12 minutes. Therefore, the total time required for the process presented in this study was 1 hour and 48 minutes, which was found to be less than the time taken for conventional visual inspections on the same total floor area (753.38 m2). Traditional visual inspections were carried out by three technicians (expert, intermediate, and beginner) over 1 day (total 24 hours). This compares to the daily wage rate in South Korea in 2023, which is about 880,000 KRW, whereas the proposed process, including the cost of an expert technician and drone equipment, is estimated to be around 410,000 KRW. Consequently, the proposed process was found to be more productive in terms of time and cost.
In this way, this study conducted research to improve issues on the increasing number of small and medium-sized buildings with rapidity and insufficient inspection personnel. In particular, a process was proposed to perform automatically detecting and classifying defects using easily obtainable image data at low cost and quickly identifying the location of defects through 3D modeling. The effectiveness of the proposed process was reviewed through a case study, and it was confirmed that more efficient structural safety checks could be supported using only image data. Particularly, the safety inspection process of this study is expected to be applied to practice in a short period in a way that inspectors can easily utilize. Therefore, continuing research to overcome the above-mentioned practical issues will contribute to the longevity and safety of deteriorated buildings.
Disclosure statement
No potential conflict of interest was reported by the author(s).
Data availability statement
The participants of this study did not give written consent for their data to be shared publicly, so due to the sensitive nature of the research supporting data is not available.
Additional information
Funding
Notes on contributors
Suhyun Kang
Suhyun Kang is a Postdoctoral Researcher at Kyonggi University. Her research covers a wide range of topics in construction engineering, such as facility maintenance, construction site safety, and advanced modeling techniques. She utilizes technologies such as point cloud data, BIM, and machine learning to enhance decision-making processes. Kang’s work aims to improve the sustainability and safety of built environments, showcasing innovation in the construction industry.
Seungho Kim
Seungho Kim is an Assistant Professor at Yeungnam University College, specializing in the application of advanced IT technologies in construction engineering. His research focuses on enhancing construction site productivity and building maintenance through innovative methods such as 3D point cloud data, BIM, and drones. Professor Kim is dedicated to improving real-time monitoring systems and optimizing construction workflows, which contribute to increased efficiency and safety on construction sites.
Sangyong Kim
Sangyong Kim is an Associate Professor at Yeungnam University. His research spans various aspects of construction engineering, building maintenance, and advanced IT applications in construction. Professor Kim has explored topics like construction risk management, sustainable building practices, and construction cost estimation, showcasing his broad expertise in the field.
References
- Achille, C., A. Adami, S. Chiarini, S. Cremonesi, F. Fassi, L. Fregonese, and L. Taffurelli. 2015. “UAV-Based Photogrammetry and Integrated Technologies for Architectural Applications—Methodological Strategies for the After-Quake Survey of Vertical Structures in Mantua (Italy).” Sensors 15 (7): 15520–15539. https://doi.org/10.3390/s150715520.
- Agnisarman, S., S. Lopes, K. C. Madathil, K. Piratla, and A. Gramopadhye. 2019. “A Survey of Automation-Enabled Human-In-The-Loop Systems for Infrastructure Visual Inspection.” Automation in Construction 97:52–76. https://doi.org/10.1016/j.autcon.2018.10.019.
- Alshawabkeh, Y., M. El-Khalili, E. Almasri, F. Bala’awi, and A. Al-Massarweh. 2020. “Heritage Documentation Using Laser Scanner and Photogrammetry. The Case Study of Qasr Al-Abidit, Jordan.” Digital Applications in Archaeology and Cultural Heritage 16:e00133. https://doi.org/10.1016/j.daach.2019.e00133.
- American Society of Civil Engineers. 2021. 2021 Report Card for America’s Infrastructure. https://www.infrastructurereportcard.org/.
- Chishti, S. O., S. Riaz, M. BilalZaib, and M. Nauman. 2018. “Self-Driving Cars Using CNN and Q-Learning.” In 2018 IEEE 21st International Multi-Topic Conference (INMIC), 1–7. https://doi.org/10.1109/INMIC.2018.8595684.
- Coşkun, M., A. Uçar, Ö. Yildirim, and Y. Demir. 2017. “Face Recognition Based on Convolutional Neural Network.” In 2017 International Conference on Modern Electrical and Energy Systems (MEES), 376–379. https://doi.org/10.1109/MEES.2017.8248937.
- Ekanayake, B., J. K. W. Wong, A. A. F. Fini, and P. Smith. 2021. “Computer Vision-Based Interior Construction Progress Monitoring: A Literature Review and Future Research Directions.” Automation in Construction 127:103705. https://doi.org/10.1016/j.autcon.2021.103705.
- Fawzy, H. E. D. 2019. “3D Laser Scanning and Close-Range Photogrammetry for Buildings Documentation: A Hybrid Technique Towards a Better Accuracy.” Alexandria Engineering Journal 58 (4): 1191–1204. https://doi.org/10.1016/j.aej.2019.10.003.
- Ferraz, G. T., J. De Brito, V. P. De Freitas, and J. D. Silvestre. 2016. “State-Of-The-Art Review of Building Inspection Systems.” Journal of Performance of Constructed Facilities 30 (5): 04016018. https://doi.org/10.1061/(ASCE)CF.1943-5509.0000839.
- Frank, J., T. Eisenhofer, L. Schönherr, A. Fischer, D. Kolossa, and T. Holz. 2020. “Leveraging Frequency Analysis for Deep Fake Image Recognition.”In International conference on machine learning, Vienna, Austria, 3247–3258.
- Galantucci, R. A., and F. Fatiguso. 2019. “Advanced Damage Detection Techniques in Historical Buildings Using Digital Photogrammetry and 3D Surface Anlysis.” Journal of Cultural Heritage 36:51–62. https://doi.org/10.1016/j.culher.2018.09.014.
- Green, S., A. Bevan, and M. Shapland. 2014. “A Comparative Assessment of Structure from Motion Methods for Archaeological Research.” Journal of Archaeological Science 46:173–181. https://doi.org/10.1016/j.jas.2014.02.030.
- Guo, J., P. Liu, B. Xiao, L. Deng, and Q. Wang. 2024. “Surface Defect Detection of Civil Structures Using Images: Review from Data Perspective.” Automation in Construction 158:105186. https://doi.org/10.1016/j.autcon.2023.105186.
- Hu, J., X. Wang, Y. Zhang, D. Zhang, M. Zhang, and J. Xue. 2020. “Time Series Prediction Method Based on Variant LSTM Recurrent Neural Network.” Neural Processing Letters 52 (2): 1485–1500. https://doi.org/10.1007/s11063-020-10319-3.
- Jones, C. A., and E. Church. 2020. “Photogrammetry Is for Everyone: Structure-From-Motion Software User Experiences in Archaeology.” Journal of Archaeological Science 30:102261. https://doi.org/10.1016/j.jasrep.2020.102261.
- Kaur, P., B. S. Khehra, and E. B. S. Mavi. 2021. “Data Augmentation for Object Detection: A Review.” In 2021 IEEE International Midwest Symposium on Circuits and Systems (MWSCAS), Lansing, Michigan, USA, 537–543.
- Khosla, C., and B. S. Saini. 2020. “Enhancing Performance of Deep Learning Models with Different Data Augmentation Techniques: A Survey.” In 2020 International Conference on Intelligent Engineering and Management (ICIEM), London, UK, 79–85.
- Koch, C., K. Georgieva, V. Kasireddy, B. Akinci, and P. Fieguth. 2015. “A Review on Computer Vision Based Defect Detection and Condition Assessment of Concrete and Asphalt Civil Infrastructure.” Advanced Engineering Informatics 29 (2): 196–210. https://doi.org/10.1016/j.aei.2015.01.008.
- Kung, R. Y., N. H. Pan, C. C. Wang, P. C. Lee, and W. Yi. 2021. “Application of Deep Learning and Unmanned Aerial Vehicle on Building Maintenance.” Advances in Civil Engineering 2021:1–12. https://doi.org/10.1155/2021/5598690.
- Lowe, D. G. 2004. “Distinctive Image Features from Scale-Invariant Keypoints.” International Journal of Computer Vision 60 (2): 91–110. https://doi.org/10.1023/B:VISI.0000029664.99615.94.
- Luo, H., C. Xiong, W. Fang, P. E. Love, B. Zhang, and X. Ouyang. 2018. “Convolutional Neural Networks: Computer Vision-Based Workforce Activity Assessment in Construction.” Automation in Construction 94:282–289. https://doi.org/10.1016/j.autcon.2018.06.007.
- Mansuri, L. E., and D. A. Patel. 2022. “Artificial Intelligence-Based Automatic Visual Inspection System for Built Heritage.” Smart and Sustainable Built Environment 11 (3): 622–646. https://doi.org/10.1108/SASBE-09-2020-0139.
- Mikołajczyk, A., and M. Grochowski. 2018. “Data Augmentation for Improving Deep Learning in Image Classification Problem.” In 2018 international interdisciplinary PhD workshop (IIPhDW), 117–122. https://doi.org/10.1109/IIPHDW.2018.8388338.
- Ministry of Land, Infrastructure, Transport, and Tourism of Japan. 2018. “「社会資本の老朽化の現状と将来」.” http://www.mlit.go.jp/sogoseisaku/maintenance/02research/02_01.html.
- Mishra, M., T. Barman, and G. V. Ramana. 2022. “Artificial Intelligence-Based Visual Inspection System for Structural Health Monitoring of Cultural Heritage.” Journal of Civil Structural Health Monitoring 14 (1): 1–18. https://doi.org/10.1007/s13349-022-00643-8.
- Munawar, H. S., F. Ullah, A. Heravi, M. J. Thaheem, and A. Maqsoom. 2021. “Inspecting Buildings Using Drones and Computer Vision: A Machine Learning Approach to Detect Cracks and Damages.” Drones 6 (1): 5. https://doi.org/10.3390/drones6010005.
- Ogunseiju, O. R., J. Olayiwola, A. A. Akanmu, and C. Nnaji. 2022. “Recognition of workers’ Actions from Time-Series Signal Images Using Deep Convolutional Neural Network.” Smart and Sustainable Built Environment 11 (4): 812–831. https://doi.org/10.1108/SASBE-11-2020-0170.
- Ouyang, Z., J. Niu, Y. Liu, and M. Guizani. 2019. “Deep CNN-Based Real-Time Traffic Light Detector for Self-Driving Vehicles.” IEEE Transactions on Mobile Computing 19 (2): 300–313. https://doi.org/10.1109/TMC.2019.2892451.
- Qin, Y., D. Song, H. Chen, W. Cheng, G. Jiang, and G. Cottrell. 2017. “A Dual-Stage Attention-Based Recurrent Neural Network for Time Series Prediction. arXiv preprint arXiv:1704.02971. https://doi.org/10.48550/arXiv.1704.02971.
- Qiu, J., and K. Xie. 2019. “A GAN-Based Motion Blurred Image Restoration Algorithm.” In 2019 IEEE 10th International conference on software engineering and service science (ICSESS), 211–215. https://doi.org/10.1109/ICSESS47205.2019.9040717.
- Qiu, Z., J. Tang, Y. Zhang, J. Li, X. Bai, and W. Cao. 2022. “A Voice Cloning Method Based on the Improved HiFi-GAN Model.” Computational Intelligence and Neuroscience 2022:1–12. https://doi.org/10.1155/2022/6707304.
- Rahimian, F. P., S. Seyedzadeh, S. Oliver, S. Rodriguez, and N. Dawood. 2020. “On-Demand Monitoring of Construction Projects Through a Game-Like Hybrid Application of BIM and Machine Learning.” Automation in Construction 110:103012. https://doi.org/10.1016/j.autcon.2019.103012.
- Seo, J., L. Duque, and J. Wacker. 2018. “Drone-Enabled Bridge Inspection Methodology and Application.” Automation in Construction 94:112–126. https://doi.org/10.1016/j.autcon.2018.06.006.
- Spencer, B. F., Jr, V. Hoskere, and Y. Narazaki. 2019. “Advances in Computer Vision-Based Civil Infrastructure Inspection and Monitoring.” Engineering 5 (2): 199–222. https://doi.org/10.1016/j.eng.2018.11.030.
- Tan, Y., S. Li, H. Liu, P. Chen, and Z. Zhou. 2021. “Automatic Inspection Data Collection of Building Surface Based on BIM and UAV.” Automation in Construction 131:103881. https://doi.org/10.1016/j.autcon.2021.103881.
- Xie, Z., J. Li, and H. Shi. 2019. “A Face Recognition Method Based on CNN.” Journal of Physics: Conference Series 1395 (1): 012006. https://doi.org/10.1088/1742-6596/1395/1/012006.
- Yamashita, R., M. Nishio, R. K. G. Do, and K. Togashi. 2018. “Convolutional Neural Networks: An Overview and Application in Radiology.” Insights into Imaging 9 (4): 611–629. https://doi.org/10.1007/s13244-018-0639-9.
- Yao, Y., and Z. Huang. 2016. “Bi-Directional LSTM Recurrent Neural Network for Chinese Word Segmentation.” In Neural Information Processing: 23rd International Conference, ICONIP 2016, 345–353. Kyoto, Japan. October 16–21, 2016, Proceedings, Part IV 23.