
 ?Mathematical formulae have been encoded as MathML and are displayed in this HTML version using MathJax in order to improve their display. Uncheck the box to turn MathJax off. This feature requires Javascript. Click on a formula to zoom.
ABSTRACT
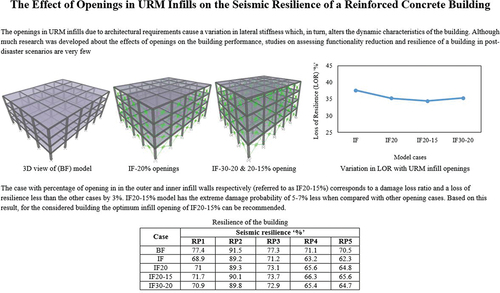
In high seismicity regions, the use of unreinforced masonry (URM) infills in reinforced concrete buildings is massive. In most of them, the openings in URM infills due to architectural requirements cause a variation in lateral stiffness which, in turn, alters the dynamic characteristics of the building. Although much research was developed about the effects of openings on the building performance, studies on assessing functionality reduction and resilience of a building in post-disaster scenarios are very few. This paper gives a contribution to that issue by performing and interpreting a parametric analysis which considers five models of a low-rise R.C. building with different percentages of infills openings. The results are expressed as extreme damage probability percentage, damage loss ratio and loss of resilience. The results show that the case with percentage of opening in in the outer and inner infill walls respectively (referred to as IF20–15%) corresponds to a damage loss ratio and a loss of resilience less than the other cases by 3%. IF20–15% model has the extreme damage probability of 5–7% less when compared with other opening cases. Based on this result, for the considered building the optimum infill opening of IF20–15% can be recommended.
GRAPHICAL ABSTRACT
1. Introduction
Nowadays, the significance of resilient structures and infrastructures is more and more increasing all over the world. Recommendations for incorporating adequate resilience into structural design were provided in numerous works (Prasanth and Ghosh Citation2021a, Citation2021b; Ranjbar Parvane and Hosein Citation2020) The resilience concept has also been used in steel structure based on which the resilience index has been proposed (Bavandi et al. Citation2023). The resilience assessment of reinforced concrete (RC) buildings with irregularities in plan and in elevation is a pressing problem to deal with, as demonstrated by recent earthquakes all over the world. The “material eccentricity” is due to the non-uniform distribution of the material strengths affecting existing R.C. buildings (Puppio et al. Citation2017, Citation2019). But an even more urgent problem is related to the modelling of infill URM walls in R.C. buildings, as the response of infilled structures markedly differs from that of gravity/bare frame buildings.
Seismic vulnerability assessment has been done for a RC school building with and without infill walls in the ground floor and with five different infilled wall opening configurations where the result shows the open ground floor building shows high vulnerability (Sathurshan et al. Citation2023). An RC frame with realistic combination of infill openings with respect to various dimensions of windows and doors has been subjected to various ground excitations, where the results shows negative correlation with infilled frame with opening and bare frame due to change in flexibility aspect (Kurmi and Haldar Citation2022). An integrated URM infilled existing RC building with five variable infill typologies were modelled and seismic risk assessment has been done by performing pushover analysis where the results shows that infills has significant impact on global behaviour of the structure by means of developing capacity curves (Mucedero, Perrone, and Monteiro Citation2021). The failure modes and infill-frame interaction pattern of an archetype existing Italian URM infilled building was studied with varying hazard, building stories and configuration of infills (Cardone et al. Citation2023).
An investigation was done in selection of appropriate macro-model for infill walls using OpenSees programming software, where the Pinching4 material shows better hysteresis accuracy with less average error on energy dissipation during cyclic loading (Mohammad Noh et al. Citation2017). Researchers showed that while masonry infills significantly increase the building stiffness for initial damage states, progressively the likelihood of damage increases (Prakash Phadnis and Karjinni Citation2019). Benefits of infills were evaluated by a comparison of the design guidelines for brick masonry infill provided by the Eurocode, Nepal building code, and Indian code (Das and Murty Citation2004). The vulnerability assessment for a masonry building with URM infills was carried out for several intensity measures, such as MSK and EMS-98 (Singh et al. Citation2013). Three distinct URM panel layouts were taken into account by Mohammadi, Mirzaei, and Reza Pashaie (Citation2021) for a two- and four-story building, concluding that buildings with URM walls exhibit superior seismic performance at low limit state levels, but negative seismic performance effects at higher limit states. The placement of URM walls at a certain location improves the lateral strength of the building, according to Dolšek and Fajfar (Citation2008). Non-linear analysis was used in a study by Mazza and Donnici (Citation2022) to analyse the two primary failure patterns for a reinforced concrete framed structure that is in-plane and out-of-plane modes. A study was carried out by (Shendkar et al. Citation2022) to assess how URM infill affected seismic design parameters as the response reduction factor (R), ductility and over strength factor. For a four-story structure with several infill configurations and taking into account three distinct infill compressive strengths, an adaptive pushover analysis was conducted. The findings demonstrate that the URM infill interactions have an impact on the over strength, whereas the full infill RC frame case corresponds to a greater R factor. Yuen and Kuang (Citation2015) demonstrated an increasing global stiffness through continuous infill placement at full height. The strong column-weak beam theory was found to be not applicable to infilled RC frames since it alters the infill frame interactions, according to the research. The considerable shift in the infilled RC structure’s time period was noticed by Asteris et al. (Citation2015). The findings indicate that the fundamental time period is significantly influenced by storey height, soft storey location, and infill wall stiffness. A non-linear dynamic analysis was carried out by Rooshenas (Citation2022) for three different high-rise asymmetrical buildings with masonry infills. The study came to the conclusion that the location of the centre of mass (rigidity) must be taken into account when designing a geometrically irregular structure, in addition to the infill configuration. Under cyclic loading conditions, Zamani-Ahari and Yamaguchi (Citation2022) investigated the seismic behaviour of retrofitted URM infills by utilising fibre reinforced polymer material. Non-linear analysis for a mid-rise building was conducted to study the impact of URM infills on structural resilience (Prasanth and Ghosh Citation2021c). In a study comparing a mid-rise building with URM infill walls and bare frame models with different openings the results highlighted once again the need of properly implementing URM infill in numerical models of real buildings (Prasanth, Ghosh, and Kulshrestha Citation2021).
According to previous studies, even though URM infills substantially impact a building’s dynamic response, the percentage of openings in the infills could remarkably vary a building performance, and limited research has been done on those factors so far. In addition to evaluating the effectiveness of URM-filled structures, it is essential to propose a research advancement on resilience so that the proper recovery measures can be planned. Thus, a thorough analysis of a low-rise URM-infilled structure with a range of opening scenarios is presented in this paper. Based on this study, the maximum admissible openings in infills for the building under consideration is calculated to meet the minimum resilience/sustainability criteria.
2. Methodology
The assessment of optimum opening percentage was made by performing a parametric analysis on typical low-rise R.C. URM infilled frame structure. This section describes the modelling techniques adopted to perform the numerical analyses performed with SAP2000 v22 (Citation2000).
2.1. Modelling of URM infills
The buildings without URM infills were modelled as bare frames with beam-type elements. Diagonal strut model was used to model infill walls according to ASCE 41–06 (Citation2007). To model infill walls requires the estimation of the diagonal strut effective stiffness and strength.
The elastic modulus and thickness of the strut element was considered to be same as the infill wall. As per ASCE41–06, the width of the strut element was calculated by using EquationEquation 1(1)
(1) :
in which the stiffness reduction factor is
represents the column height between centrelines of beams,
indicates the infill panel height,
denotes the modulus of elasticity of the building material (concrete),
the expected modulus of elasticity of infill material,
moment of inertia of column,
the angle whose tangent is the infill height to length ratio (radians),
the diagonal length of infill panel and
represents the thickness of infill panel and equivalent strut.
To incorporate the non-linearity in a structure, plastic hinges were assigned to structural members (beams and columns). The non-linearity for infills was modelled by using NL link plastic Wen element (SAP2000 Citation2014). The stiffness of the diagonal strut was estimated by means of Equationequation (2)(2)
(2)
Apart from stiffness, the plastic Wen element depends on two major factors such as yield strength and stiffness ratio at post-yield. As infill is a brittle material, its post yield stiffness is considered to be minimal, hence the post yield stiffness ratio is treated as zero.
2.2. Accounting for openings in the infill walls
URM infill walls in a building have few openings both in the inner rooms and in the external façades. When one considers openings, the building overall stiffness is obviously reduced. The building stiffness furtherly becomes lower as infill openings get increased. The actual width of the diagonal strut likewise reduces as a result of the decreased infill stiffness.
The width of strut with opening is equal to the stiffness reduction factor (λ) as per multiplied by the width without opening (Equationequation 1(1)
(1) ).
Figure 1. Infill frame stiffness reduction factor in proportion to percentage of openings (Asteris Citation2012).
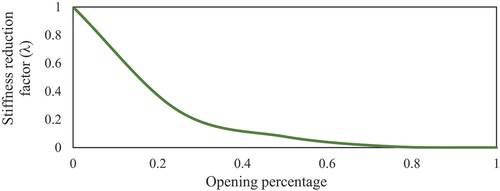
The stiffness reduction was found using the analytical EquationEquation 3(3)
(3) , which was proposed by Asteris (Citation2012).
Where denotes the percentage of openings in infills. The infill stiffness with respect to various percentage of openings are correlated from the graph shown in .
3. Description of the analysed buildings
A low-rise three-storey symmetrical RC building situated in high seismic hazard zone (Zone V, India) was chosen as reference building for the parametric analysis. The total building height is 12.00 m; the plan approximately measures 25 m by 20 m in longitudinal and transverse direction respectively. The symmetrical bare and URM infilled framed building plan and elevation are depicted in , respectively (Prasanth, Ghosh, and Kulshrestha Citation2021). Bare and URM infill framed building cases have been modelled and designed by using SAP2000 v22. In the bare frame model, the weight of the walls is evenly distributed over the beams. Infill walls are modelled by using a diagonal strut model (Asteris Citation2012; Gudainiyan and Gupta Citation2023; Mohammad Noh et al. Citation2017) for an RCC frame with infill walls. Different models, such as symmetrical bare frame and URM infilled frame buildings with different infill openings percentages, are taken into consideration for comparative analysis ().
Figure 2. Plan layout [24].
![Figure 2. Plan layout [24].](/cms/asset/5b1a9212-aa1e-4dc8-80a3-c5a03e658796/tabe_a_2378002_f0002_b.gif)
Figure 3. Three dimensional view of (BF) model.
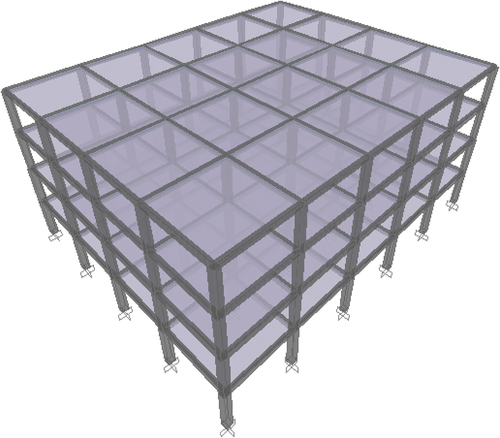
Figure 4. Elevation of the building.
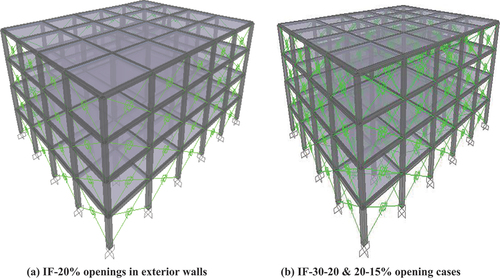
Table 1. Considered building model cases.
Synthetically, the considered building models are:
Infilled frame without openings (IF). Only the external walls without any openings are taken into consideration for infills.
Infilled frame with 20% openings (IF20);
Infilled frame with 20% and 15% (IF20-15) openings in outer walls and interior walls respectively.
Infilled frame with 30% and 20% openings (IF30-20) in outer walls and interior walls respectively.
The openings ratio has to be arrived based on the openings provided for doors, windows, etc. in a building in case of real case studies. From the literature review the maximum opening area ratio was found to be 20–30%. Hence in this study, the varying ratios were considered till 30% opening.
provides specific material information for building models. According to the Indian Standard (IS: Citation1893, Part-1. 2016) the seismic design parameters like zone factor (Z), importance factor (I) and response reduction factor (R) were taken as 0.36, 1.5 and 5, respectively. For the analysis, the maximum ground acceleration of 0.21 g, which corresponds to the magnitude of ground motion for an MCE level earthquake at zone V, was taken into account. Response spectrum curve as per IS:1893 (Citation2016) part-1 corresponding to MCE level was considered. In case of time history analysis, Elcentro ground motion time history (1940) recorded at 117 El Centro Array #9, IMPVALL/I-ELC180. The time history was made compatible to the IS Code response spectrum corresponding to MCE levels and considered in the analysis.
Table 2. Properties of the considered materials.
4. Resilience assessment
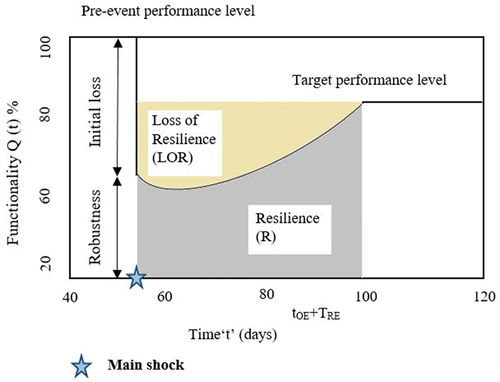
Resilience defines the capacity of a structure to resist and recovery back at post-disaster events in timely manner and with optimum costs. Resilience idea has lately become a real need in the field of civil engineering, but its assessment needs a large number of socio-economic factors. When assessing resilience of any structure, two essential variables have a considerable impact: recovery time and functional losses. The schematic depiction of resilience idea was provided in .
Figure 5. Concept of resilience and associated parameters.
The two major steps in the resilience assessment is the estimation of the damage loss ratio and that of functionality curves by referring to various recovery patterns. The conventional equation proposed by Paolo Cimellaro, Andrei Reinhorn, and Bruneau (Citation2010) to estimate the functionality reads:
4.1. Damage loss assessment
The loss function frec in EquationEquation (4)(4)
(4) indicates the damage loss ratio of the building. The vulnerability assessment was performed in SAP2000 according to the indications of Federal Emergency Management Agency (FEMA-440 Citation2005). The uniform acceleration loading was applied in longitudinal direction. For each building example, the roof displacement corresponding to the loading direction was found to be 71.7 mm, 19.5 mm, 22.4 mm, 24.2 mm and 36.3 mm for BF, IF, IF20, IF20–15 and IF30–20 cases respectively. The modal time periods were determined and listed in for each case.
Table 3. Comparison of modal time periods for each building case.
The vulnerability of the buildings were assessed using fragility curves which were found using HAZUS methodology. As per HAZUS MR4 technical manual [HAZUS MR4, (Citation2003)], the buildings experiences four damage states like slight, moderate, extreme and collapse. The probability of exceedance of each damage state was determined using equation below,
where, Sd is the spectral displacement defining the threshold of a particular damage state, Sd,ds is the median value of spectral displacement at which the building reaches the threshold of damage states which can be calculated by various damage state models, βds is the standard deviation of the natural logarithm of spectral displacement for damage state (ds) and ɸ is the standard normal cumulative distribution function.
From the capacity curve as obtained from the pushover analysis, the yield (Sdy) and ultimate (Sdu) displacement was found by bilinearization as per ATC-40 guidelines [ATC-40, 1996]. To find the threshold of damage state, the equation proposed by Barbat et al. (Citation2008) was used.
Based on spectral displacement of the building obtained from pushover and time history analysis, the probability of exceedance at each damage states were found using equation-(3.9).
The discrete damage probability was found using below formulations;
P [DS=S] = P [DS=S] - P [DS=M]
P [DS=M] = P [DS=M] - P [DS=E]
P [DS=E] = P [DS=E] - P [DS=C]
P [DS=C] = P [DS=C]
where, S = slight. M = moderate, E = extreme/extensive, C = collapse and DS = damage state
The same has been incorporated in the revised manuscript.
The fragility curves were then generated by implementing the HAZUS MR4 technique (HAZUS MR4 Citation2003). Afterwards, the cumulative probability of exceedance and discrete damage probability at each damage state were determined. The results are shown in . The fragility curve has been plotted with respect to spectral displacement at x-axis and probability of exceedance at y-axis. With respect to spectral displacement of each model cases the corresponding damage probability of exceedance with respect to various damage states will be found.
Table 4. Cumulative damage probability.
Table 5. Discrete damage probability.
Figure 6. Fragility curves for BF case.
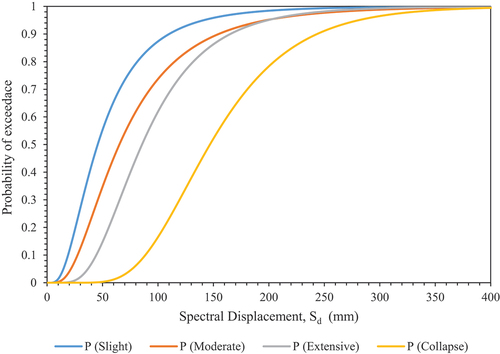
Figure 7. Fragility curves for if case.
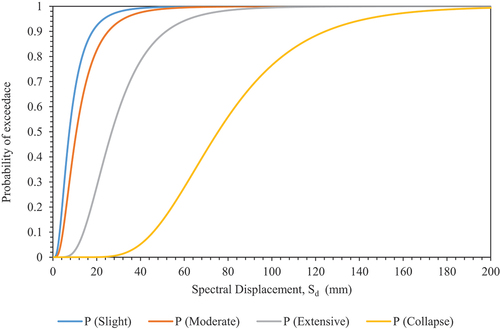
Figure 8. Fragility curves for IF20 case.
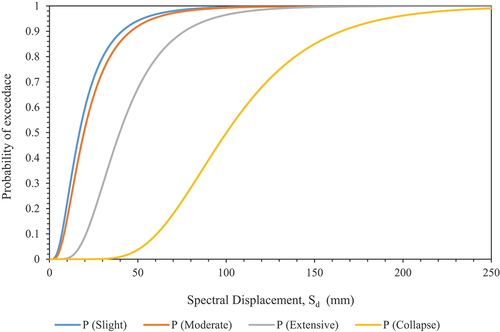
Figure 9. Fragility curves for IF20–15 case.
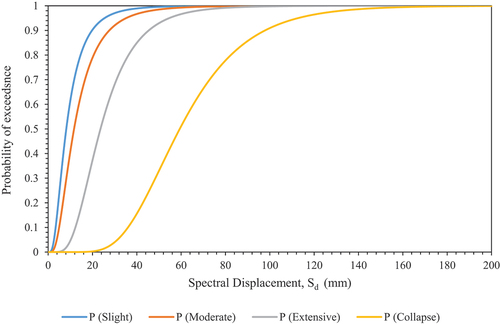
Figure 10. Fragility curves for IF30–20 case.
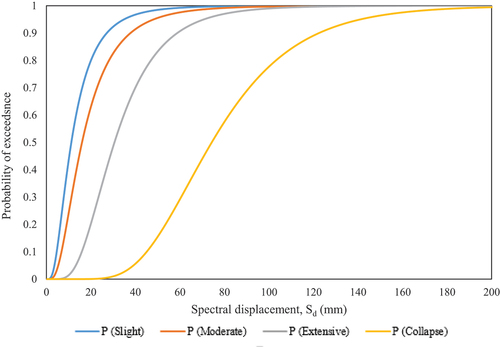
The fragility curves obtained for different building cases demonstrate that for bare frames compared to infilled frames, the curves corresponding to each damage state are flatter. For a given value of spectral displacement (Sd), the infilled frames have a higher chance of being damaged than the bare frame model due to the flatter trajectory of the fragility curves. When compared with the URM infilled building with and without openings, the building with openings obviously leads to a decrease in the structural stiffness. This affects the main building time period as shown in . As there is a significance reduction in the time-period () the building gains some flexibility hence the damage losses get reduces for the infill with opening cases when compared with infilled cases without openings ().
describes the damage probability of each model cases with respect to various damage states. For example, in IF model cases it was noted that the probability of moderate damage is of 94.05% whereas for BF model cases it was about 65%. From the cumulative damage probability, the discrete damage probability has been found to evaluate the loss ratio of each model cases ().
The damage loss ratio was estimated in the post-disaster event in terms of loss function denoted as L(I,TRE). From the discrete damage probability (), the ratio of direct damage losses was estimated by using the HAZUS methodology. The direct damage loss ratio was found for each building case and reported in .
Table 6. Damage loss ratio for each building cases.
4.2. Development of functionality curves
The building functionality curves were developed with the use of three conventional recovery paths namely linear (RP1), exponential (RP2) and trigonometric (RP3). Along with the mentioned recovery paths in this study the two recovery paths that resemble the real scenario recovery process (Prasanth, Ghosh, Kumar Gupta, Casapulla, et al. Citation2023; Prasanth, Ghosh, Kumar Gupta, Kumar, et al. Citation2023) were used for developing the functionality curve that matches the real scenario. The two recovery paths are termed as modified trigonometric path (RP4) and combined recovery path (RP5). To match a real scenario the new term “toi” (Prasanth, Ghosh, Kumar Gupta, Casapulla, et al. Citation2023; Prasanth, Ghosh, Kumar Gupta, Kumar, et al. Citation2023) was used in EquationEquation (4)(4)
(4) . The term toi indicates the delay in the process of recovery at initial and in between the recovery path/time. The schematic representation of it is shown in .
For the real scenario, each recovery functions follow three possible practical conditions. The linear path (RP-1) adopts a steady progress in the functionality, which implies timely availability of the resources. The exponential path (RP-2) has higher functionality rate at the initial path, which indicates the high resources inflow at initial stages but this is not possible in all situations. The trigonometric path (RP-3) followed less functionality rate at the beginning, which was due to lack of resources. The new parameter “toi” was introduced based on the concept that in practical condition the recovery cannot be started once the seismic event has occurred. It takes some time to start up the recovery process with proper damage assessment of the structure. The break in the recovery path/curve of RP-4 & RP-5 () shows the delay in process.
Figure 11. Functionality curve under various recovery path (Prasanth, Ghosh, Kumar Gupta, Casapulla, et al. Citation2023).
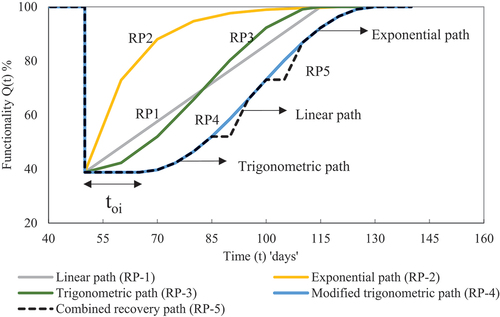
In this study, the 50th day was taken as the occurrence time of event (tOE), the target recovery time (TRE) as was fixed at 65 days and the total control time duration (TLC) was taken equal to 140. By using five recovery paths, the functionality curves were developed for each building case ().
Figure 12. Functionality curves for BF case.
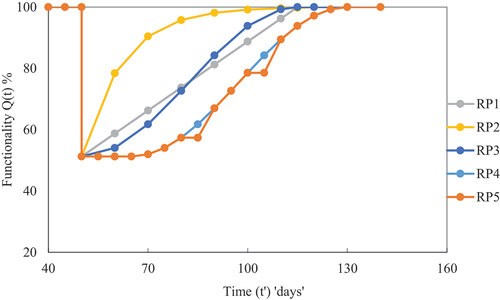
Figure 13. Functionality curves for if case.
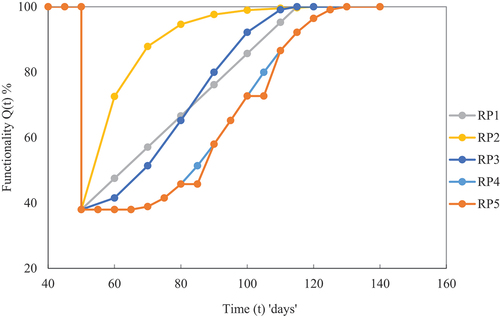
Figure 14. Functionality curves for IF20 case.
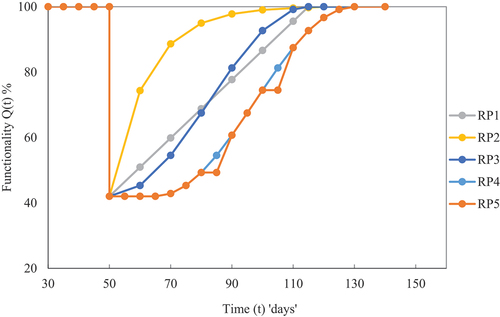
Figure 15. Functionality curves for IF20–15 case.
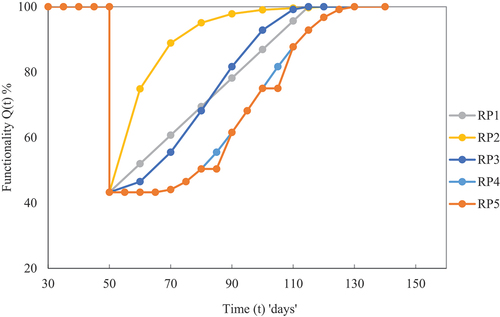
Figure 16. Functionality curves for IF30–20 case.
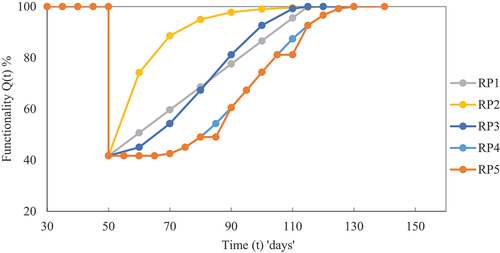
From the functionality curves () the drop in the building functionality from 100% to 51%, 38%, 42%, 43% and 41% for BF, IF, IF20, IF20–15 and IF30–20 model cases was observed respectively. When comparing with BF and IF cases, the functionality loss is higher in case of URM infilled building (IF case) without openings.
When comparing IF20 and IF30–20 model cases infilled model cases with openings, the IF20–15 cases shows 2–3% (consequently comparable, being this percentage negligible) lesser loss of functionality as compared to.
4.3. Seismic resilience corresponds to each cases
The area beneath and above the building’s functionality curves gives the available resilience and loss of resilience (LOR) of the building respectively. The resilience corresponding to each building cases was shown in .
Table 7. Resilience of the building.
It was observed that the URM infilled building without opening (IF case) shows slightly higher loss of resilience when compared with the bare frame building, the average decrease in resilience for infilled building IF model case was about 8–10%. The higher LOR was found to be 38% for IF model case. This was due to high damage loss ratio at case-IV.
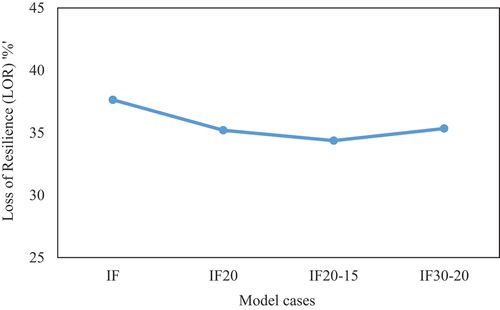
When comparing with infill opening model cases, IF20–15 model case shows better resilience and almost 3% lesser (consequently comparable, being this percentage negligible) loss of resilience (LOR). The variation in loss of resilience due to openings in the URM infills was shown in .
Figure 17. Variation in LOR with URM infill openings.
5. Conclusions
The study about the influence of infill openings on the building performance and its resilience was performed considering a low-rise building with infill openings of various percentage. These cases were compared with other conventional cases such as building without infill openings and bare frame building. A non-linear pushover analysis was carried out and the corresponding variation in the damage loss ratios was found. The variation in the building resilience for each case was then discussed. From the study, the following conclusions can be drawn:
It is evident that the probability of extreme damage is 20% higher in case of URM infilled building without openings (IF case) when compared with BF case. This was due to the higher energy dissipation of infilled building without openings due to its higher stiffness.
Building cases with URM infill walls have a greater damage potential percentage at a noticeably lower spectral displacement value. This denotes an alteration in the infill frame interaction-related failure process of the buildings.
Due to higher damage probability, the infilled building without openings (IF case) experiences almost 24% higher damage loss ratio when compared with the BF case. This shows that in spite of increasing the building stiffness, the infill-frame interaction on seismic response has an adverse effect on the building’s seismic vulnerability. When compared with infill opening cases, IF20–15 experiences about 3% less damage loss ratio among all other opening cases. However, this percentage can be considered negligible being the computational and modelling errors in the range of 5%.
At post-seismic event, the building with 20–15% opening (IF20–15) in infills shows a 3% lesser loss of resilience when compared with other infill cases. Again, this percentage is considered to be negligible.
The building with infill openings case IF20–15 shows better performance by maintaining the required design criteria by providing adequate stiffness and less damage losses. Based on the damage losses and loss of resilience the optimum opening case of IF20–15 can be recommended for the considered building.
The above results conclude the need of optimizing the infill openings and its consideration in seismic analysis as it affects the performance which in turn reduces its resilience capacity.
Acknowledgements
The corresponding author wishes to extend gratitude to all the authors who made valuable contributions to the successful completion of the research. The corresponding author thanks Dr. Linda Giresini, Assistant Professor, Department of Structural and Geotechnical Engineering, Sapienza University of Rome, Italy for her valuable support of the research.
Disclosure statement
No potential conflict of interest was reported by the author(s).
Data availability statement
All required data have been provided in the manuscript.
Additional information
Funding
Notes on contributors
Prasanth S
Dr. Prasanth S, as an Assistant Professor at the Centre for Disaster Mitigation and Management (CDMM) at Vellore Institute of Technology (VIT), has a research experience of almost 5 years in the area of seismic resilience and risk assessment of buildings. In pre-doctoral research, Dr. Prasanth worked as a structural design engineer for two years in various constriction companies like STUP Consultants and L&T Infrastructure Engineering. His entire research focuses on the development of resilient community towards disaster events. He has published various research articles related to resilience assessment of various building types in SCI/Scopus-indexed journals, conferences, and book chapters.
Goutam Ghosh
Dr. Goutam Ghosh, is currently an Associate Professor in Civil Engineering Department, MNNIT Allahabad, Prayagraj, India. He did his Ph.D. from IIT Roorkee in the area of seismic performance of bridge structures. He has more than 12 years of teaching experience and has published several research papers in reputed Journals/Conferences. His area of interest is earthquake engineering, performance-based design of structures, base isolation of structures, and bridge engineering.
Praveen Kumar Gupta
Dr Praveen Kumar Gupta is working as an Assistant Professor at the Forensic Structural Engineering Division of the School of Engineering and Technology, National Forensic Sciences University, Gandhinagar, Gujarat. His research areas include Forensic Investigation of Failures, Seismic Analysis and Design of Structures, seismic Retrofitting of Structures and seismic resilience and risk assessment of buildings. He has completed his Ph.D from Motilal Nehru National Institute of Technology in 2018. He has published 20+ SCI/Scopus Indexed research papers. He has also supervised one Ph.D. scholar and is currently supervising 02 PhD and 05 M.Tech scholars at various universities in India.
Virendra Kumar
Dr. Virendra Kumar is currently working as an Assistant Professor in the Department of Mechanical Engineering at Harcourt Butler Technical University, located in Kanpur, India. He has completed his Ph.D. in Thermal Engineering from the prestigious Indian Institute of Technology, Delhi, India and has more than eight years of experience in teaching and research. Dr. Kumar is a highly accomplished inventor with five patents and has also authored over 60 research articles in peer-reviewed journals.
Prabhu Paramasivam
Dr. Prabhu Paramasivam is a highly experienced mechanical engineering university teacher with over 12 years of teaching experience. He received his Bachelor’s and Master’s degrees in Mechanical Engineering from Anna University, India, and a Ph.D. in Mechanical Engineering from Himalayan University, India. He began his academic career as a Lecturer at Adama Science and Technology University, Ethiopia, where he taught undergraduate Mechanics and Materials Science courses. He has 75+ SCI/Scopus research publications in the Scopus database and more than 1200+ citations (H-index: 19, i-10 index: 32) to his credit index.
References
- ASCE 41-06. 2007. Seismic Rehabilitation of Existing Buildings. Virginia: American Society of Civil Engineers.
- Asteris, P. G. 2012. “Modeling of Infilled Frames with Openings.” The Open Construction and Building Technology Journal 6 (1): 81–91. https://doi.org/10.2174/1874836801206010081.
- Asteris, P. G., C. C. Repapis, A. K. Tsaris, F. Di Trapani, and L. Cavaleri. 2015. “Parameters Affecting the Fundamental Period of Infilled RC Frame Structures.” Earthquakes and Structures 9 (5): 999–1028. https://doi.org/10.12989/eas.2015.9.5.999.
- Barbat, A. H., L. G. Pujades, and N. Lantada. 2008. “Seismic Damage Evaluation in Urban Areas Using the Capacity Spectrum Method: Application to Barcelona.” Soil Dynamics and Earthquake Engineering 28:851–865.
- Bavandi, M., G. Ghodrati Amiri, E. Rajabi, and A. S. Moghadam. 2023. “Study of the Resilience Index for Steel Moment Frames with Reversible Connections.” Structures 47:814–828. https://doi.org/10.1016/j.istruc.2022.11.079.
- Cardone, D., L. R. S. Viggiani, G. Perrone, A. Telesca, A. Di Cesare, F. C. Ponzo, L. Ragni. 2023. “Modelling and Seismic Response Analysis of Existing Italian Residential RC Buildings Retrofitted by Seismic Isolation.” Journal of Earthquake Engineering 27 (4): 1069–1093. https://doi.org/10.1080/13632469.2022.2036271.
- Das, D., and C. V. R. Murty. 2004. “Brick Masonary Infills in Seismic Design of RC Framed Buildings: Part 1-Cost Implications.” The Indian Concrete Journal 78:39–43.
- Dolšek, M., and P. Fajfar. 2008. “The Effect of Masonry Infills on the Seismic Response of a Four-Storey Reinforced Concrete Frame—A Deterministic Assessment.” Engineering Structures 30 (7): 1991–2001. https://doi.org/10.1016/j.engstruct.2008.01.001.
- FEMA-440. 2005. Improvement of Nonlinear Static Seismic Analysis Procedures. California: Federal Emergency Management Agency.
- Gudainiyan, J., and P. K. Gupta. 2023. “Parametric Study of L-Shaped Irregular Building Under Near-Field Ground Motion.” Asian Journal of Civil Engineering 24 (7): 2561–2570. https://doi.org/10.1007/s42107-023-00663-9.
- HAZUS, MR4 Technical manual. 2003. Multihazard Loss Estimation Methodology. Washington DC, USA: Department of homeland society.
- IS: 1893, Part-1. 2016. Indian Standard Criteria for Earthquake Resistance Design of Structures. New Delhi: Bureau of Indian Standards.
- Kurmi, P. L., and P. Haldar. 2022. “Modeling of Opening for Realistic Assessment of Infilled RC Frame Buildings.” Structures 41:1700–1709. https://doi.org/10.1016/j.istruc.2022.05.110.
- Mazza, F., and A. Donnici. 2022. “In-Plane-Out-Of-Plane Single and Mutual Interaction of Masonry Infills in the Nonlinear Seismic Analysis of RC Framed Structures.” Engineering Structures 257:114076. https://doi.org/10.1016/j.engstruct.2022.114076.
- Mohammadi, M., M. Mirzaei, and M. Reza Pashaie. 2021. “Seismic Performance and Fragility Analysis of Infilled Steel Frame Structures Using a New Multi-Strut Model.” Structures 34:1403–1415. https://doi.org/10.1016/j.istruc.2021.08.015.
- Mohammad Noh, N., L. Liberatore, F. Mollaioli, and S. Tesfamariam. 2017. “Modelling of Masonry Infilled RC Frames Subjected to Cyclic Loads: State of the Art Review and Modelling with OpenSees.” Engineering Structures 150:599–621. https://doi.org/10.1016/j.engstruct.2017.07.002.
- Mucedero, G., D. Perrone, and R. Monteiro. 2021. “Nonlinear Static Characterisation of Masonry-Infilled RC Building Portfolios Accounting for Variability of Infill Properties.” Bull Earthquake Engineering 19 (6): 2597–2641. https://doi.org/10.1007/s10518-021-01068-2.
- Paolo Cimellaro, G., M. Andrei Reinhorn, and M. Bruneau. 2010. “Framework for Analytical Quantification of Disaster Resilience.” Engineering Structures 32 (11): 3639–3649. https://doi.org/10.1016/j.engstruct.2010.08.008.
- Prakash Phadnis, P., and V. V. Karjinni. 2019. “Effect of Infill in Composite Shear Wall RCC Building on Fragility Curve.” The Indian Concrete Journal 93:57–67.
- Prasanth, S., and G. Ghosh. 2021a. “Effect of Cracked Section Properties on the Resilience Based Seismic Performance Evaluation of a Building.” Structures 34:1021–1033. https://doi.org/10.1016/j.istruc.2021.08.035.
- Prasanth, S., and G. Ghosh. 2021b. “Effect of Variation in Design Acceleration Spectrum on the Seismic Resilience of a Building.” Asian Journal of Civil Engineering 22 (2): 331–339. https://doi.org/10.1007/s42107-020-00316-1.
- Prasanth, S., and G. Ghosh. 2021c. “Evaluation of Seismic Resilience of a Building with and without URM Infill Walls.” The Indian Concrete Journal 95 (8): 38–44.
- Prasanth, S., G. Ghosh, and A. Kulshrestha. 2021. “Assessment of Seismic Vulnerability of RCC Buildings with URM Infills.” Materials Today: Proceedings 38 (5): 3053–3065. https://doi.org/10.1016/j.matpr.2020.09.474.
- Prasanth, S., G. Ghosh, P. Kumar Gupta, C. Casapulla, and L. Giresini. 2023. “Accounting for Resilience in the Selection of R Factors for a RC Unsymmetrical Building.” Applied Sciences 13 (3): 1316. https://doi.org/10.3390/app13031316.
- Prasanth, S., G. Ghosh, P. Kumar Gupta, V. Kumar, P. Paramasivam, and S. Dhanasekaran. 2023. “Selection of Response Reduction Factor Considering Resilience Aspect.” Buildings 13 (3): 626. https://doi.org/10.3390/buildings13030626.
- Puppio, M. L., L. Giresini, F. Doveri, and M. Sassu. 2019. “Structural Irregularity: The Analysis of Two Reinforced Concrete (R.C.) Buildings.” Engineering Solid Mechanics 7 (1): 13–34. https://doi.org/10.5267/j.esm.2018.12.002.
- Puppio, M. L., M. Pellegrino, L. Giresini, and M. Sassu. 2017. “Effect of Material Variability and Mechanical Eccentricity on the Seismic Vulnerability Assessment of Reinforced Concrete Buildings.” Buildings 7 (3): 66. https://doi.org/10.3390/buildings7030066.
- Ranjbar Parvane, R., and N. Hosein. 2020. “Probabilistic Evaluation of Seismic Resilience for Typical Vital Buildings in Terms of Vulnerability Curves.” Structures 23:314–323. https://doi.org/10.1016/j.istruc.2019.10.017.
- Rooshenas, A. 2022. “Investigating the Effects of Masonry Infill Panels on High-Rise Structures.” Structures 35:106–111. https://doi.org/10.1016/j.istruc.2021.10.077.
- SAP2000. 2014. V. 14. Berkeley, CA, USA:Computers and Structures.
- SAP V22. 2000. Integrated Software for Structural Analysis and Design. Computers and Structures. Berkley, CA, USA: Inc.
- Sathurshan, M., J. Thamboo, C. Mallikarachchi, and K. Wijesundara 2023. “Seismic Fragility of Lightly Reinforced Concrete School Building Typologies with Different Masonry Infill Configurations.” Structures 47:1710–1728. https://doi.org/10.1016/j.istruc.2022.12.014.
- Shendkar, M.R., D.P.N. Kontoni, E., Işık, S. Mandal, P.R. Maiti, and E. Harirchian 2022. “Influence of Masonry Infill on Seismic Design Factors of Reinforced-Concrete Buildings.” Shock and Vibration, Article ID 5521162. https://doi.org/10.1155/2022/5521162.
- Singh, Y., D. Lang, J. Siva Ranga Prasad, and R. Deoliya. 2013. “An Analytical Study on the Seismic Vulnerability of Masonry Buildings in India.” Journal of Earthquake Engineering 17 (3): 399–422. https://doi.org/10.1080/13632469.2012.746210.
- Yuen, Y. P., and J. S. Kuang. 2015. “Nonlinear Seismic Responses and Lateral Force Transfer Mechanisms of RC Frames with Different Infill Configurations.” Engineering Structures 91:125–140. https://doi.org/10.1016/j.engstruct.2015.02.031.
- Zamani-Ahari, G., and K. Yamaguchi. 2022. “Experimental Investigation on Cyclic In-Plane Behavior of URM Walls Retrofitted with AFRP.” Case Studies in Construction Materials 17:e01558. https://doi.org/10.1016/j.cscm.2022.e01558.