
ABSTRACT
Massive traffic congestion is one of the many challenges faced by Jakarta as the capital city of Indonesia with the largest metropolitan area. The overarching goal of the study is to explore a combination of global navigation satellite system (GNSS) with vehicle-based measuring devices to precisely map the impact of the urban traffic on the CO2 emissions in Jakarta city. The research objectives include to examine and understand the CO2 intensity in major cities using state-of-the-art research strategies to correctly map the impact of the urban traffic patterns on urban areas and overall well-being of people in these locations. Urban traffic was studied in selected major urban transportation routes that were selected using PPK GNSS and the HT 2000 environmental sensor. This study reports that there is indeed a correlation between urban traffic and air pollution. The study noted that the macro and micro parameters of urban development and traffic policies are influencing the slowing down of traffic in city centers. The research outcomes could serve as a framework for designing the conceptual smart measure and tool of transportation carbon pricing in achieving the more sustainable transportation sector of Indonesia.
1. Introduction
Urbanization is global, with 68% of the world population projected to live in urban areas by 2050 (World Urbanization Prospects: The 2018 Revision Citation2019). Indonesia is the largest economy in Southeast Asia, the world’s fourth most populous nation, and the 10th largest economy (World Bank Citation2021). Jakarta, as the capital city of Indonesia, is no stranger to urbanization, having increased its population by over ten millions since independence in 1945. Jakarta contributes around 20% to Indonesia’s GDP, but other cities such as Medan, Bandung, and Surabaya are growing faster (Oberman et al. Citation2012). Furthermore, unlike most Southeast Asian nations, the Indonesian economy is driven by domestic consumption rather than export. Lifestyle choices are a much bigger determinant in greenhouse gas (GHG) emissions in consumption economies, and urban planning with Jakarta as a model would pave the way for other Indonesian cities.
Despite its economic contribution, the Jakarta metropolitan area was ranked as the most polluted city globally in August 2019 (Atika Citation2019) and one of the worst in Asia (Kusuma et al. Citation2019). Massive traffic congestion is one of the many challenges faced by Jakarta and it is estimated that the potential losses from traffic congestion is as high as 65 trillion rupiahs in 2020 (Harmadi Citation2006) based on the operational cost and travel time. If environmental damage and health implications were factored in, losses could be much higher. In addition to GHG emissions, traffic congestion in cities (Cepeliauskaite et al. Citation2021) also contributes to thermal pollution and an unhealthy environment. The transport sector is a significant contributor to greenhouse gas emissions as it accounted for 28% of the energy demand and 23% of energy-related CO2 emissions in 2014 (Masson-Delmotte et al. Citation2018). It is well known that the health of urban populations, especially in large megacities, are in many ways shaped by the design of urban environments, which influences lifestyle (The Directorate General of Pollution and Environmental Damage Control, Indo-nesian Ministry of Environment and Forestry Citation2020).
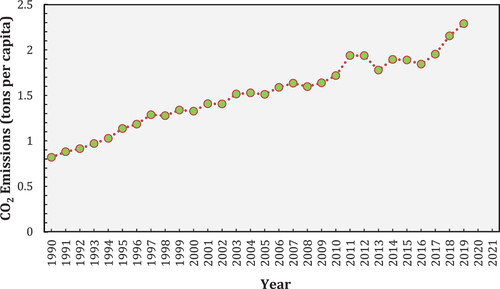
Air pollution is mainly anthropogenic, with road traffic being the most crucial source in cities, given its proximity to urban populations (The Directorate General of Pollution and Environmental Damage Control, Indo-nesian Ministry of Environment and Forestry Citation2020). Hence, reducing road traffic via good design and policies that mitigate exposure and reduce air pollution is of utmost importance. Air pollution is often measured by CO2 intensity airborne particulate matter PM2.5. Carbon emission has significantly increased globally and this is also the trend in Indonesia (). The annual mean PM2.5 measured by Jakarta’s monitoring stations from 2001 to 2019 showed intensities ranging between 43 and 51 µg/m3 (The Directorate General of Pollution and Environmental Damage Control, Indo-nesian Ministry of Environment and Forestry Citation2020). During the years of the COVID-19 pandemic in 2020 and 2021, PM2.5 and CO2 measurement dropped as reflected by the restricted mobility. This was also reflected by crude oil prices plunging below zero for a period of time and it shows that reducing traffic can reduce particulates and GHG emissions.
Figure 1. The increase of CO2 emissions of Indonesia (metric tons per capita) from 1990 to 2019 (The World Bank Climate Watch Citation2020).
Despite the reduction during years 2020 and 2021 that were affected by restricted mobility, the average PM 2.5 was 39.34 (). This is still much higher than the WHO global standard of PM2.5 (10 µg/m3 annual mean) and Indonesian standard (15 µg/m3 annual mean). In 2020, the PM2.5 air pollution contributed by sector was 46% (transportation) and 43% (industrial) (Environment Agency of DKI Jakarta and Vital Strategies Citation2019). This means that reducing traffic plays a significant but not complete role in mitigating air particulates.
Table 1. The change of air quality level (counted in PM and CO concentration) in Jakarta before and during the pandemic covid-19 (CitationBPS).
As a result, the annual rate of private vehicle ownership rose by 2.5% from 2017 to 2019 (BPS Citation2020). Jakarta’s Metropolitan Area consumes around 34 million litres of daily fuel for private vehicles which produces the high sulfur and carbon (average of 500 ppm per vehicle) (Vital Strategies Citationn.d.). Private vehicles are seen as insufficient modes of transport (Fullerton, Gan, and Hattori Citation2004; Rachman and Barus Citation2019) due to the high energy demand, traffic volume issue and traffic congestion (Environment Agency of DKI Jakarta and Vital Strategies Citation2019). The increase of Jakarta’s carbon emission due to urban development including the transportation sector was reported to be significant from 2009 to 2019 (Hidayah, Yola, and Irwansyah Citation2022; Ulfiasari and Yola Citation2022).
The urban traffic congestion is continuing to be a serious issue in Jakarta as the capital city of Indonesia is growing as a developing metropolitan area. The rapid increase of private vehicles is not significantly followed by the development of road infrastructure (Asvial, Pandoyo, and Arifin Citation2018). Jakarta was ranked as the top 10 most congested cities in the word from 2017 to 2019 (TomTom Traffic Index Report Citation2022). A study (Citation2019) reported that the Jakarta traffic doubled from 1985 to 2000 and predicted a loss around 65 trillion rupiah in 2020. Jakarta’s traffic congestion is mainly caused by the 3.2 million waves of commuters from all over buffer zones, 63.3 % of them were motorcyclists and 26.9% public transportation users (World Air Quality Citation2018). Due to the traffic congestion problem, the urban dwellers use more motorcycles on roads for faster mobility (Asvial, Pandoyo, and Arifin Citation2018). Jakarta was ranked as 10th most polluted capital city (TEMPO.CO Citation2019). It was reported that the poor city pollution was contributed by the 3.5 million cars and 14 million motorcycles passing the city daily (Barth and Boriboonsomsin Citation2010). The strong correlation between the traffic congestion and the air pollution was emphasized (Kikuchi and Hayashi Citation2020; Yudhistira, Kusumaatmadja, and Hidayat Citation2019), the reduction of vehicle speed results in the increase of intensity of CO2 emission.
Therefore, the need for comprehensive studies on this area is urged. Some studies were conducted to review Jakarta’s inefficient traffic management and policies (Dasgupta, Lall, and Wheeler Citation2021; Hadipoor et al. Citation2021). This study shows that there is an urgent need for more holistic studies investigating the correlation of both urban traffic congestion and urban air pollution. A study (Afifa Arshad et al. Citation2024) pointed out the correlation between the traffic congestion with other relevant variables such as air pollution. Studies also highlighted the correlation between the CO2 emissions and its’ contribution to the air pollution (Yoro and Daramola Citation2020) and greenhouse gasses as the main source of global warming (Li et al. Citation2019; Lin et al. Citation2023; Nunes Citation2023). In this context, the CO2 emissions linked with the fossil energy consumption (Domon et al. Citation2022). Therefore, in this study, the CO2 emission were investigated by using the current prototype technology of air pollution sensor. However, the Particular Matter (PM) variable will be measured for the future study [51].
Similarly, a spatial approach to studying traffic and CO2 emissions can help guide land-use regulations. Urban policy related to land use would also affect energy demand for heating and cooling, traffic congestion, and energy use in transport (deSouza et al. Citation2020). All of these variables are determined by the spatial distribution of residents. Changing spatial distribution can reduce commuting distance, congestion level, and household energy consumption from lighting, cooling, and heating. Specifically, the large scale of social mobility restriction during the pandemic was also affecting the level of air pollution (Bulot et al. Citation2019).
Air quality monitoring is important for cities to develop management plans (Pardamean et al. Citation2021); therefore, studies on field work air quality monitoring by using sensors were conducted (Li et al. Citation2019). Ground-based sensors offer a cost-effective solution but their main limitation is the difficulty to spatially log measurements in real-time. The lack of real-time spatial measurements also prevents the study of air quality on different times of the day and different days of the week. This can be circumvented using the global navigation satellite system (GNSS) coupled with real-time vehicle-based measurements at selected time intervals.
The present study aims to combine global navigation satellite system GNSS with vehicle-based measurements of CO2 accurately map these measurements in real-time. Ground based measurement of CO2 would be measured using the HT 2000 sensors. Such a system allows the rapid identification of air pollution hotspots which can be correlated with traffic congestion. Several such hotspots have been identified in this study demonstrating that the system can be deployed in Jakarta and other Indonesian cities at a reasonable cost with minimal infrastructure investments.
The route chosen for study was between two major transportation hubs in the city, namely Kota Jakarta terminal and Blok M MRT station. Traffic congestion was especially severe around Semanggi Interchange which comprises a huge roundabout and clover leaf design. Another hotspot of note along the studied route are the traditional market and commercial zones around the Kota Tua area. Such findings would greatly help Jakarta’s city planning given that this study is a collaboration between Japanese researchers and the local authorities.
This is a cross-sectional study in line with Indonesia’s effort to reduce GHG emissions. It would leverage on the Post-Processed Kinematic Global Navigation Satellite System (PPK-GNSS) and MADOCA-PPP (Precise Point Positioning) to provide a spatially accurate and precise navigation of traffic and pollution in Jakarta (Yola and Siong Citation2017). The application of technology innovation was emphasized as an effective and accurate tool to conduct the complex urban study (Paziewski and Crespi Citation2020). The GNSS application is an innovative navigation approach with high precision and accuracy (Schaefer and Pearson Citation2021; Zhang et al. Citation2021), and it is seen as a reliable approach for the integrated and multi variable urban study (Chidsin, Gu, and Goncharenko Citation2021) and transportation study (Purwoko and Yola Citation2022). The study would spatially consider correlating urban traffic congestion measured using the GNSS with air pollution measured using strategically placed CO2 sensors. The findings of this eco-spatial study would be useful for city planners for placing new infrastructure and contribute to a conceptual framework for field measurement of GHG from motorized vehicles to support the newly implemented carbon tax (Macet Gila Citation2015). This would be the first cost-effective solution for accurately measuring the air pollution at traffic congestion hotspots in Jakarta. Because it leverages existing infrastructure, the system can also be applied in other Indonesian cities.
2. Materials and methods
This study conducted an urban traffic navigation and field environmental investigation to map the distribution of urban issues on traffic congestion and air pollution in one main route of Jakarta city (). Jakarta experiences multi-layer complex urban issues as it is a capital city, one of Asia’s largest metropolitan areas with 664 km2 of land and 10.56 million population in 2019 (Nanditho and Yola Citation2022). The uncontrolled development, urban sprawl and as the densest province, Jakarta suffers from the massive traffic congestion (Yola et al. Citation2024). The road serves more than 20 million vehicles every day, and in 2015 the average vehicle speed reached 5 km/h during the peak hours [47]. The traffic congestion mainly occurs within the Central Business District (CBD) area and along the access that connects the city to the surrounding area. Therefore, this study investigates Jakarta’s major transportation route from the city center to the buffer zone, as also investigated in earlier urban traffic study [48].
Figure 2. Jakarta city, the location of study (left) and the investigated route (right).
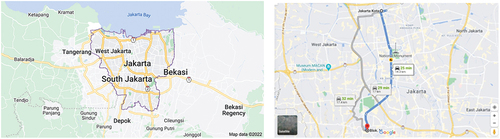
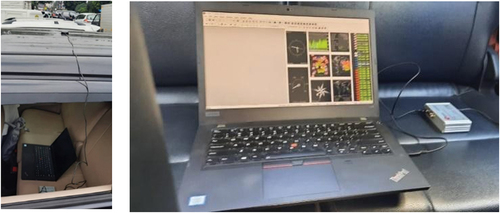
Private cars were used to investigate the origin of destination routes in Jakarta; Blok M Station (located in the city center) to the buffer zone Jakarta Kota Station (15.4 km). The field data was collected for two weekdays (Monday and Friday) and one weekend (Saturday) at busy hours; morning (09.00–11.00) and noon (13.00–15.00). The study was conducted during two timelines of the large-scale social mobility restriction of pandemic; September–November 2021 (named as timeline 1 in this paper) and March–April 2022 (named as Timeline 2 in this paper). This study conducted an urban traffic navigation and field environmental investigation to map the distribution of urban issues on traffic congestion and air pollution in Jakarta. This study used the PPK GNSS application (Post-Processed Kinematic Global Navigation Satellite System) and MADOCA-PPP (Precise Point Positioning) to investigate urban traffic in the study area. It used the rover receiver of EVK-M8T U-Blox Evaluation Kit set on the rooftop of the vehicle (), which connected to the mobile computer system (specification of Intel(R), Core (TM) i7-8565 U, [email protected] ~ 2.0 GHz, Windows 10 Home Single 64-bit) with the U-Center 20.10 installed.
Figure 3. The setting of GNSS EVK-M8T U-Blox receiver connected to the mobile computer system in the navigating vehicle.
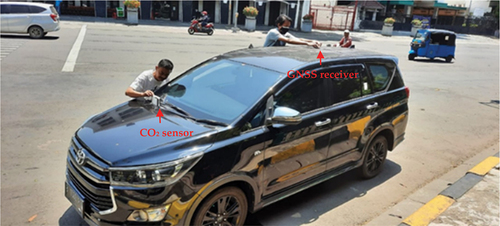
The pollution data were recorded separately using the portable digital HT 2000 3.5” LCE monitor detector. It analyzed the carbon dioxide level in the 9999-ppm range with the 12,700 data logging memory and the accuracy: ±50ppm ±5% reading (0~2000). The pollution sensor was set in the front cabin of the vehicle, with the LCE monitor facing the driver (). The pollution sensor was operating independently without connection to the mobile system, as the recorded data was saved in the sensor’s internal memory.
Figure 4. The installation process of GNSS receiver and HT 2000 CO2 sensor in the navigating vehicle.
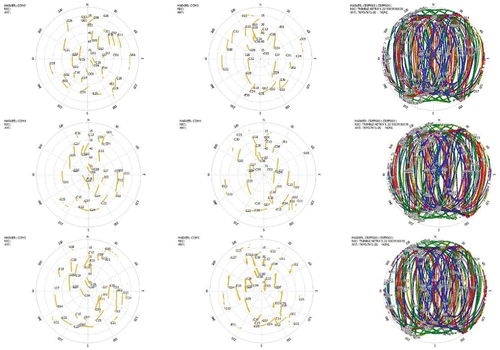
The GNSS rover receiver recorded the navigation data from origin to destination. Besides U-Center 20.10, Trimble NetR9 Server 5.22, the data collection used the system software of Convert to RINEX 3.1.4.0, RTKLIB 2.4.2, and RTKLIB 2.4.3. The base station receiver of Trimble NetR9 recorded the “T02” base station observation record as the correction data. The base station receiver of Trimble NetR9 was also used to download “P” navigation data. Converted RINEX 3.1.4.0 was used to convert the “T02” data for getting the “o” data. The RTKPOST 2.4.3 was run as the PPK (Post Processed Kinematic) method, with “obs” observation data from the rover, “o” observation data from the base station, and the “P” navigation data from the base station for a high precision result. For the analysis purpose, the “pos” output data was converted to “KML” data to be layered in Google Earth 7.3.4 mapping graphic. The configuration of satellites position during the field navigation investigation were presented as on the Rover Skyplot of Observation data. The satellite plotting was clear during the field data observation, so the navigation process went smoothly.
Figure 5. Rover skyplot of observation data on Monday (top) Friday (middle) and Saturday (down).
The vehicle speed data also derived from the vehicle movement navigation, with the unit of km/h, while the carbon dioxide (CO2) was recorded with the unit of in parts-per-million (PPM). The navigation and pollution variables were analyzed by extracting the time-navigation coordinates intersecting data from both GNSS receiver and HT 2000 sensor. The spatial analysis was performed through the Google Earth 7.3.4 mapping of KML, vehicle speed and CO2 data which then continued with the linear regression statistical analysis of impact of the traffic on the pollution intensity.
3. Results
This paper presents the navigation spatial study by using the mapping and statistical analysis. The traffic study elaborates the urban traffic situation along the investigated routes. The mapping aims to spatially present the vehicle speed, and CO2 intensity on the synchronized coordinate plotting to perform the precise spatial data analysis. The mapping was grouped according to the investigated transportation routes and data collection timeline, while the statistical data summarized the GNSS KML data plotting, vehicle speed, and CO2 intensity.
3.1. Urban traffic analysis
Overall, the navigation recorded a range of vehicle speeds along the investigated road, and the navigation signals were also recorded varied according to the physical environment along the road (). The KML data presented the fixed and floated coordinates of the vehicle movement. Mostly, the disrupted signals were caused by vertical obstruction or covered areas such as high-rise buildings, dense trees, and underpass due to small sky view visible exposure. The traffic congestions were spotted along the traditional market, traffic light, institutional area, and roundabout. The traffic policies to control the traffic were not applied due to the pandemic lockdown policies; therefore, it did not affect the traffic significantly. A different outcome may have been obtained if there was no lockdown because more activities would have occurred within the study area.
Figure 6. The navigation along the investigated road showing the signal disruption in certain area, presented as green and yellow dots of fixed and floated coordinates in Google earth map.
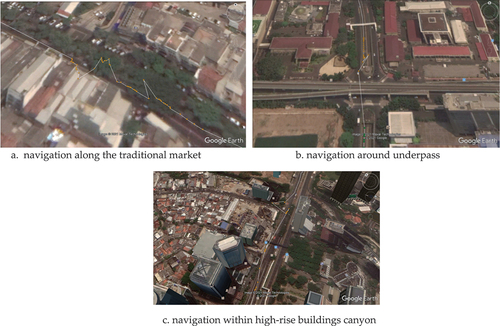
Figure 7. The navigation along the investigated road showing the undisrupted signal in certain area, presented as green and yellow dots of fixed and floated coordinates in Google earth map.
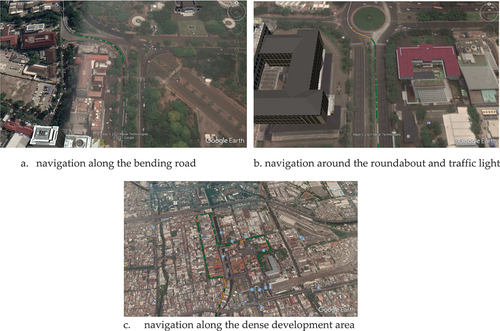
On the one hand, the study also noted frequent irregular navigation patterns in areas where there are more vegetations and buffer zones to the built-up zones. The investigation revealed more vegetation and additional buffer zones in these areas are likely to mitigate the impact of these environmental variables in the study area. However, regular or linear navigation patterns were observed in areas with less vegetation and buffer zones to the built-up areas. For example, more linear patterns were observed in the areas with dense trees and no built-up zones near the area. Also, linear navigation patterns are reported around underpasses and areas with high-rise buildings.
The study also noted more regular and linear patterns along the bending roads, roundabouts, and traffic lights. Common features to these noted areas include linear less vegetation and buffer zones to the built-up areas. The research further confirms air pollutions are likely to increase in urban areas with increasing traffic and vehicular activities and less mitigation interventions to reduce traffic congestion and carbon emissions and in our environment.
3.2. Spatial distribution of urban traffic and CO2 intensity
The distribution mapping of traffic navigation and pollution data were shown with a gap from one to another (). The vehicle movements were recorded at almost an average speed; however, the movements slowed down in some locations along the route. The distribution of pollution reported varies along the road sections and between weekdays and weekends. The CO2 intensity tends to be typically moderate in Timeline 1 but unhealthier in Timeline 2. Timeline 2 experiences less urban traffic as the social mobility restriction levels were reduced.
Figure 8. Mapping of vehicle speed and CO2 on (A) Monday, (B) Friday, and (C) Saturday morning in timeline 1.
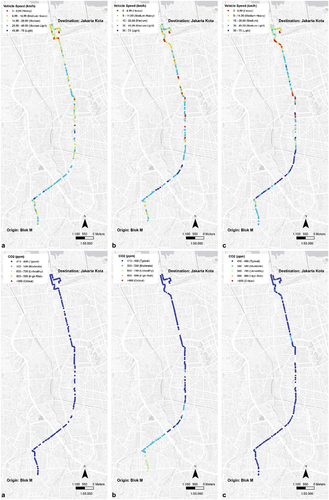
Figure 9. Mapping of vehicle speed and CO2 on (A) Monday, (B) Friday, and (C) Saturday morning in timeline 2.
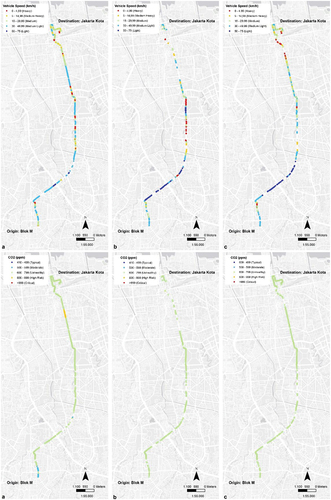
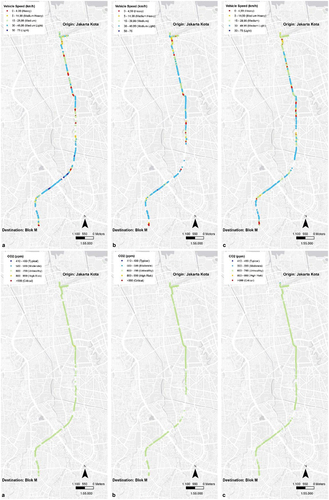
Figure 10. Mapping of vehicle speed and CO2 on (A) Monday, (B) Friday, and (C) Saturday noon in timeline 1.
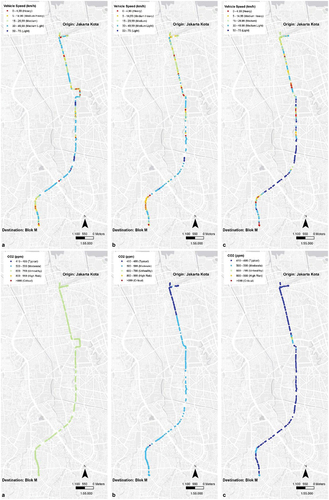
Figure 11. Mapping of vehicle speed and CO2 on (A) Monday, (B) Friday, and (C) Saturday noon in timeline 2.
provided great insight into the research outcomes. Firstly, the study observed heavy vehicle speed near the destination (Jakarta Kota) in timeline 1 on weekdays and weekends (). Heavy to moderate vehicle speed activities were also noted as commuters travel close to the metropolitan area including the major intersections along the navigation patterns. More frequent heavy vehicle speed activities were noted at the beginning of the trip (origin) during weekdays than the speed observed during weekends. As expected, higher to light vehicle speed was reported during weekends across the entire navigation than weekdays, possibly due to less activities at some destinations along the route.
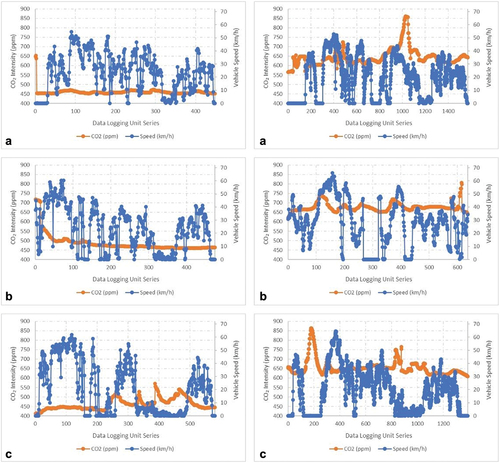
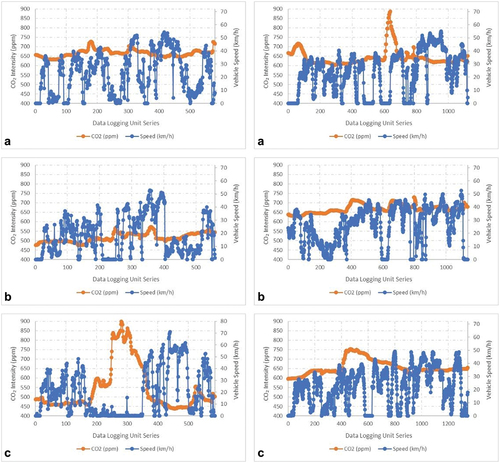
Figure 12. Vehicle speed and CO2 Comparison on (a) Monday, (b) Friday, and (c) Saturday morning in timeline 1 (left) and timeline 2 (right).
Additionally, typical CO2 intensity (410–490 ppm) were observed near the destination during weekdays and weekends in Timeline 1. On the one hand, on Mondays and Saturdays, typical CO2 intensity dominate the navigation pattern for the entire duration of the trip. On the other hand, moderate to higher risk of CO2 intensity were reported on Friday. This finding may be as a result of significant activities that occur in a country like Indonesia on Fridays. The result revealed there are more vehicular activities and traffic congestions with release of CO2 emissions and other air pollutants along the route on Fridays. The research shows the possibility of various activities that contribute to higher air pollution in the study area.
In timeline 2 (), heavy vehicle speed tends to reduce from the beginning of the weekdays to the end of the week (i.e., from Monday to Saturday). For instance, a noticeable light vehicle speed was reported on Friday and Saturday and not on Monday. Equally, CO2 intensity were “unhealthy” for most parts of the navigation route on Monday, Friday, and Saturday. “High-risk” to “critical” CO2 intensity were also noted on Monday. This study noted that the study area is prone to high levels of air pollution which may impact the overall well-being of the population in Jakarta metropolitan area.
revealed the results of the measurements conducted at noon in timeline 1 and timeline 2. The results, especially vehicle speeds followed a similar pattern with the results outlined in . However, some striking features are also observed. For instance, while CO2 intensity ranged from “typical” to “moderate” on Friday and Saturday in timeline 1 at noon, CO2 intensity were mostly “unhealthy” on Monday during the same period. Similarly, CO2 intensity were “unhealthy” on Monday, Friday, and Saturday at noon as described in timeline 2. The results showed while similar variations are noted in vehicle speeds in both timelines, significant variations are noticed in CO2 intensity between the timelines.
3.3. Impact of Urban Traffic on the CO2 intensity
This study presents the statistical data to present the relationship between the urban traffic (vehicle speed) and the higher the CO2 intensity. show relationship between the variables. In timeline 1 and timeline 2 during morning on Monday, Friday and Saturday (), significant variations occurred between vehicle speed in both cases. In timeline 1, changes between CO2 intensity are not significant and they were within a range of 150 ppm except at the beginning of the monitoring on Monday and Friday. In timeline 2 during morning, considerable changes between CO2 intensity were observed. For instance, on Monday morning, a range of approximately 300 ppm was noted in CO2 intensity. A similar range in CO2 intensity was noted in the morning on Saturdays. The results showed a change in vehicular speed has a noticeable impact on CO2 intensity in timeline 2 than timeline 1 during morning.
Figure 13. Vehicle speed and CO2 comparison on (a) Monday, (b) Friday, and (c) Saturday noon in timeline 1 (left) and timeline 2 (right).
In , changes in vehicular speed also influence CO2 intensity at noon in both timelines. In Timeline 1 at noon on Saturdays, the study observed the highest range in CO2 intensity with a range of 400 ppm. On Monday at noon (timeline 2), the range between CO2 intensity was about 300 ppm. At noon in timeline 1 on Monday and Friday, as well as at noon in timeline 2 on Friday and Saturday, CO2 intensity were within a similar range. The study further reveals vehicle speed activities could influence CO2 intensity depending on the weekdays and time of the day.
present the summary of the statistical data discussed in this study. The data presented the significant gap between the data collection in two investigated timelines on the two variables of vehicle speed and CO2 intensity, and duration of trip. The tables present the mean, minimum, and maximum values for each of the parameters measured during the field investigation. The tables also highlight the number of plotting (i.e., number of data plotting for investigated trips by the GNSS receiver) and the duration of each of the experiments. In both timelines, the results showed higher mean CO2 intensity and vehicle speed are reported on Fridays than those values reported on Mondays and Saturdays.
Table 2. Summary of statistical traffic navigation and pollution data in timeline 1.
Table 3. Summary of statistical traffic navigation and pollution data in timeline 2.
Across various experiments, the highest mean CO2 intensity (697.24 ppm) was noted on Monday noon in timeline 1, while the highest mean vehicle speed (22.97 km/h) was observed on Friday noon in timeline 2. The data further revealed potential high traffic congestion and activities that occur in the study area on weekdays, especially on Mondays and Fridays. Also, a maximum vehicle speed of 74.56 km/h was reported on Saturday noon in timeline 1. While a maximum CO2 intensity of 1838 ppm was observed on Saturday morning in timeline 2.
The study also conducted statistical tests to further understand correlations and relationships between the parameters (). In statistical analysis, CO2 is the dependent variable while vehicle speed is the predictor. The result of the model summary showed an R value of 0.031 with adjusted R square value of 0.001 (). The analysis also revealed significance exists between the variables as the p-value (0.000) is less than 0.05 (the alpha level). Also, the ANOVA result on F Statistic shows F value is 79.507 and it reaches significance with a p-value of 0.000 (). The result revealed there is a statistically noticeable difference between the means of different levels of the variables (i.e., vehicle speed and CO2). On coefficient statistic analysis to determine level of significance for the constant variable (CO2), the t value of 1161.322 and two-tailed p-value of 0.000 show the outcome is statistically significant and vice-versa for speed ().
Table 4. Model summary – CO2 and speed.
Table 5. ANOVA table – CO2 and speed.
Table 6. Coefficients – CO2 and speed.
The regression analysis indicates that a correlation exists between the variables, with a notably stronger relationship found between CO2 emissions and vehicle speed compared to the correlation between CO2 emissions and temperature. This is illustrated in . The stronger correlation between CO2 emissions and vehicle speed can be interpreted to suggest that the longer the trip durations, the higher the CO2 intensity along the traffic route. The result follows a similar pattern when compared to the historical pattern (Kikuchi and Hayashi Citation2020) highlighting correlations between the variables. This outcome confirms the validity of the study.
Figure 14. Linear chart of correlation between vehicle speed and CO2 intensity.
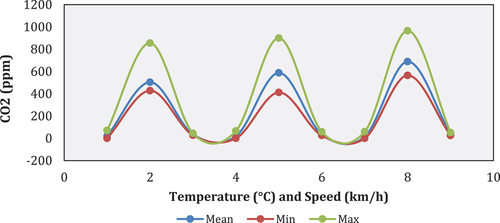
Figure 15. Minimum, mean, and maximum values of the variables.
Conversely, the weak correlation observed between CO2 emissions and recorded temperature suggests that further evaluation is necessary to understand this relationship better (). It is important to note that some variations may occur if the study considered an extended monitoring of the variables and was not conducted during the lockdown due the COVID-19 pandemic. Additionally, it is possible the study could obtain variations in the outcome if it examined different microclimates and geometrics along the navigation paths within the study area as noted in existing research [49, 50]. Future work will consider investigations under various scenarios highlighted in the current study.
4. Discussion
The results presented the mapping of urban traffic; the spatial navigation showed the congestion occurred in the busy route of business and commercial districts of Jakarta city. The traffic was recorded in some locations due to some land-use activities such as business and commercial areas. Besides the land use as the macro variable of urban development, the physical features and the imposed traffic policy were among the influencing factors of the volume of the traffic congestion. The pandemic social restriction policy and the “odd-even” vehicle plate number traffic restriction were the reasons for the slowing traffic in Jakarta during the investigation time.
The findings of the research using various statistical approaches, analyses, and charts provided great insight into the pattern of air pollution and vehicular activities along the navigation path in the study location. The results show the highest mean CO2 concentration was observed during noon on Monday in timeline 1, and the highest mean vehicle speed was reported during noon on Friday in timeline 2. The study. The research outcome also highlights there is a statistically significant difference between the means of different levels of CO2 and vehicle speed. Considering the mean values of the variables obtained in timeline 1 and timeline 2, the study revealed higher mean CO2 concentration and vehicle speed are noted on Fridays than the values observed on Mondays and Saturdays.
The study also evaluated the navigation timelines during the weekdays and weekends and found typical CO2 concentration near the destination. Typical CO2 concentration was also reported along the navigation path for the duration of the trip, while moderate to higher risk of CO2 concentration were noted on Friday. The study noted CO2 concentrations are significantly higher on Fridays than any other days due to various activities in the study location. Overall, the research noted that as the vehicular activities and vehicle speed tend to increase, CO2 concentration also increases. The findings show that traffic congestion and other similar activities contribute immensely to air pollution in Jakarta.
The investigation time was pinpointed as the traffic influencing factors, as the navigation data showed the gap between the weekday and weekend. Monday indicated the heavy traffic; however, Saturday was also jammed due to the commercial activities along the main road. In addition to that, the main city roads were also occupied by a developing number of cyclists during the pandemic. The pollution levels were recorded high, especially within the city center with the business districts.
Though there were external variables to count in analyzing the results of this study, the pattern of each investigated variable was quantitatively presented as the causal factors of Jakarta urban traffic, in this context, correlated with the urban development and traffic policies. In contrast, the causal effects of the urban traffic were recorded correlated with the air pollution distribution.
This finding is an essential start for a preliminary study to prepare the conceptual framework of the field measurements of carbon pricing in the transportation sector. However, the holistic study is recommended to consider the major required variables, such as urban traffic/mobility, transport emissivity and energy demand. This study used a separated navigation receiver and the pollution sensor, it is also highly recommended to develop a smart integrated technology to accommodate the study.
5. Conclusions
The investigation assesses the traffic navigation in Jakarta and the field environmental impact with respect to the congestion and the resulting air pollution. In particular, the varying navigation patterns within the study area and the impact of vehicle speed on the amount of CO2 emissions caused with the goal to provide a framework for national policy on traffic congestion and climate change mitigation. We applied eco-spatial techniques to evaluate the correlation between Jakarta’s urban traffic congestion and the air pollution using PPK GNSS application (Post-Processed Kinematic Global Navigation Satellite System) and MADOCA-PPP (Precise Point Positioning).
The research outcomes allow for the conclusion that varying navigation patterns were observed towards and within Jakarta during these periods. The study also noted noticeable changes in CO2 concentration and vehicle speed between weekdays and weekends in both timelines. Generally, people would expect typical or lower CO2 concentration and vehicle speed on weekends, the study further confirms that urban traffic congestion and other activities that pollute the environment occur on weekdays and weekends in the study location. The research thereby recommends policies that would mitigate the impact of these effects on both weekdays and weekends.
Additionally, the lack of integrated study on urban traffic with other influencing variables in the city area urgently seeks alternative solutions. Using the eco-spatial method, this study answers this need as it presents the impact of urban traffic on the measure of air pollution. The findings showed the urban traffic impacted the concentration of air pollution in the city, though it was not recorded as significant because the study was conducted during the pandemic where social mobility was restricted.
The PPK GNSS application provided the precise navigation data through the KML mapping and vehicle movement speed, and the HT 2000 was reliable to measure the CO2 intensity. However, this study recommends the future work on development of the integration and calibration of the GNSS receiver and the CO2 sensor.
The study also pinpointed that the macro and micro factors of urban development and traffic policies also influenced the slowing down of traffic in the city center. This study recommends the finding to be a framework for designing the conceptual smart measure and tool of transportation carbon pricing in achieving the more sustainable transportation sector of Indonesia.
Acknowledgements
This research was supported by Universitas Indonesia. We also appreciate the professional consultation and in kind equipment support on GNSS technology and application from Center for Spatial Information Science, The University of Tokyo, Japan. The authors, therefore, gratefully acknowledge the professional and technical support.
Disclosure statement
No potential conflict of interest was reported by the author(s).
Additional information
Funding
Notes on contributors
Lin Yola
Lin Yola is currently a Senior Lecturer with the School of Strategic and Global Studies, Universitas Indonesia, with a strong academic and professional background in urban, energy, and technology innovation. She is best known for her model of “Climatically Responsive Urban Configuration.” She is the Head of the Center for Spatial Data and Analysis, which mainly focuses on the simulation model and integrated eco-spatial GNSS technologies. Besides the significant cross-discipline studies, her projects and publications impose technology innovation as the strategic methodology in addressing global development issues.
Garrin Alif Nanditho
Garrin Alif Nanditho is the IT Executive Manager of the Center for Spatial Data and Analysis, SSGS Universitas Indonesia. He mainly manages and supervises GNSS activities in the Center for Spatial Data and Analysis (CSDA) research center at the School of Strategic and Global Studies, Universitas Indonesia. Garrin Alif Nnanditho is a senior GNSS expert and researcher on GNSS Post-Processed Kinematic (PPK) and PPP MADOCCA.
Timothy O. Adekunle
Timothy O. Adekunle currently serves as Associate Professor of Architecture and Interim Chair (Head) of the School of Architecture at the University of Utah, United States. He previously served as Director of Graduate Studies at the same school. He holds a Ph.D. in Architecture (specialization in sustainable architecture) from the University of Kent, UK. He obtained a master’s degree in architecture from the University of Nottingham, UK. Adekunle also holds a BArch degree in architecture. He is a recipient of many awards and a member of many professional organizations, including the Chartered Institute of Building (CIOB). He co-edited a book and co-authored a monograph. Additionally, Dr. Adekunle has published many peer-reviewed articles in top-ranking journals and presented his work at highly preferred international conferences.
Olutobi G. Ayegbusi
Olutobi G. Ayegbusi Received Ph.D. in Architecture from Universiti Teknologi Malaysia (UTM). He is currently working as Lecturer in the Department of Architecture, Faculty of Built Environment at Linton University College (LUC), Malaysia. He is also in Linton University College Research Management team as Assistant Director of the unit. Currently working on the application of digital twin in the built environment to reduce greenhouse gas and ensure sustainability.
Muhamad Erza Aminanto
Muhamad Erza Aminanto (Member, IEEE) received the Ph.D. degree from the School of Computing, Korea Advanced Institute of Science and Technology (KAIST), South Korea, in 2018. He is currently a Lecturer with the University of Indonesia (UI) and a Cooperative Visiting Researcher at the Cybersecurity Research Institute, National Institute of Information and Communications Technology (NICT), Japan. His current research interests include machinelearning, IDS, and cybersecurity.
Eric Wei Chiang Chan
Eric Chan Wei Chiang, Associate Professor at UCSI University, Kuala Lumpur, holds a Ph.D. in Natural Product Chemistry from Monash University. Dr. Chan has over 111 SCOPUS-indexed publications, 3,076 citations, and a h-index of 25. Ranked among Stanford’s Top 2% Scientists in Medicinal and Biomolecular Chemistry (2019-2023), he has earned awards in green chemistry, including recognition from Elsevier and ITEX. His research focuses on bioprospecting, waste conversion, and green chemistry.
Dinesh Manandhar
Dinesh Manandhar is an appointed Project Associate Professor in Center for Spatial Information Science, the University of Tokyo (CSIS UT) since 2016. He is an expert in Global Navigation Satellite System (GNSS) with the area of GNSS signal authentication and GNSS low-cost precision.
References
- Afifa Arshad, K., N. Ashraf, M. Hussain, M. Saleem, and M. Z. Saleem. 2024. “Air Pollution and Climate Change as Grand Challenges to Sustainability.” Science of the Total Environment 928:172370. https://doi.org/10.1016/j.scitotenv.2024.172370.
- Asvial, M., M. F. G. Pandoyo and A. S. Arifin. 2018. “Internet of Things Solution for Motorcycle Riders to Overcome Traffic Jam in Jakarta Using EbkSP.” 2018 International Conference on Information and Communication Technology Convergence (ICTC), 636–638. https://doi.org/10.1109/ICTC.2018.8539395.
- Atika, S. 2019. “Airvisual: Jakarta Declared world’s Most Polluted City on Thursday Afternoon.” The Jakarta Post. Accessed August 8. https://www.thejakartapost.com/news/2019/08/08/airvisual-jakarta-declared-worlds-most-polluted-city-on-thursday-afternoon.html.
- Barth, M., and K. Boriboonsomsin. 2010. “Real-World Carbon Dioxide Impacts of Traffic Congestion.” Transportation Research Record 2058 (1): 163–171. https://doi.org/10.3141/2058-20.
- BPS (Badan Pusat Statistik). “Statistical Yearbook of Indonesia.” 2020. 2020. https://www.bps.go.id/publication/2020/04/29/e9011b3155d45d70823c141f/statistik-indonesia-2020.html.
- BPS (Badan Pusat Statistik Provinsi Dki Jakarta). 2020. Statistics of DKI Jakarta Province.
- 2019. “BPS Statistik Komuter Jabodetabek: Hasil Survey Komuter Jabodetabek.” https://www.bps.go.id/publication/2019/12/04/eab87d14d99459f4016bb057/statistik-komuter-jabodetabek-2019.html.
- Bulot, F. M. J., S. J. Johnston, P. J. Basford, N. H. C. Easton, M. Apetroaie-Cristea, G. L. Foster, A. K. R. Morris, S. J. Cox, and M. Loxham. 2019. “Long-Term Field Comparison of Multiple Low-Cost Particulate Matter Sensors in an Outdoor Urban Environment.” Scientific Reports 9 (1): 1–13. https://doi.org/10.1038/s41598-019-43716-3.
- Cepeliauskaite, G., B. Keppner, Z. Simkute, Z. Stasiskiene, L. Leuser, I. Kalnina, N. Kotovica, Š. J. Andin, and M. Muiste. 2021. “Smart-Mobility Services for Climate Mitigation in Urban Areas: Case Studies of Baltic Countries and Germany.” Sustainability 13:4127. https://doi.org/10.3390/su13084127.
- Chidsin, W., Y. Gu, and I. Goncharenko. 2021. “AR-Based Navigation Using RGB-D Camera and Hybrid Map.” Sustainability 13 (10): 5585. https://doi.org/10.3390/su13105585.
- Dasgupta, S., S. Lall, and D. Wheeler. 2021. “Spatiotemporal Analysis of Traffic Congestion, Air Pollution, and Exposure Vulnerability in Tanzania.” Science of the Total Environment 778:147114. https://doi.org/10.1016/j.scitotenv.2021.147114.
- deSouza, P., A. Anjomshoaa, F. Duarte, R. Kahn, P. Kumar, and C. Ratti. 2020. “Air Quality Monitoring Using Mobile Low-Cost Sensors Mounted on Trash-Trucks: Methods Development and Lessons Learned.” Sustainable Cities Soc 60 (May): 102239. https://doi.org/10.1016/j.scs.2020.102239.
- The Directorate General of Pollution and Environmental Damage Control, Indo-nesian Ministry of Environment and Forestry. 2020.
- Domon, S., M. Hirota, T. Kono, S. Managi, and Y. Matsuki. 2022. “The Long-Run Effects of Congestion Tolls, Carbon Tax, and Land Use Regulations on Urban CO2 Emissions.” Regional Science and Urban Economics 92:103750. https://doi.org/10.1016/j.regsciurbeco.2021.103750.
- Environment Agency of DKI Jakarta and Vital Strategies. 2019. “Toward Cleaner Air Jakarta.” Environment Agency of DKI Jakarta, Vital Strategies, 1–56. https://www.vitalstrategies.org/wp-content/uploads/Menuju-Udara-Bersih-Jakarta.pdf.
- Fullerton, D., L. Gan, and M. Hattori. 2004. “A Model to Evaluate Vehicle Emission Incentive Policies in Japan.” http://www.env.go.jp/policy/.
- Hadipoor, M., F. Keivanimehr, A. A. Baghban, M. R. Ganjali, and S. Habibzadeh. 2021. “Carbon Dioxide as a Main Source of Air Pollution: Prospective and Current Trends to Control.” In Elsevier eBooks, 623–688. https://doi.org/10.1016/b978-0-12-820042-1.00004-3.
- Harmadi, S. H. 2006. Megapolitan in Economic Perspective: Megapolitan in Multi Perspective, Faculty of Social and Political Science. The Seminar of Megapolitan in Multiperspective Discussion, FISIP University of Indonesia.
- Hidayah, A. F., L. Yola, and E. Irwansyah. 2022. “Identification of Public Open Green Space (RTH) and the Needs for Funding Alternative in DKI Jakarta.” Lecture Notes in Civil Engineering 161:211–217. https://doi.org/10.1007/978-981-16-2329-5_23.
- Kikuchi, T., and S. Hayashi. 2020. Policy Report 2020: Traffic Congestion in Jakarta and the Japanese Experience of Transit Oriented Development. Singapore: Nanyang Technological University.
- Kusuma, W. L., W. Chih-Da, Z. Yu-Ting, H. H. Hapsari, and J. L. Muhamad. 2019. “PM2.5 Pollutant in Asia—A Comparison of Metropolis Cities in Indonesia and Taiwan.” International Journal of Environmental Research Public Health 16 (24): 4924. https://doi.org/10.3390/ijerph16244924.
- Li, W., R. Long, H. Chen, M. Yang, F. Chen, X. Zheng, and C. Li. 2019. “Would Personal Carbon Trading Enhance Individual Adopting Intention of Battery Electric Vehicles More Effectively Than a Carbon Tax?” Resources, Conservation & Recycling 149:638–645. https://doi.org/10.1016/j.resconrec.2019.06.035.
- Lin, X., R. Yang, W. Zhang, N. Zeng, Y. Zhao, G. Wang, T. Li, and Q. Cai. 2023. “An Integrated View of Correlated Emissions of Greenhouse Gases and Air Pollutants in China.” Carbon Balance Manage 18 (1). https://doi.org/10.1186/s13021-023-00229-x.
- Macet Gila, J. 2015. “Jarak 5 Km Butuh Waktu 1 Jam Tempo.co.” Accessed June 5, 2015. https://metro.tempo.co/read/672310/jakarta-macet-gila-jarak-5-km-butuh-waktu-1-jam/full&view=ok.
- Masson-Delmotte, V., P. Zhai, H.-O. Pörtner, D. Roberts, J. Skea, P. R. Shukla, A. Pirani, et al. 2018. “Global warming of 1.5°C: Summary for policy makers.” In IPCC - The Intergovernmental Panel on Climate Change. Geneva, Switzerland: IPCC.
- Nanditho, G. A., and L. Yola. 2022. “Urban Development and Traffic Congestion: Jakarta Study During the Pandemic.” In Sustainable Development Approaches. Lecture Notes in Civil Engineering, edited by E. M. Nia, I. Farshchi, L. Yola, and M. Awang, Vol. 243. Cham: Springer. https://doi.org/10.1007/978-3-030-99979-7_16.
- Nunes, L. J. R. 2023. “The Rising Threat of Atmospheric CO2: A Review on the Causes, Impacts, and Mitigation Strategies.” Environments 10 (4): 66. https://doi.org/10.3390/environments10040066.
- Oberman, R., R. Dobbs, A. Budiman, F. Thompson, and M. Rossé. 2012. The Archipelago Economy: Unleashing Indonesia’s Potential. Seoul, San Francisco, London, Washington DC: McKinsey Global Institute.
- Pardamean, B., R. Rahutomo, T. W. Cenggoro, A. Budiarto, and A. S. Perbangsa. 2021. “The Impact of Large-Scale Social Restriction Phases on the Air Quality Index in Jakarta.” Atmosphere. Atmosphere 2021, 12, 922. 12 (7): 922. https://doi.org/10.3390/atmos12070922.
- Paziewski, J., and M. Crespi. 2020. “High-Precision Multi-Constellation GNSS: Methods, Selected Applications and Challenges.” Measurement Science and Technology 31 (1): 010101. 1. https://doi.org/10.1088/1361-6501/ab20a6.
- Purwoko, B. A.-C, and L. Yola. 2022. “Willingness to Modal Shift from Private to Public Transportation in Jakarta Metropolitan Area.” Planning Malaysia 20 (21). https://doi.org/10.21837/pm.v20i21.1089.
- Rachman, H. O., and L. S. Barus. 2019. “Impact of Car-Free Day on Air Pollution and Its Multifarious Advantages in Sudirman-Thamrin Street, Jakarta.” International Journal of Geomate 17 (62): 167–172. https://doi.org/10.21660/2019.62.8286.
- Schaefer, M., and A. Pearson. 2021. Accuracy and precision of GNSS in the field (pp. 393–414). Elsevier eBooks. https://doi.org/10.1016/b978-0-12-818617-6.00002-0.
- TEMPO.CO. 2019. “Easing Congestion to Reduce Air Pollution in Jakarta.” Accessed March 26, 2019. https://en.tempo.co/read/1189142/easing-congestion-to-reduce-air-pollution-in-jakarta.
- TomTom Traffic Index Report. 2022. TomTom Traffic Index: Jakarta Congestion Decreases, Now Ranks 46 Most Congested Cities in the World. February.
- Ulfiasari, S., and L. Yola. 2022. “How Does Urban Development Contributes to Urban Heat Island: A Decade Increase of Urban Heat Intensity in Jakarta Metropolitan Area.” Lecture Notes in Civil Engineering 161:67–77. ISBN 978-981162328-8.https://doi.org/10.1007/978-981-16-2329-5_9.
- Vital Strategies. n.d. “Sumber Utama Polusi Udara di DKI Jakarta Pernyataan.” https://doi.org/10.1371/journal.
- World Air Quality. 2018. Report 2018.
- World Bank. 2021. The World Bank in Indonesia. Jakarta: The World Bank Group.
- The World Bank. Climate Watch. 2020. “GHG Emissions.” Washington, DC: World Resources Institute. climatewatchdata.org/ghg-emissions.
- World Urbanization Prospects: The 2018 Revision. 2019. https://doi.org/10.18356/b9e995fe-en.
- Yola, L., G. A. Nanditho, K. Kobayashi, and D. Manandhar. 2024. “Integration of Carbon Dioxide Sensor with GNSS Receiver for Dynamic Air Quality Monitoring Applications.” Sensors International 5:100279. https://doi.org/10.1016/j.sintl.2024.100279.
- Yola, L., and H. C. Siong. 2017. “Computer Simulation as an Alternative Approach in Climatically Responsive Urban Configuration Study.” Chemical Engineering Transactions 56:505–510. https://doi.org/10.3303/CET1756085.
- Yoro, K. O., and M. O. Daramola. 2020. “CO2 Emission Sources, Greenhouse Gases, and the Global Warming Effect.” In Elsevier eBooks, 3–28. https://doi.org/10.1016/b978-0-12-819657-1.00001-3.
- Yudhistira, M. H., R. Kusumaatmadja, and M. F. Hidayat. 2019. “Does Traffic Management Matter? Evaluating Congestion Effect of Odd-Even Policy in Jakarta.” LPEM-FEB UI Working Paper 029, January 2019. ISSN 2356-4008.
- Zhang, G., B. Xu, H.-F. Ng, and L.-T. Hsu. 2021. “GNSS RUMS: GNSS Realistic Urban Multiagent Simulator for Collaborative Positioning Research.” Remote Sensing 13 (4): 544. https://doi.org/10.3390/rs13040544.