
ABSTRACT
This paper follows European countries as they struggled through the first wave of the Sars-CoV-2 pandemic. We analyze when countries were confronted with the virus, how long it took until the number of new infections peaked and at what level of infections that peak was achieved via social distancing and lockdown policies. Most European countries were able to successfully end the first wave of the pandemic – defined as a two-week incidence rate smaller than 10 cases per 100,000 people. We find that countries in which the virus made significant landfall later in time enjoyed a latecomer advantage that some of these countries squandered, however, by not responding quickly enough and that an early lockdown was more effective than a hard lockdown.
Introduction
Pandemics often come in waves. This is so for two main reasons: firstly, social distancing measures and lockdowns can powerfully reduce infection rates. They are, however, costly and tiring, and therefore, typically cannot be sustained over a sufficiently long period. If fewer and fewer people follow social distancing norms, the virus comes back. Or, secondly, the virus mutates and, as with the Spanish flu in its second wave (Kobasa et al., Citation2004; Paulo et al., Citation2010), returns and predominantly affects a different group of people. With the end of the holiday season in Europe (Plümper & Neumayer, Citation2020a), infection rates were rising in most European countries and the pandemic was back in full force. Still, this article focuses on and aims at developing a systematic descriptive analysis of the first wave of the Sars-CoV-2 pandemic in Europe.Footnote1
We aim to understand whether and to what extent policy responses have shaped the curvature of the first wave. We are particularly interested in three aspects of the first wave, namely, the time it took from a few cases to 1000 cumulative cases, the size of the peak infection rate (the height of the wave), and the time it took from the peak to a low two-week incidence rate of below 10 new infections per 100,000 people. In all three dimensions, the observable variation across countries is astonishingly large. It took Italy 8 but Bulgaria 48 days from 10 known cases to 1000 known cases. Greece peaked at 10.66 infections per 100,000 people, whilst Iceland’s peak was more than 20 times more severe at 277.04 infections and Luxembourg peaked at 348.92 infections per 100,000 people. Likewise, Austria and Iceland took 30 days from their peaks to containing the infection, defined as a two-week incidence rate smaller than 10 per 100,000 people, while it took Italy and the Netherlands more than twice as long for the same improvement. These are staggering differences – differences which are neither satisfactorily explained by epidemiological models nor by lockdown policies alike.
The data we employ, taken from the ECDC, the European Center of Disease Prevention and Control (www.ecdc.europa.eu), necessarily contain substantial measurement error. For example, true infection rates remain unknown, the ECDC merely reports data based on the number of positive tests per day, which are to some extent be influenced by a country’s willingness and ability to undertake testing. As another example, whilst we employ the widely used Oxford University’s Covid-19 government response tracker (Hale et al. Citation2020) for coding our main policy response, namely a recommendation or, depending on the country, mandate for citizens to stay-at-home, aka lockdown, one can look at different responses or code such responses differently and thereby perhaps come to somewhat different conclusions.
With these caveats in mind, we nevertheless will draw some descriptive inferences that we believe will prove to be robust to the apparent endogeneity problems and measurement errors. To start with, we observe on average a clear disadvantage of countries that were affected first and before others in Europe. The later in calendar time the virus made significant landfall in a country, the longer it took from 10 to 1000 cases and the lower were peak infection rates on average across countries. Countries in which the virus entered later, which Medeiros et al. (Citation2020) term latecomers, could learn from other European countries where the virus had made landfall earlier. This implies indirectly that observing the Chinese experience, which perhaps should have been sufficient, was in fact rather irrelevant to European policy-makers. The most drastic lockdown of any population in modern history, as happened in the Chinese city of Wuhan, somehow did not suffice as a wake-up call.
The first wave of the Covid-19 pandemic demonstrated in many respects that European countries were not well prepared for dealing and coping with the emergent risks of a pandemic (Bouckaert et al., Citation2020): some countries did not have enough intensive care units, ventilators were scarce and virtually no country had sufficient protective gear for medical staff and masks for the broad public. Given the nature of the pandemic, it also would have been a good idea to command over a relatively large number of mobile ICUs as the virus shows large regional variation.Footnote2
We show that lockdown policies can usefully be broken down into two dimensions. In a first dimension, governments can choose between an early, a medium late and a late response or choose not to employ a lockdown at all. By early, medium late and late we do not mean actual time but epidemiological time, so to speak, namely at what stage of the pandemic’s spread in the country the policy measure was chosen. In the second dimension they can choose the level of stringency of the lockdown policy, from a soft recommendation to stay at home, to a moderate stay at home directive or a much harder order not to leave home with few clearly specified exceptions. Our descriptive analysis suggests that speed trumps harshness. Many though not all countries that locked down early generally had lower peak infection levels and managed to come down from the peak of the wave to very low levels of new infections faster than late adopters, whereas there is enormous variation in success by degree of harshness of the lockdown. This suggests that governments have a choice between an early and moderate policy response or a late and hard policy response – a dilemma that now forcefully returns during the second wave.
Pandemic dynamics: a simple classification
In stylized fashion, the first wave of the Sars-CoV-2 pandemic can be divided into three phases: In the first phase, governments and populations are naïve and essentially ignore the risks associated with the virus. During this period, politicians, if aware of the existence of the virus in other countries, often claim that it is unlikely that the virus reaches their country and if that were to happen the country would be ‘well prepared’. Likewise, the population is not yet alarmed at this initial stage and have not yet adjusted their social behaviour to the risks of becoming infected. In fact, neither members of the public nor the government do anything significant to prevent infections. In this phase, Sars-CoV-2 spreads at an exponential rate.
The first phase ends and the second one begins when the risks associated with the virus become all too clear and both governments and individuals start taking preventive measures (Plümper & Neumayer, Citation2020b). In this second phase, some individuals begin to behave differently, norms of social distancing emerge and governments start prohibiting certain forms of social interaction. Large events are banned, schools and universities are closed, shops are shut, a stay-home policy is recommended or mandated. Eventually, travel restrictions are implemented. If behavioural and social distancing measures are effective, the spread of the virus slows down (Maier & Brockmann, Citation2020; Schmitt, Citation2020). Tomas Pueyo (Citation2020) has coined the term ‘the hammer’ for this second phase of a pandemic. The ‘hammer’ signifies that the measures taken to reduce the number of new infections are blunt and hard hitting with governments seeing no other option in their aim to prevent the health system from collapsing as more and more patients suffering from Covid-19 are sent to hospitals and intensive-care units.
The third phase is reached if (and only if) the hammer was successful. When the virus seems almost defeated, governments start to lift restrictive measures, allow a resurrection of social life and the ‘dance’, Pueyo’s (Citation2020) term for the period after the ‘hammer’, begins. Governments replace the strategy of national lockdown with a local strategy in which newly emerging cases are being traced and isolated in order to suppress contact between infected and uninfected people. The third phase works best when all new infections are identified and isolated. Hence, the number of tests remains high. The term ‘dance’ describes that the policies in the third phase are not static, because the epidemiological situation reached by the ‘hammer’ is not stable. During the third phase, governments occasionally have to re-implement partial lockdown measures wherever a local hotspot emerges and threaten to get out of control.
The next three sections descriptively analyze each of these phases in more detail.Footnote3 As we now observe, the ‘dance’ is also not necessarily stable. During the autumn of 2020, governments in Europe brought the hammer back and applied a more moderate version of the lockdown to fight the second wave.
From naivety to a first line of response: the early days of the pandemic in Europe
Before the risks associated with Covid-19 became obvious in late February, many politicians doubted that the virus would spread to Europe at all. Despite the drastic pictures from Wuhan in China, the pandemic-in-the-making was only taken seriously once infection numbers in Italy and Spain rose exponentially and pictures of the brutal reality in Northern Italian hospitals showed the stark possibility of a collapsing health system at home. Italy was the first European country in which the virus spiraled out of control (Ghislandi et al., Citation2020), but in pandemic terms the Italian infection curve was only roughly one or two weeks ahead of the developments in Austria, Spain, Switzerland, France, Germany and the UK. The ski holiday season in the Alps (Plümper and Neumayer Citation2020b), business and other tourism travel across the continent and some events such as international football matches (Hunter, Citation2020; Parnell et al., Citation2020) and the carnival (Laliotis & Minos, Citation2020) helped the virus to reach even remote locations. The policy of tracing single infections and isolating individual spreaders had failed before it really begun.
displays the arrival of the Sars-Cov-2 in European countries. The bars begin when a country reached 10 cumulative infections and it ends when the country reached 1000 cumulative infections, with the line within the bar marking the day on which a country had reached 100 known infections. Early countries reached 10 known cases in February, late countries around mid-March. Any interpretation of should take into consideration that the uncertainty of the data is relatively large and particularly so in the first phase of the pandemic. Known infection rates are clearly not precise measures, especially not in the early days before mass testing became possible. In most countries testing capacities were still relatively low and people were only tested if they had symptoms and had travelled to countries which were perceived as infection hotspots or if they had interacted with travellers from these countries.
Figure 1. Timeline of 10, 100, 1000 known infections.
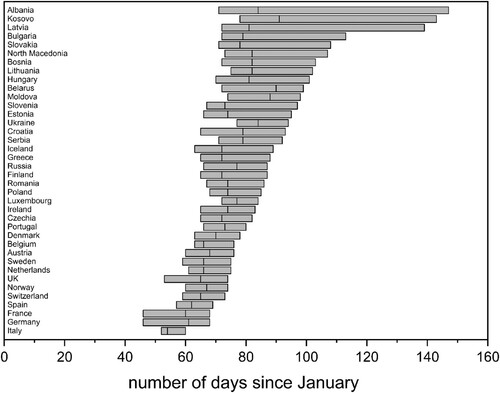
With these cautionary remarks in mind, the data in show that (a) the virus did not reach all European nations at approximately the same time and that (b) the later a country reached 10 known infections, the longer on average it took a country to reach 1000 known infections. The first European country to reach 1000 known cases was Italy on day 60 (February 29), the last one was Bulgaria on day 113 (April 24). Italy went from 10 to 1000 known infections in only 8 days, Bulgaria in 41 days. On average, for each day a country took longer to reach 10 infections, the number of days it took the country to get from 10 to 1000 infections increased by 1.44 days. On average, therefore, the initial part of the exponential curve of the first wave was flatter in countries that were affected later.
The latecomer advantage cannot be attributed to a single factor. Instead, we suspect the following factors played a role: First, the pandemic could initially evolve completely undetected in the countries the virus reached first. Italy provides the best example for a country that was hit hard and largely by surprise. By contrast, latecomers were not taken by surprise. When the pandemic reached Norway, Sweden, the Netherlands and Austria the virus was already expected. In fact, as we will show in the next section, in some but not all countries the TV pictures from Italy had triggered political decisions when known infection numbers were still very low.
Second, the later in time countries started to experience an exponential increase of infection numbers, the more people had already started to change their behaviour and voluntarily implemented some social distancing measures. In some countries, social distancing begun not because the government implemented measures but because more and more people had seen footage of the meltdown of the Italian health system, became scared and changed their behaviour (Andersen, Citation2020; Chudik et al., Citation2020). Third, during the early stage of the pandemic the number of undetected infections was large and the virus could spread rapidly. When the virus reached latecomer countries up to three weeks later than those affected early on, often testing capacity had improved.Footnote4
Between a hammer and a hard place: covid-19 politics in Europe
Many countries, at least in theory, had plans in the drawer for a global pandemic. During January and February, however, the evidence of a serious pandemic mounted, but governments did little to gear up for the storm to come in March and April. Some countries gave away protective equipment to others without aggressively replenishing their own stocks – a sign of both admirable willingness to help others but also of wishful thinking that the same fate would escape them. Looking back, Germany may have been better prepared than many other European countries. However, the government apparently expected that it would be possible to quickly isolate the infected and prevent the uncontrolled spread of the virus. On February 18, when the virus had definitely reached Europe, Germany sent 8.4 tons of protective medical gear to China – gear that hospitals and medical personnel sorely missed later on.Footnote5 On March 2, the German government sent protective medical clothing to Iran. The same day the Robert-Koch-Institute raised the threat level for Germany from low to moderate. At this stage, super-spreader events in Ischgl and elsewhere had already propelled the virus to virtually most or perhaps even all European countries.
In the meantime, Italy had lost control over the pandemic situation. As a consequence, the government reached for the hammer and Italy became the first European country to impose restrictive anti-coronavirus measures. Facing an exponential growth of SARS-CoV-2 cases, albeit from the still low level of 79 known cases, and the first two deaths, Italy’s government pulled the trigger on February 23 and closed schools and non-essential workplaces, prohibited events and public gatherings in affected places. When Italy imposed a lockdown on March 8 on the region of Lombardy and selected districts in Veneto, Emilia-Romagna, Piedmont and Marche, more than 6000 known infection cases had already been identified by its health authorities. The lockdown was harsh and precluded the free movement of people in and out of the affected regions. One week later, the Italian government expanded the lockdown to the entire country. At this point, the number of known infections had risen to 12,000 people.
Many observers today believe that Italy responded too late and the attempt to contain the virus in the initially affected region failed.Footnote6 However, if we measure the response timeliness by the number of known infections on the day a partial or nation-wide lockdown was implemented, Italy was in fact fairly early by comparison to many of its European peers. On March 8, the day the Italian government imposed a quarantine in affected regions, Italy had roughly 12 known cumulative infections per 100,000 people. Italy may have responded late, but by this standard, other European governments including Belgium (26 cumulative infections per 100,000 people), Estonia (38), Ireland (47), Luxemburg (23), and Spain (21) responded even later though their governments had or at least could have had better information.
Perhaps surprisingly, the calendar date of the lockdown and the population-standardized number of known infections are positively correlated. On the one hand, this seems obvious: the later a government imposes anti-coronavirus measures, the higher the number of known infections on that day, everything else being equal. Upon closer inspection, however, the logic appears less compelling: Italy’s experience from late February and early March should have sent strong signals to countries that were behind on the upward curve of the pandemic. In fact, policy-makers could have learned that they need to respond at a lower number of population-standardized infections since they were clearly in a position to extrapolate what will happen if they did not do so. Yet, many governments waited for the virus to become a major problem in their own country before they were willing or able to take unpopular measures (Hunter, Citation2020). The Republic of Ireland serves as a good example: the government waited until March 27 to issue a stay-at-home order. On this day the country experienced an escalating death toll and the cumulative number of confirmed cases had risen to 2121. Simulations suggest that if the government had responded one week earlier, the peak number of known infections would have been approximately 75 per cent lower. The UK provides another example. The Johnson government pondered with the idea of implementing what has since become known as the Swedish strategy, which avoids a lockdown and allows a relatively high number of infections, possibly to reach the unstated goal of herd immunity.Footnote7
When push came to shove, governments only had a choice between three main strategies for dealing with the rising tide: do nothing; test, trace and quarantine; and the imposition of social distancing measures typically culminating in a lockdown. The first strategy is not viable with the virus threatening to overwhelm the health care system and kill a very large number of people. All other things equal, governments prefer the second strategy to the third strategy. When governments, which initially had underestimated the pandemic, became aware of the sheer scale of the wave of infections and their rapid growth, the tracing option quickly became impossible to pursue, not least because tests were not available in sufficient numbers in the beginning for the strategy to work despite efforts to ramp up testing capacity. In other words, the second option was not really viable either. The vast majority of governments, therefore, sooner or later opted for the third strategy, which combines various social distancing measures and typically culminates in a lockdown that can be imposed regionally (as in Russia) or nationally and that can vary drastically in its stringency (see ).
Table 1. Lockdowns in European countries by epidemiological timeliness and stringency.
analyzes a country’s stay-at-home (lockdown) policies, with data taken from Hale et al. (2020) of Oxford University. Of all the policies coded by Hale et al. (2020), we choose the stay-at-home policy as the policy that is most clearly and directly linked to the notion of a lockdown. Also, many of other policies become almost necessary by a stay-at-home policy. For example, it makes little sense to keep restaurants and bars open if people are under order to stay home. We analyze lockdown policies in two dimensions. One dimension codes their stringency, along 4 categories, from 0 – No measures, 1 – recommend not leaving house (soft lockdown), 2 – require not leaving house with exceptions for daily exercise, grocery shopping, and ‘essential’ trips (moderate lockdown), to 3 – require not leaving house with minimal exceptions (e.g., allowed to leave only once a week, or only one person can leave at a time, etc.), which represents a hard lockdown. The second dimension differentiates countries according to the population-standardized number of known cumulative infections on the day of the lockdown. Note that, this measures the timeliness of lockdown measures in epidemiological terms rather than calendar days though in we also state the calendar day of the year 2020 when measures were taken. Early lockdown covers countries that went into lockdown with fewer than 5 known cumulative infections per 100,000 people, medium late lockdown captures countries that went into lockdown with between 5 and 10 known cumulative cases per 100,000 people, and late lockdown consists of countries that went into lockdown after 10 known cumulative cases per 100,000 people. Admittedly, there exists some uncertainty about these categories since we cannot assume that the number of unrecorded (unknown) cases was roughly similar in all countries because the ability and willingness of countries to test differs. Note that some countries appear twice as they impose a harder lockdown after a softer start, with their country names shown in italics at the point of softer initial start.
suggests that, with the exception of Ireland,Footnote8 a soft lockdown was only an option ever chosen by countries that responded early in epidemiological terms, i.e., where the number of infections per 100,000 people was below 5. We see two non-mutually exclusive reasons for this finding: one explanation suggests that a soft response does not always allow countries to stop the exponential growth that the pandemic had in phase 1. Countries that lockdown late, therefore, did not waste time with a strategy that may not always work well. We thus find that countries that employed more stringent lockdowns tended to lockdown later in calendar time and as time proceeded through March and April the public’s acceptance of harsher measures had increased as it became increasingly visible that more and more countries ran into capacity limits in their health system. Further research needs to analyze why the ‘early and soft’ strategy was stable in Denmark, Finland, Slovenia, and Lithuania while other countries, including the Netherlands, Germany, and Hungary sharpened the lockdown rules between one and two weeks after soft rules were implemented. We suspect that the population in countries in which soft lockdowns worked pursued greater discipline in social distancing. Since the population’s discipline was often lower in the autumn when the second wave begun to roll over Europe, the second wave allows social scientists to explore in greater depths the ‘soft behavioural factors’ influencing a national response to the pandemic. At the other extreme, only 4 countries imposed a hard lockdown during the first wave, namely Italy, Serbia, Bosnia–Herzegovina and Russia though this only refers to the capital Moscow rather than the whole country. Italy was taken largely by surprise and saw no alternative to a hard lockdown. The other three countries lack proper democratic checks and balances which might render it easier to impose a hard lockdown. There is, however, no deterministic relationship with regime type, not even in Europe, as the example of Belarus, one of Europe’s last true autocracy, demonstrates with no lockdown imposed as Alexander Lukashenko dismisses Covid-19 as a sign of personal weakness.Footnote9 Russia’s capital city of Moscow appears to have been forced into a hard and late lockdown when the early moderate lockdown adopted on calendar day 66 did not suffice to win control over the virus’s spread. Both Serbia and Bosnia–Herzegovina tried an ‘early and hard’ strategy successfully during the first wave. Both countries now seem to go through a relatively strong second wave, however.Footnote10
An intermediate strategy of moderate lockdown was the choice of most countries. This is perhaps not surprising since soft lockdowns risk being ineffectual whilst hard lockdowns are very unpopular amongst the populace. Amongst this group of countries are some that tried a soft and early lockdown first, like Germany, Hungary, the Netherlands, Romania and Ukraine but then moved to a still early moderate lockdown (in the case of Hungary and Ukraine) but otherwise late moderate lockdown, probably because policy-makers thought that the soft lockdown would prove insufficient. Amongst the late adopters of moderate lockdowns are typically governments that reluctantly implemented anti-coronavirus measures and tried to avoid a lockdown as long as possible. These governments acted late, and often unwillingly, sometimes pressured by the media or by epidemiologists in the face of rapidly rising infection rates. These countries did very little first, and then went into a late lockdown. The UK, Ireland, Estonia and, if we look beyond Europe, the USA provide examples for this policy choice.
shows a moderate negative correlation between the timing and the stringency of the policy response in terms of epidemiological time. Leaving aside the countries that did not go into lockdown, we see a weak pattern with Serbia and Bosnia–Herzegovina as outliers.
It was, however, also possible to avoid a lockdown. The role-model for this strategy has been Sweden, but Iceland and Norway also never implemented a formal stay-at-home policy. Iceland benefits from its relative remoteness, low population density outside the capital city and its island status. It also closed down schools, cancelled public events and restricted public transport. Norway went even further and on March 12 implemented and enforced a number of strict measures: educational institutions, bars, pubs and clubs were closed, cultural and sports events cancelled, travellers returning from trips abroad had to quarantine, and, from March 16 on, foreigners were no longer allowed to enter the country. In other words, both Iceland and, particularly, Norway implemented a relatively strict anti-coronavirus regime, but avoided a formal lockdown. If ‘success’ means the combination of low infection and mortality figures achieved by the softest possible policy response, Norway has arguably been the most successful European country during the first wave.
Unless accompanied by other strict anti-coronavirus policies, the ‘no lockdown’ strategy is difficult to maintain when infection rates keep rising though a large part of the Swedish population seems to tolerate a mortality rate well above its Scandinavian peers. In other countries, a similar strategy did not last long. In the very beginning, the UK followed a strategy not dissimilar to Sweden but was forced to implement a late moderate lockdown when the number of active infections threatened the stability of the National Health System (NHS). With the lockdown imposed, the NHS did not collapse, new infections peaked at 110 cases per 100,000 people over a period of two weeks on day 113 (April 22), roughly two weeks after comparable European countries reached their peak. However, many blame the lateness of the lockdown for the country’s exceptionally high mortality – both in absolute and in per capita terms (Hunter, Citation2020).
Let the dances begin: the management of local hotspots in a low-level pandemic
The political measures implemented in phase 2 aimed at gaining control of the spread of the virus and preventing a collapse of the health system. This aim is reached when the effective reproduction rate of the virus falls below 1 on a sustained basis, which indicates that every infected person causes fewer than one new infection, and the number of both new infections and active cases, therefore, declines.
displays the association between peak infection rates and the decline in infections. The x-axis is a timeline, ranging from calendar day 50 to day 300. Each bar indicates the period between the day the population-standardized peak infection rate was reached and the day the two-week incidence rate fell below 10 per 100,000 people. Lines within each bar indicate the day countries reached an incidence rate of 50 and 25, respectively. Countries that do not have lines within a bar peaked below these thresholds. For example, Croatia peaked at 23.38 cases per 100,000 people, and therefore, has no bars within its column indicating 50 and 25 new infections.
Figure 2. From Peak Level to 10 Infections per 100,000 People.
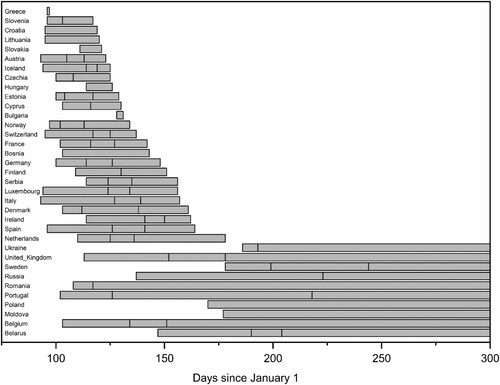
The country that peaked first, Italy, reached the peak on day 93, April 2. It took Italy another 64 days until June 5 to push the two-week incidence rate below 10. The country that managed to reach this success first was Greece, but that was mainly due to the fact that Greece’s infection numbers during the first wave peaked at 10.66 infections per 100,000 people. reveals that, by and large, countries which peaked early in calendar time also managed to reduce the two-week incidence rate of 10 new infections per 100,000 people threshold earlier and faster. Yet, there are exceptions. Some countries, including the UK, Belgium, and Sweden did not reduce their two-week incidence rates to very low levels before the second wave begun to slowly evolve. In fact, 11 countries, including these three countries, never managed to reduce the 2-week incidence rate to below 10 cases per 100,000 people.
We have already alluded to the fact that when it comes to pandemics there are two distinct conceptions of time. One is the traditional one of calendar time, the other one of epidemiological time, so to speak, measuring the stage of the pandemic reached. revealed that with some exceptions countries that peaked earlier in calendar time, managed to reach a two-week incidence rate of below 10 cases per 100,000 people earlier. Is the same true for countries that peaked earlier in epidemiological terms? One would expect that the lower the peak level was, the easier it should be for countries to bring new infections down to 10 per 100,000 people since the lower the peak the relatively less out-of-control the pandemic has been. The perhaps most surprising of our reported stylized facts is that there is no such systematic structure discernible beyond countries that peaked at very low levels. This is shown in , which plots the number of days countries took from peak to a two-week incidence rate smaller than 10 cases per 100,000 people against the peak infection rate at which these countries managed the turnaround. Countries labelled in blue (all countries in the upper part of the figure) have never reached a two-week incidence rate below 10 cases per 100,000 people. For these countries the y-axis measures the difference in days between their peak and day 300.
Figure 3. Peak Infection Rate and the Time from Peak to Below 10 Cases per 100,000 People.
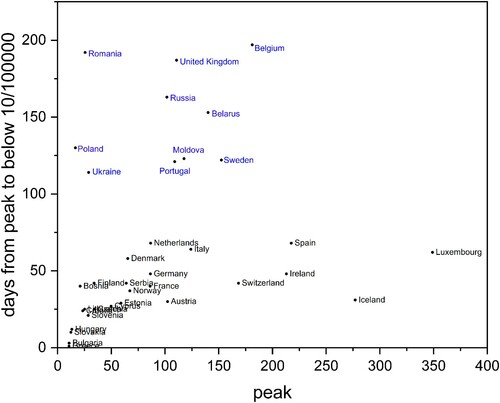
Countries that had a very low peak infection rate usually had little difficulty in reducing new infections to below 10 cases per 100,000 people over 2 weeks. Yet, once we focus only on countries that peaked above 30 cases per 100,000 people the positive correlation between the size of the peak and the time to below 10 cases per 100,000 people essentially disappears. Romania, Portugal, the UK and Belgium, to name four countries, had a relatively low peak, but none of these countries did not manage to bring new infections below 10 per 100,000 people before the second wave begun. Iceland, Ireland, and Luxembourg, on the other hand, peaked at very high levels but managed to reduce infection levels relatively quickly. We stress that this relates to getting a grip on the first wave only.
Of the comparably slow countries to get the first wave under control, the UK and Belgium went late into a moderate lockdown, but so did Ireland and Luxembourg. This leads to the perhaps most important question: Does the success in reducing infection levels, as measured by the days between peak and 10 new infections per 100,000 people, depend on the chosen lockdown strategy? provides a fuller picture of the evolution of the pandemic than combined with information on the stringency and epidemiological timing of lockdown imposed.
Table 2. Response stringency, timing and stabilization during the first wave.
allows us to suggest a number of stylized facts: First, the data suggests that an early lockdown reduced the peak number of population-standardized infections. Reacting early in epidemiological terms means that the pandemic has not yet gone too much out of control which means that it is easier to reach a lower peak level than if the pandemic is already on a rampage. For example, neighbouring Austria and Czech Republic both adopted a moderate lockdown but the latter does so early whilst the former does so medium late. Austria peaks at a level that is three times higher than the Czech Republic’s. This may partly be explained by different testing activities. However, Austria reported only 50 per cent more tests per capita than Czechia. It is, therefore, unlikely that testing alone accounts for the differences in the infection dynamics.
Second, the variation in population-standardized peak infections is astonishingly large even among countries that reacted at approximately the same epidemiological stage, particularly when they did not react early. Among the countries adopting a moderate lockdown at a medium late stage, peak levels vary from 16.61 (Poland) to 117.65 (Moldova). Adopting a similarly moderate lockdown but at a late stage, peak levels vary from 49.89 in Cyprus to 348.92 in Luxembourg.
Third, there are interesting differences in the infection dynamics in the ‘no lockdown group’. To start with, there is similarly large variation in peak infection rates as observed for other groups, ranging from the 67.26 per 100,000 people in Norway to the 277.04 in Iceland though it should be noted that the reported infections in Belarus appear to be unreliable and could thus well be higher than Norway’s.
Fourth and perhaps most relevant, the peak incidence rate only had a weak influence on the time from peak to containment. Indirectly, the lack of a stronger systematic relation suggests that anti-coronavirus policies and social distancing measures had a strong influence on the course of the first wave in European countries. To give one example: Iceland had a significantly higher peak incidence rate than Sweden, yet the country managed to reduce infection rates much faster than Sweden. Given both countries shunned a stay-at-home order, other preventive measures have to account for the significant difference in dynamics though Iceland’s remoteness may have helped. Still, Sweden is an outlier at least among Northern and Western European countries in more than one respect (Conyon et al., Citation2020; Helsingen et al., Citation2020; Yan et al., Citation2020) and its government did not try hard to reduce the incidence rate during the first wave.
Fifth and perhaps most puzzlingly, and show remarkably little systematic pattern in respect to whether countries push new infections to below 25 cases per 100,000 people over a two-week period, let alone to below 10 cases per 100,000 people. There are only two strategies in which no country has failed to push infections to below the threshold of 10 new infections per 100,000 people: early soft and early hard lockdowns.
Conclusion
With the first wave over, many European governments lifted anti-coronavirus measures and people became more careless. And thus the pandemic returned and the so-called second wave has begun. In virtually all European countries, including those that managed the first wave well and had brought new infections down to low levels, infection rates have risen in September and October, in some countries rapidly and even exponentially. Increasingly, countries lose the ability to identify and isolate infected individuals and to trace and quarantine many of the individuals with which they had close contact. Governments are again closing borders and implementing a stricter testing and quarantine regime for homecoming tourists. Even lockdowns are becoming en vogue again.
In this article, we have described the comparative dynamics of the first wave. Some patterns have emerged, while other expected associations appear to be surprisingly weak or non-existent. The first clear pattern that we have identified is the existence of an advantage of countries in which the virus arrived later. The latecomer advantage manifests itself in a slower exponential function of cumulative infections at the very start of the first wave mainly because people already start to self-implement social distancing norms before the government does and because some governments react prudently having seen the situation unfold in countries where the virus makes earlier landfall. The most striking, albeit weak association is that between a low peak rate of infection and the time it takes to reach 10 new infections per 100,000 people over a two-week period, which appears to exist only for those with a very low peak rate of below 30 per 100,000 people. We have also provided some tentative evidence that an early political response has major advantages over a stringent political response. At least to some extent, governments have a choice between early and soft to moderate measures or late and moderate to hard lockdown measures if they want to bring down the infection rate quickly. However, not all governments want to reduce infections quickly. Sweden provides the best-known example for a country that did not go into lockdown and maintained a rather liberal attitude to social life. Yet, not Sweden but Norway would be the best example for a country that avoided a lockdown and kept, in contrast to Sweden, infections and incidence rates low by implementing restrictive social distancing rules. The difference between Sweden and Norway is not the absence of a lockdown but the discipline of social distancing measures and the number of tests. The Swedish policies came at the price of higher cumulative infection numbers, probably avoidable excess mortality, a high mortality rate among those older than 60 (Modig & Ebeling, Citation2020) and a slower decline in the incidence rate. Macroeconomic data demonstrates that the economic advantages of this strategy are small, and perhaps even non-existent (Eurostat, Citation2020). In contrast, countries that responded earlier often had a shorter lockdown and fewer adverse economic consequences.
Still, we do not find that the combination of an early and hard lockdown has major advantages over a similarly early but milder lockdowns. At the same time, stricter measures come at a larger social and psychological costs. Even from this perspective, an early implementation of measures tends to be preferable to a later implementation, as later measures often have to be stricter than earlier measures and have to be implemented for a longer period to get to the same low level of new infections. The dance, the implementation of repeated moderate anti-coronavirus measures appears to be a promising strategy. Unfortunately, the second wave demonstrates that European governments have not yet learned to keep infection numbers sufficiently low through repeated early and moderate measures. It is important to act early and stay ahead of the game. During the first wave, the few countries that have chosen an early and moderate response strategy kept incidence rates low.
The perhaps most puzzling finding for political scientists is the absence of a systematic relationship between factors that political scientists usually deem policy-relevant and the policy choices of governments during the first wave of the pandemic. Different types of countries did not generally respond systematically differently and when countries responded differently, the emerging pattern does not fit well standard public policy theories (Béland, Citation2009; Kamkhaji & Radaelli, Citation2017). For example, ‘families of nations’ theories (Obinger & Wagschal, Citation2001) would hardly have predicted that Scandinavian governments implemented very different policies to an identical threat, that the response of centralized countries such as France does not differ much from that of federal states such as Germany, that the different role courts play in the public policy in different countries exerts only a very minor effect at best in the first wave of the pandemic. Partisan preferences also had a minor influence on the political response, with no clear differences between more right-leaning and more left-leaning governments. Even the influence of ‘populist parties’ in government was not homogeneous, with some populist regimes downplaying the threat but Hungary, on the other hand, being amongst those countries that adopted a medium lockdown early on. There also seems to be no evidence that during the first wave more decentralized, federal countries chose a nuanced regional response.
Puzzling as this may seem, as we have explained above, the lack of mass testing capacity coupled with the sheer and largely unexpected, or at least under-estimated, scale of infections left the vast majority of governments with little choice than to adopt social distancing measures and to impose, sooner or later, a lockdown of softer or harder stringency. Test, trace and isolate was dead in the water as a strategy given the sheer flood of infections before it even properly started to take off and to do nothing at all was never an option for governments unwilling to let a very large number of their citizens die. We believe that we will see a larger explanatory power of public policy theories during the second wave. One can already observe, to some extent, a return of courts as a veto-player influencing the nature of policy measures and we also see more regionally diverse policies and measures in more decentralized countries.
Disclosure statement
No potential conflict of interest was reported by the author(s).
Additional information
Notes on contributors
Thomas Plümper
Thomas Plümper is Professor of Quantitative Social Research, Vienna University of Economics, and Director of Analytics Datafabric.
Eric Neumayer
Eric Neumayer is Pro-Director (Pro-Vice Chancellor) Planning and Resources and Professor of Environment and Development, London School of Economics and Political Science.
Notes
1 The sample we analyze includes European countries with a population of at least 1 million people plus Luxembourg.
2 Preparedness is a contested term when it comes to financial market crisis, natural disasters, and also to pandemics. Governments and people cannot prepare for the next disaster, but only for disasters in general (Plümper et al., Citation2017). In respect to pandemics, the WHO has repeatedly, in 1999, 2005, and 2009, published a preparedness plan (WHO, Citation2009).
3 At the time of writing, European countries were not yet in a full second wave but still in the third phase with the ‘dance’ becoming however increasingly difficult to keep new infections sufficiently low. If and when a full second wave hits, a return to the ‘hammer’ might be unavoidable though policy-makers might take a different direction given fears what it would do to a weakened economy that the application of the ‘hammer’ in the first time around has left behind.
4 In most countries, testing for Sars-CoV-2 only took off in April. See the data provided by Roser et al. (Citation2020).
6 See, for example, https://www.nytimes.com/interactive/2020/04/05/world/europe/italy-coronavirus-lockdown-reopen.html and https://www.aa.com.tr/en/europe/covid-19-what-went-wrong-in-italy-and-spain/1797461.
7 As of the time of writing, nobody knows for how long people who have had the virus acquire immunity and thus nobody knows whether herd immunity can be reached at all.
8 Ireland tried the same strategy but at more than 10 infections per 100,000 people it had to move from soft to moderate lockdown only two days later.
10 Whilst this second wave lies beyond the scope of this article, we suspect that a harsh response during the first wave for economic reasons impedes an appropriate response at a later stage of the pandemic when the second wave starts. A comparison of policy responses between the first and second wave should prove a fruitful avenue for future research.
References
- Andersen, M. (2020). Early evidence on social distancing in response to COVID-19 in the United States. unp. manuscript, SSRN 3569368.
- Béland, D. (2009). Ideas, institutions, and policy change. Journal of European Public Policy, 16(5), 701–718. https://doi.org/https://doi.org/10.1080/13501760902983382
- Bouckaert, G., Van Hecke, S., Galli, D., Kuhlmann, S., & Reiter, R. (2020). European coronationalism? A hot spot governing a pandemic crisis. Public Administration Review, 80(5), 765–773. https://doi.org/https://doi.org/10.1111/puar.13242
- Chudik, A., Pesaran, M. H., & Rebucci, A. (2020). Voluntary and mandatory social distancing: Evidence on covid-19 exposure rates from Chinese provinces and selected countries. unp. Manuscript Johns Hopkins Carey Business School Research Paper No. 20-03.
- Conyon, M. J., He, L., & Thomsen, S. (2020). Lockdowns and COVID-19 deaths in Scandinavia. unp. Manuscript SSRN 3616969.
- Eurostat. (2020). News release. Euroindicators 121/2020.
- Ghislandi, S., Muttarak, R., Sauerberg, M., & Scotti, B. (2020). News from the front: Estimation of excess mortality and life expectancy in the major epicenters of the COVID-19 pandemic in Italy. unp. manuscript medRxiv 20084335.
- Hale, Thomas, Angrist, Noam, Cameronblake, Emily, Hallas, Laura, Kira, Beatriz, Majumdar, Saptarshi, Petherick, Anna, Phillips, Toby, Tatlow, Helen, & Webster, Samuel. (2020-10-22). Variation in Government Responses to COVID-19 Version 8.0. Blavatnik School of Government Working Paper.
- Helsingen, L. M., Refsum, E., Gjostein, D. K., Loberg, M., Bretthauer, M., Kalager, M., & Emilsson, L. (2020). Trust, threats, and consequences of the COVID-19 pandemic in Norway and Sweden: A comparative survey. unp. manuscript medRxiv 20089953.
- Hunter, D. J. (2020). Covid-19 and the stiff upper lip – The pandemic response in the United Kingdom. New England Journal of Medicine, 382(16), e31. https://doi.org/https://doi.org/10.1056/NEJMp2005755
- Kamkhaji, J. C., & Radaelli, C. M. (2017). Crisis, learning and policy change in the European Union. Journal of European Public Policy, 24(5), 714–734. https://doi.org/https://doi.org/10.1080/13501763.2016.1164744
- Kobasa, D., Takada, A., Shinya, K., Hatta, M., Halfmann, P., Theriault, S., & Usui, T. (2004). Enhanced virulence of influenza A viruses with the haemagglutinin of the 1918 pandemic virus. Nature, 431(7009), 703–707. https://doi.org/https://doi.org/10.1038/nature02951
- Laliotis, I., & Minos, D. (2020). Spreading the disease: The role of culture. Covid Economics, 1(40), 180–210.
- Maier, B. F., & Brockmann, D. (2020). Effective containment explains subexponential growth in recent confirmed COVID-19 cases in China. Science, 368(6492), 742–746. https://doi.org/https://doi.org/10.1126/science.abb4557
- Medeiros, M., Street, A., Valladão, D., Vasconcelos, G., & Zilberman, E. (2020). Short-term covid-19 forecast for latecomers. unp. manuscript arXiv 2004.07977.
- Modig, K., & Ebeling, M. (2020). Excess mortality from covid-19. Weekly excess death rates by age and sex for Sweden. unp. manuscript medRxiv 20096909.
- Obinger, H., & Wagschal, U. (2001). Families of nations and public policy. West European Politics, 24(1), 99–114. https://doi.org/https://doi.org/10.1080/01402380108425419
- Parnell, D., Widdop, P., Bond, A., & Wilson, R. (2020). COVID-19, networks and sport. Managing Sport and Leisure, 25, 1–7. https://doi.org/https://doi.org/10.1080/23750472.2020.1750100
- Paulo, A. C., Correia-Neves, M., Domingos, T., Murta, A. G., & Pedrosa, J. (2010). Influenza infectious dose may explain the high mortality of the second and third wave of 1918–1919 influenza pandemic. PLoS One, 5(7), e11655. https://doi.org/https://doi.org/10.1371/journal.pone.0011655
- Plümper, T., Flores, A. Q., & Neumayer, E. (2017). The double-edged sword of learning from disasters: Mortality in the Tohoku tsunami. Global Environmental Change, 44, 49–56. https://doi.org/https://doi.org/10.1016/j.gloenvcha.2017.03.002
- Plümper, T., & Neumayer, E. (2020a). Sumer school holidays and the growth rate in Sars-CoV-2 infections across German districts. unp. manuscript medRxiv 20210773.
- Plümper, T., & Neumayer, E. (2020b). The pandemic predominantly hits poor neighbourhoods? SARS-CoV-2 infections and Covid-19 fatalities in German districts. European Journal of Public Health, https://doi.org/https://doi.org/10.1093/eurpub/ckaa168
- Pueyo, T. (2020). Coronavirus. The hammer and the dance. Medium. Retrieved March 19, 2020 from medium.com/@tomaspueyo/coronavirus-the-hammer-and-the-dance-be9337092b56
- Roser, M., Ritchie, H., & Ortiz-Ospina, E. (2020). Coronavirus disease (COVID-19) – Statistics and research. Our World in Data, https://ourworldindata.org
- Schmitt, F. J. (2020). A simplified model for expected development of the SARS-CoV-2 (Corona) spread in Germany and US after social distancing. unp. manuscript arXiv 2003.10891.
- World Health Organization. (2009). Pandemic influenza preparedness and response: A WHO guide document. WHO.
- Yan, B., Zhang, X., Wu, L., Zhu, H., & Chen, B. (2020). Why do countries respond differently to COVID-19? A comparative study of Sweden, China, France, and Japan. American Review of Public Administration. https://doi.org/https://doi.org/10.1177/0275074020942445