
ABSTRACT
Governments need to make choices over distributing resources and managing socioeconomic change, which can have geographically uneven effects. This may give rise to perceptions of institutional bias against left-behind places, treating them like they ‘don’t matter’, which has been widely linked to populism. Which voters develop this viewpoint remains unclear. This study explores citizens’ perceptions of geographic bias across five European democracies (Britain, Croatia, France, Germany, and Spain), using original surveys and granular contextual data. Our results reveal that perceptions of geographic bias are widespread. Clear majorities see government as biased towards rich areas and capital cities, while around half of respondents perceive bias against rural areas. Perceptions of geographical bias reflect individuals’ location, lack of trust in government, holding populist attitudes, and being more left-wing, but not being a supporter of a populist party. Our results suggest potential for mainstream left/liberal parties, not just populists, to exploit perceptions of bias.
Introduction
The central theme of recent developments in electoral geography across North America and large swathes of Western Europe is a backlash of the periphery – ‘the revenge of the places that don’t matter’ (Rodríguez-Pose, Citation2018), ‘forgotten’ and ‘left behind’ towns. These divides reflect electoral trends driven by shifting allegiances of residents from areas who feel marginalised, neglected and disrespected by government and political elites (Dijkstra et al., Citation2020; Kenny & Luca, Citation2021; Lago, Citation2022; McKay, Citation2019; McKay et al., Citation2021; Mitsch et al., Citation2021; Stein et al., Citation2021). Feelings of deprivation or disadvantage relative to other groups are central to citizens’ backing for populist leaders, parties and movements across many advanced democracies (e.g., Gest, Citation2016; Gidron & Hall, Citation2020). Geography is a key axis of grievance: areas subject to relative economic distress, social degradation or deficits in representation are vulnerable to a politics of resentment and, it follows, are fertile ground for populist politics (e.g., Bolet, Citation2021; Broz et al., Citation2021; Carreras et al., Citation2019; Castanho Silva & Wratil, Citation2021).
This ‘geography of discontent’ (Los et al., Citation2017) has been identified with right-wing authoritarian populism and thereby as a destabilising force in liberal democracies. Indeed, the populist potential of these resentments is clear. Contemporary forms of populism demand a democracy that ‘delivers what the people want’. Most commentators (Mudde & Kaltwasser, Citation2017; Müller, Citation2017; Urbinati, Citation2014) agree that at its core populism is an anti-phenomenon; it expresses itself by articulating strong resentment or opposition towards another. It entails a distinction between a pure and sovereign people and a corrupt and unresponsive political elite. Populism relies to a great degree on the capacity of leaders to manipulate resentment, based on real or perceived unfairness.
There is little doubt that the ‘geography of discontent’ is a potent catch-all phrase, but, as Ejrnæs et al. (Citation2023, this issue) note, it is ‘multidimensional in nature and used in various ways’. Moreover, we need to address an important puzzle identified by Ejrnæs et al. as to why geographically-based resentments develop in diverse places and not just the regions of greatest decline. For example, as Vasilopolou and Talving (Citation2023, this issue) point out, Euroscepticism is highest in middle-income not low-income regions. This article therefore seeks to advance our understanding of the geography of discontent in four ways.
Our initial theoretical contribution is to challenge the assumption in much current academic and non-academic discourse that discontent expressed by the public over the treatment of their place or community is an abnormal or even new feature of democratic politics. Perceptions of bias on the part of government against particular geographical areas, or against certain groups, may add fuel to populist mobilisation. However, we highlight the possibility that perceptions of geographic bias may not automatically lead to support for populist parties, and might instead reflect ‘normal’ distributional conflicts, long present in the politics of democracies. If politics is, as Lasswell (Citation1936) claimed, all about ‘ … who gets what, when, how’, then distributive politics and associated claims of perceptions of bias by government towards certain areas or groups might be integral features of the way that politics operates. Distributive policies are fundamentally about allocations of government goods and services to identifiable localities or groups. As political economy analysis of democracies has long argued, public authorities confer geographically concentrated benefits while diffusing costs across the electorate. Thus, while services and investments are focused on particular demographics and geographies, the tax system generally operates across the whole of the geographical space of a country (Golden & Min, Citation2013; Weingast et al., Citation1981). Areas can be winners or losers from ‘pork-barrel politics’, specific economic policies or spending on public services. Citizens in different areas or in different socio-economic positions, occupations or industries can also be relative winners or losers of economic forces that government has accepted or accelerated (e.g., Kriesi et al., Citation2006). From this perspective, perceptions of bias on the part of government might be both dispersed and widespread, as different areas or groups assess whether they have gained or lost in the game of distributive politics.
Our second, related theoretical contribution is to connect the geography of discontent debate with cleavage theory, which offers a more historical and socio-structural perspective to explain which geographic divides are likely to be politically salient in advanced post-industrial Western democracies (Ford & Jennings, Citation2020). Key cleavages are the urban-rural divide, a centre-periphery split between capital cities (centres of government and commerce) and other locations, and between richer and poorer areas, all reflecting the essential dynamics established by economic and political modernisation in the 19th and 20th centuries (Lipset & Rokkan, Citation1967). The literature on the geography of discontent largely consists of focused explorations of one divide at a time: we argue that a fuller picture is offered by the cleavages framework.
This development in turn leads to our methodological advance. To move forward, we need to develop more precise measures of, and greater clarity about, which areas are felt to be favoured by those in power and how this reflects feelings of distrust in government and politicians. We propose a new set of survey measures of felt geographic bias that tap perceptions of whether government favours urban or rural areas, capitals or non-capitals, or rich over poor areas. These measures will give us a fuller picture of the resentments felt by citizens, in that they all relate to biases in the distribution of resources and attention by government to particular areas. In short, they all address the issue of the potential for collective injustice and harm by elites. We develop and validate a new survey battery that is designed to measure perceived geographic bias, with a cross-national design including high-quality samples from five European democracies (Britain, Croatia, France, Germany, and Spain) and with postcode level identifiers allowing for precise contextual measures.
These three innovations in turn lead us to our fourth contribution: novel empirical findings. We show that perceptions of bias are widespread. Clear majorities of the public believe that government is biased towards rich areas and capital cities, while around half of respondents perceive there to be bias against rural areas. These are reflective of a general perceived bias that can be distinguished from ‘place resentment’ focused on the perceived treatment of one’s own area. Perceptions of geographical bias reflect individuals’ location, their lack of trust in government and being more left-wing, but not being a supporter of a populist party – several of these predictors differing from those of place resentment. There are variations in how these relationships play out in different countries and we explore these in analysis too, reflecting on the importance of context. In the debate about the drivers of resentment thus far much of the debate has been over whether economic factors (individual or community based) or social factors (including loss of status or standing) dominate. Our findings suggest that political factors also have a role to play, including lack of trust and ideology.
The geography of discontent: exploring the politics of perceived bias
We first explore the cleavages that underlie perceptions of geographic bias and then explore the contextual and individual factors that we believe make certain people in particular areas more likely to perceive bias than others. For Cramer (Citation2016, pp. 5–6), rural resentment is shorthand for ‘a sense that decision makers routinely ignore rural places and fail to give rural communities their fair share of resources … that government and public employees are the product of anti-rural forces’. She argues that rural resentment has three components: rural residents feel looked down upon by elites (cultural), believe their area does not receive its ‘fair share’ (distributive), and see their interests and concerns as neglected by those in power (representational). Resentment is thus based on the idea that your community or area is being treated less well than others. In that sense it is a collective expression of relative deprivation. This idea draws from the social psychological theory of reference groups and, in particular, the tendency of people to frame grievances relative to the setting in which they are situated (Runciman, Citation1966). Comparisons could be made over time (‘my area has got worse’) or geographically (‘my area is worse off than other areas’). Beyond relative deprivation, some focus on the emergence of feelings of hostility towards those areas that are better off than your own.
Recent studies have made efforts to explore these sentiments in survey research. Munis (Citation2022, pp. 1057–1058) develops a measure of place resentment, as ‘hostility towards place-based outgroups perceived as enjoying underserved benefits beyond those enjoyed by one’s place-based ingroups’, showing how place resentments apply not just in rural areas of the US but exist ‘with important variation – across geographic contexts’. Borwein and Lucas (Citation2022) take a similar approach in Canada. de Lange et al. (Citation2022) shift focus to the Netherlands, where they find that ‘regional’ resentment is both a rural and peripheral phenomenon. In the Dutch context, Huijsmans (Citation2022) and de Lange et al. (Citation2022) also identify a correlation with populist attitudes while showing that regional/place resentment is meaningfully different to populism.
We agree with the essential insight that resentment stems from perception of the favouring of one area over another. One possible basis for those comparisons relate to long-standing cleavages in industrial societies. Lipset and Rokkan (Citation1967) show that national politics in industrialised democracies reflected underlying socio-economic structures, group identities, interests and conflicts (Bartolini & Mair, Citation1990, p. 215). Those in turn were a response to powerful historical developments in these countries, namely the rise of the nation state, the industrial revolution, and the growing secularisation of society. These developments provided the seeds for underlying conflicts in society expressed through politics and political parties. The rise of the nation state produced a (territorial) cleavage between the central state and peripheral communities. The industrial revolution underpinned both a (geographical) urban/rural cleavage and a (socio-economic) worker/employer or labour-capital cleavage. These cleavages provide the breeding ground for the perception of government biases that drive place-based resentment: periphery versus centre, rural versus urban, and rich versus poor. As a basic shorthand, we refer periodically to poor, rural and peripheral places as ‘left behind’, reflecting not our normative judgement but the weight of contemporary public and elite discourses treating them as relative ‘losers’ of change (Pike et al., Citation2023).
Cleavages have changed and developed since the original formulation by Lipset and Rokkan (see Ford & Jennings, Citation2020 for a recent review). Many commentaries observe that once ‘frozen’ cleavages have thawed, leading to dealignments and realignments in the structure of political competition across many advanced democracies, especially in Western Europe and North America (Dalton, Citation2018; Kriesi, Citation1998; Kriesi et al., Citation2006). Others (Elff, Citation2007; Elff & Rossteutscher, Citation2011; van der Brug et al., Citation2009) argue that the religious division is decreasingly in political importance, except in a few cases. The rise of the EU and the broader forces of globalisation has altered the standing of the nation state, and the processes of deindustrialisation and the development of service-based economies made class cleavages more complicated. In this context, geographic cleavages, which cross-cut individual demographics, can play a role for voters who may be less clearly ‘sorted’ in other ways. Of course, these cleavages may themselves have evolved (for example, through more geographically mobile voters) but, given the substantial evidence of geographic divides in recent voter behaviour, they would seem to have sustained or even enhanced relevance.
Our approach differs from existing studies, which either (a) ask respondents whether their area is under-represented or (b) ask respondents in rural areas whether rural areas are under-represented and those in urban areas whether urban areas are under-represented. Instead, we argue that anyone can share a sense of government’s bias against rural, urban or peripheral places: hence, we pose the same questions to all respondents. As an average across societies, we expect that there will be a sense of bias against such ‘left-behind places’. Leaving aside actions that may reinforce or challenge perceptions of bias, it is highly intuitive for voters to see central governments and their ministers, who command high incomes and social positions and are geographically concentrated in (small parts of) a national capital, and to identify them with affluent, urban and core areas rather than as champions of the left-behind. However, we anticipate that certain characteristics will be associated with stronger perceptions of geographical bias. Firstly, we anticipate that political attitudes and identities of individuals may predispose them to perceive geographical bias. Secondly, we posit a role for contextual explanations: where people live should be related to their perceptions of geographical bias.
Individual-level explanations
We contend that perception of bias may be related to individual political attitudes and identities. A recurring theme in the literature on inequality suggests that those on the political left (or ‘liberals’ in American studies) perceive greater degrees of societal inequality (e.g., Bartels, Citation2008; Volpi and Giger, Citation2022): indeed, Chambers et al. (Citation2014) find that American liberals overestimate income differences and are less accurate in their perceptions than conservatives. No similar evidence exists for perceptions of spatial inequalities, but it is at least plausible that the same applies given the underlying cognitive mechanisms (Volpi and Giger, Citation2022). Research also suggests that individuals on the left will not only perceive more inequality, but will attribute this more to structural causes than those on the right. For example, whereas right-wingers (who tend to justify rather than challenge social systems, see Jost, Citation2020) attribute the underlying roots of poverty to misbehaviours such as laziness and drug use, left-wingers often blame ‘biased government policies’ (Weiner et al., Citation2011). Applying the same expectations to geography, we develop our first hypothesis:
H1 The more left-wing an individual is, the stronger their perception of geographical bias.
H2 The higher an individual's level of populist attitudes, the stronger their perception of geographical bias.
H3 Perceptions of geographical bias are stronger among supporters of populist parties.
H4 The lower an individual's trust in the government, the stronger their perception of geographical bias.
Contextual explanations
Straightforwardly, although people in all areas will likely perceive biases toward affluent urban centres, we expect perceptions of pro-urban bias to be stronger in rural areas; perceived pro-capital bias to be stronger in the periphery; and perceived bias towards affluent areas to be stronger in less-well off localities. In other words, for perceived bias, context matters because the sense of ‘bias against’ areas like one’s own in poor/rural/peripheral areas is not matched by an equally strong sense of ‘bias towards’ in rich/urban/central areas. This is justified on multiple grounds: material, psychological, and political.
One way these perceptions of geographic bias may form is through the accumulation of everyday experiences of people’s own areas and other areas, and how the two compare. This can inform a mental picture of how well government is serving different areas. As discussed by Ejrnæs et al. (Citation2023, this issue), processes of ‘benchmarking’ are likely to lead to the development of geographically-based resentments and as Schraff and Pontusson (Citation2023, this issue) show, voters’ choice of benchmarks influences how context links to resentment. Rural and peripheral areas are widely recognised to face significant structural challenges in terms of social and economic outcomes and the delivery of public services. Challenges in rural peripheries increase the frequency of negative experiences. For example, well-documented difficulties in health access (Eurofound, Citation2019) can become vivid through experiences like an ambulance for a friend or family member being slow to arrive. Positive experiences are known to be less memorable than negative ones (Rozin & Royzman, Citation2001), so areas with better public services and socio-economic conditions may not acquire an equivalent sense of government effectiveness. Furthermore, people in rural peripheries may be better positioned to make comparisons (even if flawed or partial), such as between public transport in cities and elsewhere, that could be interpreted as stemming from government bias. Rural-dwellers are more likely to work and spend leisure time in large towns and cities than the converse.Footnote1 Urbanites, however, might be more familiar with inequalities within the ‘centre’ – even if their specific neighbourhood is affluent, it likely rubs shoulders with a struggling one (OECD, Citation2018). These tendencies may lead to heightened perceptions of bias against in the left-behind areas, without an equivalent sense of bias towards in affluent, urban centres.
However, a perhaps more powerful explanation would include not just what information people receive, but how they process it. For most people, their geographic community defines one of their ‘in-groups’. Psychologically, people are motivated to maintain a positive image of their in-groups (Jost & Banaji, Citation1994; Tajfel, Citation1981). Positive features or changes are more likely to be attributed to the local area’s qualities (its people, businesses, etc.). But those facing more negative situations, such as high unemployment, will reject an internal explanation that could reflect badly on the in-group (e.g., ‘local people are lazy’) and prefer an external locus to explain problems (e.g., ‘government is biased against us’). In line with this, people are much more likely to attribute responsibility to the government where the local economy is perceived to be worse than average (Johnston & Pattie, Citation2002). This again suggests downscale rural peripheries will feel ‘bias against’ while core areas will not sense ‘bias towards’.
Yet we should not neglect the role of elites, especially local and national politicians. In particular, they ensure narratives of bias that can make sense of problems and inequalities are easily cognitively available to voters. Modern governance typically involves vertically fragmented authority, distributed between central states and local government, allowing both to engage in ‘blame avoidance’ (Hood, Citation2010) when problems arise. To escape electoral punishment, local leaders often blame the centre (Mortensen, Citation2013), often in emotive ways that invoke bias. In addition to local politicians, national parties and politicians (and perhaps populists especially) are prone to using bias rhetoric in targeted areas. For example, Italy’s Northern League managed to ‘frame the political elite as anti-northern’ (Woods, Citation2014) while, at the start of his 2019 election campaign in ‘Red Wall’ seats in the North of England, Boris Johnson appealed to local desire to ‘force politicians in Westminster to listen to you, not just London and the southeast’ (Ford et al., Citation2021). Between these local and national actors, the ‘left-behind’ voter is exposed to narratives of bias towards affluent, urban centres – narratives which are psychologically appealing and provide explanations of their lived experience.
Based on this discussion, we propose the final set of hypotheses:
H5a Living in a rural area is associated with stronger perceptions of geographic bias.
H5b Living in a more peripheral area (further from the capital) is associated with stronger perceptions of geographic bias.
H5c Living in a relatively deprived region is associated with stronger perceptions of geographic bias.
Data and method
Survey data
In 2020 and 2021, we conducted original online quota surveys in five European countries (Britain, France, Germany, Spain, and Croatia) as part of a wider cross-national project (see ). Quotas for each sample were based on the demographics of the country’s adult population, including those without internet access. The British survey (December 2020) served as a pilot for the later surveys (September-November 2021).Footnote2 Some of these cases are well studied in terms of geographical divides (e.g., Britain, France, Germany), though others are often neglected (e.g., Spain and Croatia) due to a focus on Western/Northern Europe. Our surveys included novel questions about geographic bias, precise geographic identifiers of respondents, and items on political attitudes and behaviour. Case selection was largely driven by the needs of the wider project, but we note that our cases have differing profiles in terms of their electoral system (and degree of regional autonomy), proportion of the population that lives in rural areas vs the capital city, and levels of economic development (see ). This context is beneficial for the generalisability of the analysis to other advanced democracies. We include an extended discussion of the cases in Appendix A.
Table 1. Original survey details.
Table 2. Summary of country case information.
Outcome variables
To measure perceptions of bias, we develop and validate an original survey battery. Our measures relate to the three key geographic cleavages we have discussed: urban-rural, centre-periphery, and rich-poor areas. We consider three important questions. First, what is the dimensionality of perceived bias: do voters perceive three distinct biases relating to these cleavages, or one over-riding bias (against ‘left-behind places’ collectively)? Second, can perceptions of geographic bias be distinguished from the kinds of ‘place resentments’ already discussed and measured in the literature? Finally, can perceptions of geographic bias be distinguished from broader discontents with the political system, namely lack of trust and populist attitudes?
Each survey contained the following item: ‘Please answer on the following scales whether you think government is biased in favour of or biased against a particular type of place, or if you don’t think it is biased.’ The question used a seven-category scale from 1 ‘extremely biased in favour’, 4 ‘not biased’, to 7 ‘extremely biased against’. The six types of area were:
Rural areas
Urban areas
Areas far from [capital]
[Capital] and nearby areas
Poor areas
Rich areas
To test for the dimensionality, we run a principal components analysis on the three geographic bias measures (n = 5502). Full details are available in Appendix B. One principal component factor was retained, accounting for 63% of the variance. All three variables loaded strongly (.72 for urban bias, .82 for centre bias, and .84 for rich bias). The extracted factor scores, rescaled to run from 0 to 1, form our central measure of perceived geographic bias, which we hereon abbreviate as ‘PGB’. However, since the unique variance is not insignificant (especially for perceived urban bias), we also conduct analysis using the three specific scales as dependent variables.
To test whether PGB can be distinguished from ‘place resentment’ and broader political discontents, we conduct a second PCA (n = 4499). We measure place resentment via three questions designed to tap its political, economic and social dimensions (documented by Cramer, Citation2016; Munis, Citation2022 and Huijsmans, Citation2022). The political item presents a statement that government cares ‘less about people in my area than people in other parts of the country’. The economic item asks people to state whether, compared to other parts of their country, their area is (much/somewhat) poorer or richer than average, or neither (i.e., perceived relative deprivation). The social item asks people to position on a scale how important ‘people in my area’ are considered to wider society (adapting an item developed by Gest et al., Citation2018), which speaks to perceptions of a lack of social recognition and status. To capture broader discontents, we introduce measures of confidence in government, politicians and parties and a populism item drawn from Akkerman et al. (Citation2014). Full details can be found in Appendix B.
displays post-rotation factor loadings. Three principal component factors were retained, accounting for 59% of the variance. We follow the .40-.30.-.20 rule to interpret the loadings: ‘satisfactory variables ‘(a) load onto their primary factor above 0.40, (b) load onto alternative factors below 0.30, and (c) demonstrate a difference of 0.20 between their primary and alternative factor loadings’ (Howard, Citation2016, p. 55). PGB items do not load on other factors, nor do other items load on the bias factor. The three ‘place resentment’ items loaded onto another distinct factor, which gives us greater confidence in treating PGB as an attitude distinct from place resentment. Trust and populism items also do not load with PGB, so we can meaningfully include them in our models of bias and interpret the associations (as any shared variance is not due to PGB capturing the same underlying disposition as trust or populist attitudes).
Table 3. Principal components analysis, polychoric matrix, Varimax rotation (n = 4499).
Contextual variables
In our surveys, respondents are linked to postcode areas (or in the case of Britain, lower super output areas: LSOAs)Footnote3 and European NUTS3 regions (European Union, Citation2022; Office for National Statistics, Citation2022). Postcode areas, LSOAs and even NUTS3s are more precise geographical units than those available in other pan-European studies such as the European Social Survey, which uses NUTS2 or NUTS1 in most countries. For example, France has 18 NUTS2 regions (average population 3.8 m), 101 NUTS3 regions (672k) and 6173 postcodes (11k); there are 34,753 LSOAs in England and Wales (population 1.7k). LSOAs are not available for Scotland, so these cases are dropped from the British sample.
We measure geographic and economic context at these levels. Firstly, distance to the capital is calculated as the crow-flies distance from the postcode/LSOA centroid, relative to the farthest point on the mainland from the capital. Secondly, urban-rural status is assigned according to official classifications – the DEGURBA code of the postcode (European Union, Citation2022) or Rural-Urban Classification code of the LSOA (Office for National Statistics, Citation2022) – and recoded as binary. Thirdly, drawing on OECD data, relative economic context is measured by the 2018 median income for the NUTS3 region as a percentage of the median income for the whole country (OECD, Citation2018).
Method
Our main analysis is based on regression using the full sample, pooled across countries (n = 3840). We use multilevel linear regression, with individuals (Level 1) nested within postcode areas (Level 2). Table C3 reports that around 43% of variance in perceived bias is explained at postcode level, much more than at alternative, less granular geographies (such as NUTS-2 and NUTS-3). Therefore, we select postcode as the only higher level for our main analysis. The data is relatively sparse at level 2 (with roughly 1.3 respondents per postcode), but this is liable only to increase standard errors on level 2 coefficients rather than biasing the coefficients (Clarke, Citation2008). We display results using country as a higher level as a robustness check (see Appendix D). Country-pooled models are weighted to equalise impact of cases across countries.
As well as contextual variables, we include several measures of political values and preferences. We include self-reported left-right placement on a scale from 0 (left) to 10 (right). Our measure of political trust asks about confidence in ‘the government in your country'. Populist attitudes are measured via an item drawn from Akkerman et al. (Citation2014), ‘The political differences between the elite and the people are larger than the differences among the people’. This is related to the populist worldview of ‘popular sovereignty combined with a negative view of representative government’ (Akkerman et al., Citation2014), and they show this item loads with others on a single ‘populism’ factor. Due to space constraints, we could not include a full populism battery (which would be preferable), but using just one item is, if anything, liable to set a more conservative test of populism's relationship to PGB. All three attitudinal variables (ideology, trust and populism) are treated as continuous for simplicity of hypothesis testing and presentation, and rescaled to 0–1 (min–max) to enable easier comparison of associations.
We measure party support via party identification items (which party people said they felt closest to) in Croatia, France, Germany, and Spain, and via voting intention items (which party people were most inclined to support) in Britain. This forms the basis for two predictors. Parties were coded as populist (1) or not populist (0), based on data from The PopuList 2.0 (Rooduijn et al., Citation2020) and Chapel Hill Expert Survey (Jolly et al., Citation2022), and Wikipedia classifications of parties that were not listed in either dataset (usually because they were too small or too recent). Appendix E explains and shows the populism coding by party. As a control, respondents were coded as supporting parties in government (including junior coalition partners), opposition parties or none.Footnote4 We also include demographic controls in the model: age, gender and education (degree vs. non-degree), religion (none vs any), marriage (unmarried vs married), and working status (employed, unemployed, retired, other), which are associated with various political discontents, political behaviour and geography.
Lastly, we include dummy variables for regions subject to territorial-nationalist conflict with central government. We identify regions where >10% of people voted for regionalist parties in each of the three most recent prior elections for which data was available (Massetti & Schakel, Citation2016): specifically, Bavaria, Aragon, the Canaries, Catalonia, Galicia, the Basque Country, Navarre, and Wales (Northern Ireland and Scotland, areas of separatist strength, are not in the sample). We note these are mostly in the geographic periphery, so controlling for regionalism thereby increases the likelihood of accurately estimating coefficients for distance. We also introduce a dummy for former East Germany, which has a unique position of being physically close to the capital but in other respects (weak economy, strong identity, sense of neglect) resembles a peripheral region (Patton, Citation2019).
Results
We proceed through our results in five steps. First, we descriptively analyse the distribution of survey responses on the individual bias questions to understand the prevalence of the perception of different biases. Second, we show how average PGB vary between countries. Third, we explore the predictors of PGB across the whole sample, using multilevel linear models, which forms the most important part of our results section. Fourth, we compare the predictors of PGB with those of place resentment. Finally, we present plots for individual countries showing the relationship between each independent variable and PGB, identifying commonalities and divergences in the predictors.
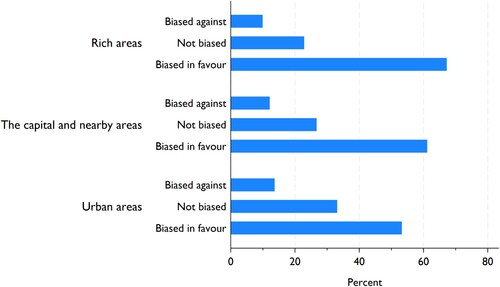
We begin by analysing the distribution of survey responses for the entire sample, pooled across countries. (We present only the individual items at this stage, since the PGB factor scores cannot be easily interpreted). In , values above zero indicate a perceived bias towards this kind of area, values below zero a perceived bias against, and zero meaning there is no perceived bias for or against. groups responses along these lines, showing the prevalence of bias perceptions but no information on how extreme people think the biases are. Overall, perceptions of bias appear highly prevalent. There was most consensus around government’s bias towards rich areas, with 67% of respondents taking this view: 14% of respondents are at the maximum +6 value, meaning they responded ‘extremely biased in favour’ for rich areas and ‘extremely biased against’ for poor ones. Almost as common, however, were perceptions of ‘central’ bias, towards the capital and surrounding areas, with 61% holding this opinion. Perceptions of urban bias, at around 53%, were less common, and rarely held as intensely. However, few perceived an opposite rural bias; while a further 33% of responses were at 0, meaning no perception of bias. The distribution of the original six items can be found in Appendix F.
Figure 1. Distribution of perceived geographic biases (ungrouped), pooled sample.
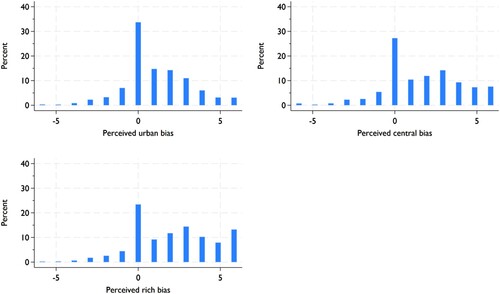
Figure 2. Distribution of perceived geographic biases (grouped), pooled sample.
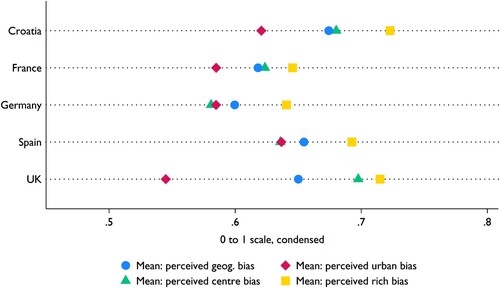
There is clear variation by country in perceptions of bias. We rescale the individual perceived biases from 0–1 (to match the scale for overall perceived bias), calculate the country-mean of each, and plot these in . French and German respondents perceive their governments to exhibit fairly low levels of biases. In Germany and Spain, perceived urban and centre bias are very similar. But in Croatia and especially Britain, perceptions of bias towards the centre specifically are much higher than towards urban areas generally. In Britain, perceptions of centre bias rival those for rich bias, but British respondents are outliers in their weak perception of urban bias.
Figure 3. Mean perception of perceived geographic bias and its components, by country.
We move now to the key part of our analysis: exploring the predictors of PGB, employing multilevel linear regression (see ). In Column 1, we include only geography variables (rurality, distance from capital, and regional relative deprivation). In Column 2, we add the remainder of our key independent variables. In Column 3, we add all other individual-level controls, and in Column 4, we add dummies for country and relevant region dummies. We consider the findings of Column 4 to be most robust and therefore place greatest weight on these for hypothesis testing; however, in general, we should be more confident of a predictor’s association with perceived bias if it also occurs in more weakly controlled models (and hence also ascribe some importance to Columns 1, 2 and 3).
Table 4. Linear mixed regression of perceived geographic bias.
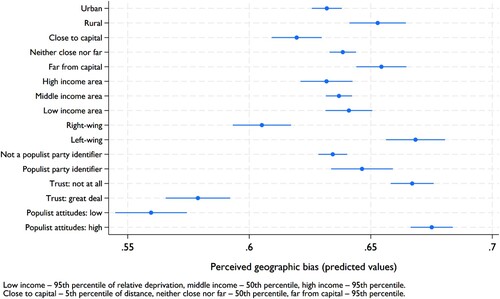
First, our theory anticipates a role for individual-level political attitudes and identities. H1 states that the more left-wing, the stronger the perception of bias. Our models find support for this expectation: moving from right to left in ideological self-placement has positive and highly significant associations (β = 0.06, p < 0.001) with PGB. Next, H2 posits that the higher the level of populist attitudes, the stronger the perception of geographical bias. This expectation was also supported, as moving from the least to the most populist position was associated with significantly higher PGB (β = 0.12, p < 0.001). Given that all variables run from 0 to 1 (whether scale or dummy), we can determine that this is the strongest association in our model.
Perhaps surprisingly, given this association with populist attitudes, we did not find similar support for H3 ('perceptions of bias are stronger among supporters of populist parties'). Populist party identifiers were no higher in PGB than non-populists. Given the risk of multicollinearity between the populist attitudes and identification measure, we specified models retaining only the party ID measure, but still found no association.
H4 states that the lower the level of trust in the government, the stronger the perception of bias. We find considerable support for this expectation, as increased trust was associated with lower PGB (β = −0.09, p < 0.001).
Finally, we posited that contextual factors would matter. Respondents in rural postcode areas have higher perceived urban bias than those in urban postcode areas (β = 0.02, p < .01), supporting H5a (‘Living in a rural area is associated with stronger perceptions of geographic bias’). Column 4 also supports H5b (‘Living in a more peripheral area (further from the capital) is associated with stronger perceptions of geographic bias’), with relative distance having a highly significant association with PGB (β = 0.04, p < 0.001). The picture is slightly less clear for H5c (‘Living in a relatively deprived region is associated with stronger perceptions of geographic bias’). While there are significant associations in Columns 1–3, these disappear when region/country dummies are added.
presents all the above associations in graphical form. Readers should also note our robustness checks using country-level clustering and NUTS-3 level clustering, which generally increase our confidence in our results (see Appendix D).
Figure 4. Marginal predictions of perceived bias, based on Model 4 ().
It may be informative to understand whether the predictors are the same over different perceived biases. Table C1 (Appendix) shows results of fully specified models of perceived urban, central and rich area bias. All the attitudinal predictors have consistent associations with perceived bias across items, albeit with slight variations in size. We still find no association with populist party support. Associations for geography show most divergence. The sole geographic predictor of perceived urban bias is living in a rural area (β = 0.03, p < 0.001). Perceived central bias is predicted by relative deprivation and peripherality, the latter having a very strong association (β = 0.09, p < 0.001). Perceived rich bias is, curiously, predicted by rurality/peripherality, but not relative deprivation. There is some evidence then that respondents have both meaningful overall bias perceptions and specific bias perceptions shaped by living in particular (rural/peripheral) contexts.
One striking observation, based on the marginal predictions of these models (which we could not make from , as there is no true midpoint) is that all groups on average perceive some bias towards urban, central and rich areas. This goes for urban areas (perceiving pro-urban bias) and areas close to the capital (perceiving pro-centre bias), while perceptions of pro-rich bias in rich areas are especially high (+2 on the −6/+6 scale). Figure C1 (Appendix) shows the marginal prediction plots.
We earlier showed that PGB and place resentment could be empirically distinguished. In our modelling, we also find that the profiles of people with high place resentment are rather different from those with high PGB. We present a condensed version of the results in (for full results, see Table C2, Appendix). We find that place resentment is associated with low trust, but unlike PGB, is not associated with left-wing voters or those with populist attitudes. Most of all, it is associated with economically left-behind places (the strongest predictor, with β = 0.08 and p < 0.001) and other geographic dimensions matter less (indeed, rurality is associated with less place resentment, ceteris paribus). Focusing on perceptions of bias therefore offers a very different (which is not to say superior) picture of the ‘politics of place’ to the more common focus on place resentment.
Table 5. Linear mixed regression of perceived geographic bias and place resentment.
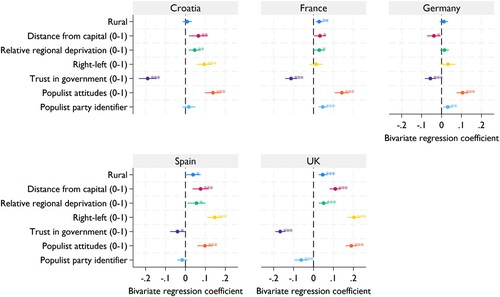
Given that we have five countries in our sample, we can compare the extent to which the predictors of PGB are consistent or divergent. This approach acts as a robustness check on our main analysis (to ensure that overall associations between PGB and a predictor are not driven by single countries, for example) and a substantive line of enquiry: such an analysis can help us understand how the politics of place is contested in individual countries. Due to the small number of cases for individual countries (after accounting for missingness) we restrict ourselves to bivariate analysis.
Results are shown in . Due to space constraints, we do not comment on all coefficients, but some notable findings emerge. Across all countries, we find a consistent negative association with trust and positive association with populist attitudes. This makes sense given that our theorised mechanism for these factors is not contextually specific but based in an understanding of trust/populism as dispositions. On the other hand, populist party identification has inconsistent associations with PGB (positive in France/Germany, null in Croatia/Spain, and negative in the UK).Footnote5 This makes sense given that populist parties (even within a single party family) can have very different voter bases between countries (Rooduijn, Citation2020). Notably, there are also some differences in associations with geography. Germany is especially notable for the fact that neither rural areas nor deprived areas are higher in PGB, while PGB is associated with living closer to the capital (against expectations); we return to these results in the Discussion.Footnote6
Figure 5. Bivariate relationship between selected predictors and perceived bias, by country.
Discussion
This paper set out to explore and explain perceptions of government’s geographic biases along three major place-based cleavages: urban-rural, centre-periphery, and richer-poorer. We conducted an original cross-national survey using pairs of items to measure perceptions of bias against or in favour of particular types of area over its opposite. We validated a scale of perceived overall geographic bias, and conducted regression analysis of the contextual and individual-level drivers of these perceptions. Our approach offers a theoretical advance through linking resentment to feelings of geographic bias by government. We support this by developing new survey measures drawing on contextual data at a lower areal level as well as individual level predictors.
Firstly, descriptive statistics illuminate the prevalence of bias perceptions and how this compares across countries. Across five countries, nearly 7/10 respondents think government is biased towards richer areas and 6/10 perceive bias towards the capital and its environs. However, for pro-urban and anti-rural bias, which has been central to much of the previous literature, we observe a weaker consensus (one in two) and lower intensity of belief.
We posited several hypotheses around individual-level political views and perceived bias. The first hypothesis (H1), which anticipated that more left-wing individuals would perceive more bias, was supported. To some extent, government bias can act as a structural explanation for disadvantages faced by left-behind, rural and peripheral areas: as those on the left generally blame inequalities on systemic factors, this association can be viewed as consistent. However, this finding should be contrasted with Cramer’s (Citation2016) finding that ‘rural resentment’ was associated with citizens’ preferences for small government (a right-wing attitude).
We anticipated links between populism and perceptions of geographical bias, through mechanisms of populist attitudes (H2) and identification with populist parties (H3). The former expectation was supported, and held across all countries. This reinforces the findings of de Lange et al. (Citation2022) and Huijsmans (Citation2022), who both find relationships between populist attitudes and place resentment. However, we found no statistical connection between populist party identification and perceptions of geographical bias, even when populist attitudes (a potential confounder) were removed from the model. This is somewhat against the grain of the literature, but not necessarily surprising. For example, the anti-elitism that we suspected might fuel perceptions of bias is also found among non-populist voters (Akkerman et al., Citation2014). We do, however, find support for H4, which posited that the lower the level of trust in government, the stronger the perception of geographical bias. This is consistent with claims that the geography of discontent (such as in populist voting) represents an expression of lack of trust in government.
Finally, in H5 (a–c), we predicted that the relative ‘losers’ of cleavage politics would have stronger perceptions of bias. We find that rurality and peripherality are linked to perceived bias but, surprisingly, regional relative deprivation was a weak and inconsistent predictor. However, a key finding is a degree of self-awareness among ‘winners’: even urban areas perceive pro-urban bias by government, areas closest to the capital perceive ‘centre’ bias, and the most affluent areas perceive bias towards richer areas. Previous literature suggests urban centres, as part of their weaker ‘place consciousness’ (Munis, Citation2022), have weaker perceptions of being politically underrepresented: our findings suggest that they may feel over-represented in some cases.
We also conducted exploratory analysis of cross-country variation in perceptions of geographic bias and in their correlates, a step beyond existing single-country studies of resentment (e.g., de Lange et al., Citation2022; Munis, Citation2022). The strength of feeling around different cleavages varied by country: for example, Britain is a clear outlier, with an especially weak sentiment of pro-urban bias. By contrast, people in Britain hold strong beliefs in government’s bias towards the capital, rivalled only by Croatians. This sense of central dominance may be related to two factors: (a) the size of London/Zagreb – each much larger than Madrid and Berlin as a share of the population, and (b) the low level of authority granted to their regions. It is also noteworthy that in Germany, rurality, relative deprivation and peripherality were not associated with perceived bias as they were in other countries. This may suggest that sentiments of neglect and bias by the centre have been mitigated by its more limited role in distributing resources to and making decisions for other regions, given the structure of its federal government.
The main limitations of our study might be identified as the following. Our survey considers only five countries in only one global region (Europe), and the empirical findings cannot be taken as representative of any category of nations (be they ‘Western’, ‘democracies’, ‘European’ and so on). With so few countries, we cannot ascertain any systemic features that aggravate or mitigate the sense of bias, and our comments above regarding regional authority and federalism are speculative.
Most importantly, our analysis is correlational. While geographic location is exogenous to perceived bias, trust, populism, ideology and populist attitudes are not and there is a clear possibility of reverse causality. For this reason, our hypotheses and analysis are framed in terms of ‘associations’ rather than ‘effects’. The correlational explorations are nonetheless worthwhile in themselves, particularly as they highlight that the voters concerned with government’s unfairness towards left-behind places are not overwhelmingly (as they have been characterised in some literature) right-wing populist supporters. Causal evidence is not required for such a claim, although it would undoubtedly be valuable to develop panel studies and experiments, allowing us to better understand the causes and consequences of place-related political attitudes.
Conclusion
Perceptions of geographic bias of government are widespread. Clear majorities believe that government is biased towards rich areas and capital cities, while around half of respondents perceive there to be bias against rural areas. These attitudes are distinct from ‘place resentments’ focusing on the perceived treatment specifically of the area one lives in, and have different predictors. Our analysis shows that the strongest predictors of perceptions of geographical bias are lack of trust in government, populist attitudes, holding left-wing ideological views, and living in rural and peripheral (but not deprived) areas.
Interestingly, we do not find any association between being a supporter of a populist party and perceiving bias against particular areas. This finding may suggest that, although populist politicians seem more comfortable railing against an affluent metropolitan elite, the argument around neglected places is not ‘owned’ by populists. Instead, we find that left-wing ideology is a strong predictor of perceived geographical biases. Perhaps, then, deploying the argument that government is rigging the system towards some areas over others can also be an extension of classic left opposition to inequality. For some left-liberal parties, there is a potential dilemma here in not alienating a base of urban or capital city degree-holders by appearing to attack their privilege (Cruddas, Citation2019). For example, in Britain, some Labour figures fear that using rhetoric around government’s London-bias could hurt the party’s prospects (Sleigh, Citation2021). However, we find no group of voters (including urban/degree-educated ones) that are firmly at odds with the idea that government exhibits bias towards particular geographical areas. As such, an opportunity for political mobilisation remains open as much to the left as the right, though the crux may lie in identifying authentic messengers. Nonetheless, it is important to remember that resentments are multifaceted: it is likely that populists are best-placed to capitalise on elements centred on perceptions of low status and recognition by others in society, which can be mobilised by rhetoric against ‘liberal metropolitan elites’ avoided by most mainstream parties.
Despite the insights of this paper, much remains unknown and requires future investigation. Our original survey instruments appear to work well, but there may be other formulations that better capture feelings of resentment about the attention, resources, or status afforded to particular areas. There may also be other groupings of regions or area types that better encapsulate the specific geographical cleavages in each country. There would also be value in using open-ended responses and qualitative methods such as focus groups to understand how citizens come to these judgements, and whether and how they inform political choices. Our survey focuses on national governments, whereas attitudes to the European Union and potentially other supranational organisations can follow different regional and individual-level patterns (Dellmuth, Citation2023, this issue). Future developments of this approach will help us to understand the causes and consequences of perceptions of bias against left-behind places, and how these underpin the geography of discontent.
Supplemental Material
Download Zip (313 KB)Acknowledgements
We would like to thank the organisers of the JEPP workshop on Regional Inequality and Political Discontent, where we received excellent feedback towards the paper. In particular, Sven Hegewald, Francesco Nicoli, Lisa Dellmuth, Dominik Schraff and Jonas Pontusson provided detailed and helpful comments. We also thank our survey partners at YouGov (Patrick English, Anthony Wells, Abigail Axe-Browne and Tanya Abraham) and Ipsos MORI (Gideon Skinner, Federica Curcurú, and Ekaterina Mincheva). We would also like to thank the three anonymous reviewers, whose comments helped us improve the paper substantially.
Disclosure statement
No potential conflict of interest was reported by the author(s).
Additional information
Funding
Notes on contributors
Lawrence McKay
Lawrence McKay is a British Academy Postdoctoral Research Fellow in Politics at the University of Southampton.
Will Jennings
Will Jennings is Professor of Political Science and Public Policy at the University of Southampton.
Gerry Stoker
Gerry Stoker is Professor of Politics and Governance and Chair of Governance at the University of Southampton.
Notes
1 Concrete data is rare, but Canadian census data reveals rates of rural-to-urban commuting were 16x higher than urban-to-rural commuting. See Harris et al. (Citation2008).
2 All respondents gave their informed consent to be surveyed. Both surveys received ethical approval by the University of Southampton Faculty of Social Sciences Ethics Committee, ERGO code 61735.A1.
3 The UK is no longer included in European statistical products. Hence, we find a similar UK statistical geography and apply a similar process. LSOAs are only available for England and Wales, not Scotland or Northern Ireland.
4 The survey fieldwork in Germany was conducted shortly after the German federal elections in 2021, but the Scholz government had not yet been formed, so CDU/CSU and SDP are treated as ‘government’ partisans (as the parties forming the coalition between 2017 and 2021).
5 The specific finding for Great Britain here may be a ‘Brexit effect’, as populist parties in the UK are overwhelmingly strongly Eurosceptic in their own position and supporter base. Brexit, UKIP and BNP supporters may have been placated by government Brexit ‘success’ at this point in time, and more inclined to believe that the government could deliver ‘levelling-up’ of left-behind regions in Britain (a key post-Brexit promise).
6 A specific factor driving this unexpected effect for distance, besides the federalism argument, may be the unique position of East Germany in being geographically central yet left-behind. We would not expect this to explain the lack of a relative deprivation or an urban-rural effect on perceived bias, however.
References
- Akkerman, A., Mudde, C., & Zaslove, A. (2014). How populist are the people? Measuring populist attitudes in voters. Comparative Political Studies, 47(9), 1324–1353. https://doi.org/10.1177/0010414013512600
- Bartels, L. (2008). Unequal democracy. Princeton University Press.
- Bartolini, S., & Mair, P. (1990). Identity, competition, and electoral availability: The stabilization of European electorates 1885–1985. Cambridge University Press.
- Bolet, D. (2021). Drinking alone: Local socio-cultural degradation and radical right support—The case of British pub closures. Comparative Political Studies, 54(9), 1653–1692. https://doi.org/10.1177/0010414021997158
- Borwein, S., & Lucas, J. (2022). Asymmetries in urban, suburban, and rural place-based resentment. Working Paper.
- Broz, J. L., Frieden, J., & Weymouth, S. (2021). Populism in place: The economic geography of the globalization backlash. International Organization, 75(2), 464–494. https://doi.org/10.1017/S0020818320000314
- Carreras, M., Irepoglu Carreras, Y., & Bowler, S. (2019). Long-term economic distress, cultural backlash, and support for Brexit. Comparative Political Studies, 52(9), 1396–1424. https://doi.org/10.1177/0010414019830714
- Castanho Silva, B., & Wratil, C. (2021). Do parties’ representation failures affect populist attitudes? Evidence from a multinational survey experiment. Political Science Research and Methods, 1–16. https://doi.org/10.1017/psrm.2021.63
- Chambers, J. R., Swan, L. K., & Heesacker, M. (2014). Better off than we know. Psychological Science, 25(2), 613–618. http://doi.org/10.1177/0956797613504965
- Clarke, P. (2008). When can group level clustering be ignored? Multilevel models versus single-level models with sparse data. Journal of Epidemiology & Community Health, 62(8), 752–758. http://doi.org/10.1136/jech.2007.060798
- Cramer, K. J. (2016). The politics of resentment. Rural consciousness in Wisconsin and the rise of Scott Walker. University of Chicago Press.
- Cruddas, J. (2019). The left's new urbanism. The Political Quarterly, 90(1), 15–22. http://doi.org/10.1111/poqu.2019.90.issue-1
- Dalton, R. J. (2018). Political realignment: Economics, culture, and electoral change. Oxford University Press.
- de Lange, S., van der Brug, W., & Harteveld, E. (2022). Regional resentment in The Netherlands: A rural or peripheral phenomenon? Regional Studies, 57(3), 403–415.
- Dellmuth, L. (2023). Regional inequalities and political trust in a global context. Journal of European Public Policy, Forthcoming.
- Devine, D., & Valgardsson, V. (2023). Stability and change in political trust: Evidence and implications from six panel studies. European Journal of Political Research. http://doi.org/10.1111/1475-6765.12606
- Dijkstra, L., Poelman, H., & Rodríguez-Pose, A. (2020). The geography of EU discontent. Regional Studies, 54(6), 737–753. https://doi.org/10.1080/00343404.2019.1654603
- Ejrnæs, A., Jensen, M. D., Schraff, D., & Vasilopoulou, S. (2023). Regional inequality and political discontent in Europe. Journal of European Public Policy, Forthcoming.
- Elff, M. (2007). Social structure and electoral behavior in comparative perspective: The decline of social cleavages in Western Europe revisited. Perspectives on Politics, 5(2), 277–294. https://doi.org/10.1017/S1537592707070788
- Elff, M., & Rossteutscher, S. (2011). Stability or decline? Class, religion and the vote in Germany. German Politics, 20(1), 107–127. https://doi.org/10.1080/09644008.2011.554109
- Eurofound. (2019). Is rural Europe being left behind? European quality of life survey 2016, Publications Office of the European Union, Luxembourg.
- European Commission. (n.d.). Country Fact Sheets based on the Degree of Urbanisation. Retrieved January 11, 2023, from https://ghsl.jrc.ec.europa.eu/CFS.php
- European Union. (2022). GISCO postal code point dataset - 2020. Version date: 26/04/22. Retrieved January 11, 2023, from https://ec.europa.eu/eurostat/web/gisco/geodata/reference-data/postal-codes.
- Eurostat. (n.d.). Population on 1 January by age, sex and NUTS 2 region. Retrieved January 11, 2023, from https://ec.europa.eu/eurostat/databrowser/product/page/demo_r_d2jan.
- Ford, R., Bale, T., Jennings, W., & Surridge, P. (2021). The British general election of 2019. Palgrave Macmillan.
- Ford, R., & Jennings, W. (2020). The changing cleavage politics of Western Europe. Annual Review of Political Science, 23(1), 295–314. https://doi.org/10.1146/annurev-polisci-052217-104957
- Gest, J. (2016). The new minority: White working class politics in an age of immigration and inequality. Oxford University Press.
- Gest, J., Reny, T., & Mayer, J. (2018). Roots of the radical right: Nostalgic deprivation in the United States and Britain. Comparative Political Studies, 51(13), 1694–1719. https://doi.org/10.1177/0010414017720705
- Gidron, N., & Hall, P. A. (2020). Populism as a problem of social integration. Comparative Political Studies, 53(7), 1027–1059. https://doi.org/10.1177/0010414019879947
- Golden, M., & Min, B. (2013). Distributive politics around the world. Annual Review of Political Science, 16(1), 73–99. https://doi.org/10.1146/annurev-polisci-052209-121553
- Harris, S., Alasia, A., & Bollman, R. D. (2008). Rural commuting: its relevance to rural and urban labour markets. Statistics Canada.
- Herre, B., & Roser, M. (n.d.). Democracy. Published online at OurWorldInData.org. Retrieved January 11, 2023, from https://ourworldindata.org/democracy.
- Hood, C. (2010). The blame game. Princeton University Press.
- Howard, M. C. (2016). A review of exploratory factor analysis decisions and overview of current practices: What we are doing and how can we improve? International Journal of Human-Computer Interaction, 32(1), 51–62. https://doi.org/10.1080/10447318.2015.1087664
- Huijsmans, T. (2022). Place resentment in ‘the places that don’t matter’: Explaining the geographic divide in populist and anti-immigration attitudes. Acta Politica. https://doi.org/10.1057/s41269-022-00244-9
- International Institute for Democracy and Electoral Assistance (IDEA). (n.d.). Electoral system family. Retrieved January 11, 2023, from https://www.idea.int/data-tools/question-view/130357.
- Jennings, M. K., Stoker, L., & Bowers, J. (2009). Politics across generations: Family transmission reexamined. The Journal of Politics, 71(3), 782–799. http://doi.org/10.1017/S0022381609090719
- Johnston, R., & Pattie, C. (2002). Geographical scale, the attribution of credit/blame, local economic circumstances, and retrospective economic voting in Great Britain 1997: An extension of the model. Environment and Planning C: Government and Policy, 20(3), 421–438. https://doi.org/10.1068/c0120
- Jolly, S., Bakker, R., Hooghe, L., Marks, G., Polk, J., Rovny, J., Steenbergen, M., & Vachudova, A. (2022). Chapel Hill expert survey trend file, 1999-2019. Electoral Studies. https://doi.org/10.1016/j.electstud.2021.102420
- Jost, J. T. (2020). A theory of system justification. Harvard University Press.
- Jost, J. T., & Banaji, M. R. (1994). The role of stereotyping in system-justification and the production of false consciousness. British Journal of Social Psychology, 33(1), 1–27. https://doi.org/10.1111/j.2044-8309.1994.tb01008.x
- Kenny, M., & Luca, D. (2021). The urban-rural polarisation of political disenchantment: An investigation of social and political attitudes in 30 European countries. Cambridge Journal of Regions, Economy and Society, 14(3), 565–582. https://doi.org/10.1093/cjres/rsab012
- Kriesi, H. (1998). The transformation of cleavage politics: The 1997 Stein Rokkan lecture. European Journal of Political Research, 33(2), 165–185.
- Kriesi, H., Grande, E., Lachat, R., Dolezal, M., Bornschier, S., & Frey, T. (2006). Globalization and the transformation of the national political space: Six European countries compared. European Journal of Political Research, 45(6), 921–956. https://doi.org/10.1111/j.1475-6765.2006.00644.x
- Lago, I. (2022). Rural decline and satisfaction with democracy. Acta Politica, 57(4), 753–771. https://doi.org/10.1057/s41269-021-00221-8
- Lasswell, H. D. (1936). Politics: Who gets what, when, how. McGraw-Hill.
- Lipset, S. M., & Rokkan, S. (1967). Cleavage structures, party systems, and voter alignments: An introduction. In S. Rokkan & S. M. Lipset (Eds.), Party systems and voter alignments: Cross-national perspectives (pp. 1–64). Free Press.
- Los, B., McCann, P., Springford, J., & Thissen, M. (2017). The mismatch between local voting and the local economic consequences of Brexit. Regional Studies, 51(5), 786–799. https://doi.org/10.1080/00343404.2017.1287350
- Massetti, E., & Schakel, A. H. (2016). Between autonomy and secession: Decentralization and regionalist party ideological radicalism. Party Politics, 22(1), 59–79. https://doi.org/10.1177/1354068813511380
- McKay, L. (2019). ‘Left behind’ people, or places? The role of local economies in perceived community representation. Electoral Studies, 60, 102046. https://doi.org/10.1016/j.electstud.2019.04.010
- McKay, L., Jennings, W., & Stoker, G. (2021). Political trust in the “Places that don't matter”. Frontiers in Political Science, 3, 642236. https://doi.org/10.3389/fpos.2021.642236
- Meuleman, B., Abts, K., Schmidt, P., Pettigrew, T. F., & Davidov, E. (2020). Economic conditions, group relative deprivation and ethnic threat perceptions: A cross-national perspective. Journal of Ethnic and Migration Studies, 46(3), 593–611. https://doi.org/10.1080/1369183X.2018.1550157
- Mitsch, F., Lee, N., & Ralph-Morrow, E. (2021). Faith no more? The divergence of political trust between urban and rural Europe. Political Geography, 89, 102426. https://doi.org/10.1016/j.polgeo.2021.102426
- Mortensen, P. B. (2013). (De-) centralisation and attribution of blame and credit. Local Government Studies, 39(2), 163–181. https://doi.org/10.1080/03003930.2012.742015
- Mudde, C., & Kaltwasser, R. (2017). Populism. A very short introduction. Oxford University Press.
- Müller, J.-W. (2017). What is populism? Penguin.
- Munis, B. K. (2022). Us over here versus them over there … literally: Measuring place resentment in American politics. Political Behaviour, 44(3), 1057–1078. https://doi.org/10.1007/s11109-020-09641-2
- Office For National Statistics. (2022). Lower Layer Super Output Areas (Dec 2011) Boundaries Full Clipped (BFC) EW V3. Retrieved January 11, 2023, from https://geoportal.statistics.gov.uk/datasets/ons::lower-layer-super-output-areas-dec-2011- boundaries-full-clipped-bfc-ew-v3/about
- Organisation for Economic Co-operation and Development (OECD). (2018). Divided cities: Understanding intra-urban inequalities. OECD.
- Patton, D. F. (2019). Protest voting in Eastern Germany: Continuity and change across three decades. German Politics and Society, 37(3), 72–88. https://doi.org/10.3167/gps.2019.370306
- Pike, A., Béal, V., Cauchi-Duval, N., Franklin, R., Kinossian, N., Lang, T., Leibert, T., MacKinnon, D., Rousseau, M., Royer, J., Servillo, L., Tomaney, J., & Velthuis, S. (2023). ‘Left behind places’: a geographical etymology. Regional Studies, 1–13. http://doi.org/10.1080/00343404.2023.2167972
- Piurko, Y., Schwartz, S. H., & Davidov, E. (2011). Basic personal values and the meaning of left-right political orientations in 20 countries. Political Psychology, 32(4), 537–561. http://doi.org/10.1111/pops.2011.32.issue-4
- Rodríguez-Pose, A. (2018). The revenge of the places that don’t matter (and what to do about it). Cambridge Journal of Regions, Economy and Society, 11(1), 189–209. https://doi.org/10.1093/cjres/rsx024
- Rooduijn, M., van Kessel, S., Froio, C., Pirro, A., De Lange, S., Halikiopoulou, D., Lewis, P., Mudde, C., & Taggart, P. (2020). The PopuList 2.0: An overview of populist, far right, far left and Eurosceptic parties in Europe. www.popu-list.org.
- Rozin, P., & Royzman, E. B. (2001). Negativity bias, negativity dominance, and contagion. Personality and Social Psychology Review, 5(4), 296–320. https://doi.org/10.1207/S15327957PSPR0504_2
- Runciman, W. G. (1966). Relative deprivation and social justice: A study of attitudes to social inequality in twentieth-century England (Vol. 13). Routledge/Thoemms Press.
- Schraff, D., & Pontusson, J. (2023). Falling behind whom? Economic geographies of right-wing populism in Europe. Journal of European Public Policy, Forthcoming.
- Shair-Rosenfield, S., Schakel, A. H., Niedzwiecki, S., Marks, G., Hooghe, L., & Chapman-Osterkatz, S. (2021). Language difference and regional authority. Regional & Federal Studies, 31(1), 73–97. https://doi.org/10.1080/13597566.2020.1831476
- Sleigh, S. (2021, November 20). ‘Stop pitting us against each other’, London labour party figures tell Andy Burnham. Huffington Post. https://www.huffingtonpost.co.uk/entry/stop-pitting-against-each-other-london-labour-andy-burnham_uk_61961ca0e4b0ae9a429bf3d4.
- Stein, J., Buck, M., & Bjørnå, H. (2021). The centre–periphery dimension and trust in politicians: The case of Norway. Territory, Politics, Governance, 9(1), 37–55. https://doi.org/10.1080/21622671.2019.1624191
- Tajfel, H. (1981). Social stereotypes and social groups. In J. C. Turner & H. Giles (Eds.), Intergroup behaviour (pp. (pp. 144–167). Basil Blackwell.
- United Nations Statistics Division. (2021). Demographic Yearbook – 2020. Table 3: Population by sex, rate of population increase, surface area and densityhttps://unstats.un.org/unsd/demographic-social/products/dyb/dyb_2020/
- Urbinati, N. (2014). Democracy disfigured: Opinion, truth and the people. Harvard University Press.
- Valero, D. E. (2022). From Brexit to VOX: Populist policy narratives about rurality in Europe and the populist challenges for the rural-urban divide. Rural Sociology, 87(S1), 758–783. https://doi.org/10.1111/ruso.12410
- van der Brug, W., Hobolt, S. B., & de Vreese, C. H. (2009). Religion and party choice in Europe. West European Politics, 32(6), 1266–1283. https://doi.org/10.1080/01402380903230694
- Vasilopolou, S., & Talving, L. (2023). Euroscepticism as a syndrome of stagnation? Regional inequality and trust in the EU. Journal of European Public Policy, Forthcoming.
- Volpi, E., & Giger, N. (2022). A Distorting Mirror: Ideological preferences and mis-perceptions of economic inequality. University of Geneva working paper no. 32.
- Weiner, B., Osborne, D., & Rudolph, U. (2011). An attributional analysis of reactions to poverty: The political ideology of the giver and the perceived morality of the receiver. Personality and Social Psychology Review, 15(2), 199–213. https://doi.org/10.1177/1088868310387615
- Weingast, B. R., Shepsle, K. A., & Johnsen, C. (1981). The political economy of benefits and costs: A neoclassical approach to distributive politics. Journal of Political Economy, 89(4), 642–664. https://doi.org/10.1086/260997
- Wig, T., Hegre, H., & Regan, P. M. (2015). Updated data on institutions and elections 1960–2012: Presenting the IEAP dataset, version 2.0. Research & Politics, 2(2), 1–11.
- Wikimedia Foundation. (n.d.). List of national capitals by population. Wikimedia. Retrieved January 11, 2023, from https://en.wikipedia.org/wiki/List_of_national_capitals_by_population
- Woods, D. (2014). The many faces of populism in Italy: The Northern League and Berlusconism. In The many faces of populism: Current perspectives. Emerald Group Publishing Limited.
- The World Bank. (n.d.a). GDP per capita (current US$). Retrieved January 11, 2023, from https://data.worldbank.org/indicator/NY.GDP.PCAP.CD.
- The World Bank. (n.d.b). Gini index. Retrieved January 11, 2023, from https://data.worldbank.org/indicator/SI.POV.GINI.
- The World Bank. (n.d.c). Rural population (% of total population). Retrieved January 11, 2023, from https://data.worldbank.org/indicator/SP.RUR.TOTL.ZS.