Abstract
In the last two decades, sustainable consumption has become one of the most important issues in global sustainable development. Rapid economic development in China has greatly improved people's living standards, but has also seriously damaged the environment. In this paper, material flow analysis and life-cycle assessment methods were used to analyze environmental consumption patterns of Chinese urban households. Results show that the total household environmental impact (HEI) increased nearly four fold, increasing from 1.85 in the environmental potential index (EPI) in 1985 to 6.40 EPI in 2000. In 1985 and 1990, more than 80% of HEI came from food and housing consumption behaviors. In 2000, transport and housing consumption behaviors have become the main sources of HEI. Climate, economic development, household income, family size, and urbanization rate are main driving forces of household environmental impacts. The increasing consumption demand in the next two decades and its environmental implications are discussed in the last part of this paper.
Introduction
Household consumption is an important human activity and a major source of environmental pollution (Princen Citation1999; Farah and Allely Citation2003). In the past decade, significant progress has been made in alleviating pollution through production-side end-of-pipe control technology and industrial cleaner production systems. But evidence shows that these achievements have been offset by another side effect of economic activity – unsustainable consumption patterns (Noorman Citation1998). In 1992, the UNCED conference identified unsustainable pattersn of consumption and production as a major cause of the deteriorating environment (United Nations Citation1993). Ten years later, the 2002 World Summit on Sustainable Development in Johannesburg called again for the adoption of tools, policies, and assessment mechanisms to promote sustainable consumption (Barber Citation2003).
China has the largest population in the world. The rapidly developing economy in China has greatly improved people's living standards in recent decades. However, booming physical consumption has put great pressure on an already deteriorating environment, which has caused both local and worldwide concern. Meeting the consumption demands of a country with the largest population in the world in a sustainable way has worldwide environmental implications (Liu and Diamond Citation2005). So it is very important for China to advance sustainable consumption and ensure sustainable development in the future. In 1994, the Chinese Government published its Agenda 21, in which Chapter 7 specifically focuses on issues concerning sustainable consumption (China's agenda 21, Citation1994). This was followed by a series of practical activities and campaigns organized by the government and NGOs (CI & UNEP Citation2004) to popularize and implement sustainable consumption.
In this paper, material flow analysis (MFA) and life-cycle assessment (LCA) methods are used to analyze household environmental impacts (HEI) of Chinese urban households from 1985 to 2000. We used the material flow accounting framework established by Eurostat (Citation2000) to account for the material metabolism processes of Chinese urban households. The weight-based aggregation indicators of MFA are regarded as generic pressure indicators that may not be used to indicate specific environmental impacts (Bringezu et al. Citation2003; Giljum Citation2004). Therefore, the LCA method was used here to analyze the environmental impacts of urban household consumption behaviors. These two methods reflect the direct and indirect impacts of HEI, respectively. The purpose of this paper is find the ‘hot spots’ in Chinese household consumption from an environmental point of view and to provide scientific support for policy making and consumer guidelines.
Methods and data sources
Household consumption clusters
According to the Chinese national accounting system, a total of more than 300 household consumption items can be categorized into eight clusters, namely food, clothing, household facilities, medical services, transport, recreation, residence, and miscellaneous commodities. Some researchers analyze all these items by combining extended economic input–output tables with consumer surveys (Matthews and Small Citation2001; Bin and Dowlatabadi Citation2005; Rixt et al. Citation2006; Sangwon Citation2006). Others only focus on important clusters, due to inadequate data sources and the complexity of household consumption behaviors. It is reported that construction and housing, food and transport add up to 70% of household environmental impact in terms of material extraction, energy consumption, and land use (Spangenberg and Lorek Citation2002). Considering the rapid saturation of electric appliances in Chinese urban households, we added appliances as a fourth cluster in this paper.
Material flow analysis
The method of material flow analysis evolved from society metabolism theory and is now widely used in environmental assessment of economy-related activities at different scales, from households to worldwide systems (Ayres and Simonis Citation1994; Fischer-Kowalski and Hüttler Citation1999). Its hypothesis is that material used by humans is positively related to environmental impacts. There are two kinds of flow analysis: dynamic and static flow analysis. Dynamic flow analysis usually focuses on elements or substances and analyzes the flow process of these materials at a fixed spatial scale, while static flow analysis is usually used in an economic system, focusing on material input, output, and stock analysis in a fixed time range. We used static flow analysis in this paper and took the household as a black box economic unit. We assumed that the materials stock in a household at the end of a year reflects the environmental burden of household consumption behavior in that year. From the Statistical Yearbooks of China (National Bureau of Statistics of China Citation2001), we obtained the ownership numbers for different consumption clusters, and then calculated the material stocks of a household by multiplying the ownership numbers by their material constituents. Considering the lifespan of durable goods, we divided the total weight of material stocks by their lifespan. The data for the residential sector energy and water consumption were obtained from the Statistical Yearbooks and can be distributed among different behaviors due to the consumption patterns of Chinese urban households (Liu et al. Citation2005).
Results of household material flow analysis are shown in . We found that the amount of material flows continued to increase from 1985 to 2000. Water constitutes the largest part of household material flow. The amount of material stock in the household increased rapidly in this period; this means that as the saturation rate of durable goods increased, more and more materials were stocked in a household. These stocked materials will be transferred to solid waste at the end of their lifespan.
Table 1. Material consumption per household from 1985 to 2000
Life cycle assessment (LCA)
LCA is a technique for systemically analyzing a product from cradle-to-grave (ISO Citation1997). Life-cycle thinking is a key point in the definition of sustainable consumption given by UNEP in 1994. Life-cycle approaches were again emphasized and regarded as the main tool to promote sustainable consumption by the Johannesburg Plan of Implementation in 2002. A critical review by Hertwich (Citation2005) summarized new progress in LCA in sustainable consumption research, and found that, due to a lack of high quality data, traditional process-based LCAs are mainly used in studies focusing on selected activities, instead of the entire household consumption basket. In this paper, we used traditional process-based LCA data to analyze selected materials related to the four consumption clusters. Based on the SimaPro Model, we built our own Chinese life-cycle inventory database. Results of LCA are expressed in a single score, called the environmental potential index (EPI). The normalization and weighting factors were developed based on Chinese policy targets (Yang et al. Citation2001). The methodology of our LCA model is similar to the EDIP (Environmental Design of Industrial Products) method. Detailed methodologies will not be discussed in this paper.
Environmental consumption patterns of Chinese urban households
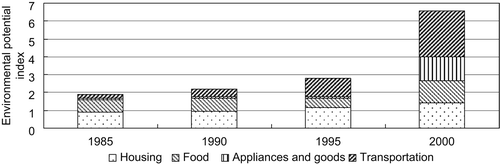
Our analyzed results show that total household environmental impact increased nearly four fold, increasing from 1.85 EPI in 1985 to 6.40 EPI in 2000 (). The EPI of all four clusters increased in this period, but the EPI of appliances and transportation consumption increased faster than food and housing consumption. In 1985 and 1990, more than 80% of EPI came from food and housing consumption. In 2000, the EPI for transportation and housing consumption behaviors has become the main sources of HEI.
Figure 1. Life-cycle environmental potential index of Chinese urban households.
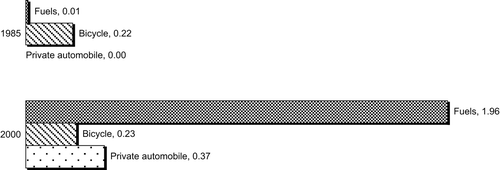
We further analyzed the contribution of different items to each cluster (–). We divided housing consumption behavior into the following four items: buildings, energy for light, energy for cooling and heating, and water for housekeeping. We found that a building's EPI takes more than half of the housing EPI, and that energy for cooling and heating takes the second part. The EPI of energy for cooling and heating increased faster than other items (). Food consumption behavior was further divided into grain, water for cooking, and energy for cooking. More than 60% of food EPI came from energy use for cooking, the remainder coming from cooking and drinking water use, and the grain production process. The EPI of energy for cooking increased faster than the other areas (). reflects EPI patterns of appliance consumption in Chinese urban household from 1985 to 2000. The EPI patterns are similar in these years. Energy used by appliances took most of the EPI in 2000. gives the EPI patterns of household transportation consumption. In 1985, the bicycle took the most of the transportation EPI. With increasing motorization in China (CAE Citation2003), the private automobile now plays a more and more important role in the transportation EPI ().
Figure 2. EPI patterns of housing consumption in 1985 and 2000.
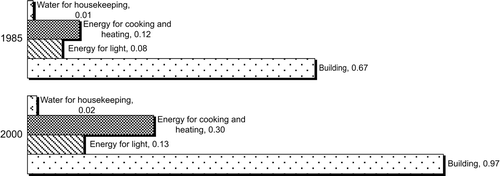
Figure 3. EPI patterns of food consumption in 1985 and 2000.
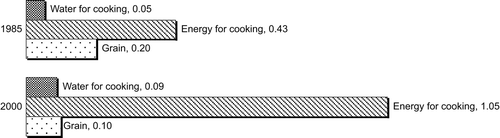
Figure 4. EPI patterns of appliance consumption in 1985 and 2000.
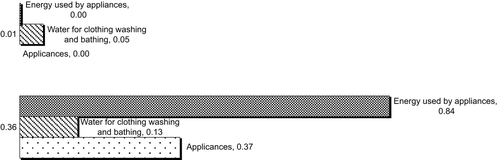
Figure 5. EPI patterns of transportation consumption in 1985 and 2000.
Driving forces for Chinese urban household consumption
Climate, economic development and household income, family size, living conditions, culture and tradition, infrastructure, and policies all influence the size and significance of household environmental consumption patterns (OECD Citation1999; Michaelis Citation2003). These factors can be categorized as biological/physical factors, economic/marketing factors, and social-demographic factors. China is one of the world's largest countries with diverse physical geographical environments. The uneven allocation of natural resources and climates affects consumption patterns of households, especially water and energy consumption patterns (Zhou and Niu Citation2003; Song Citation2004).
Economic development and the increase in household disposable income appear to be very important factors that determine household environmental impact. Rapid economic development has taken place in China since its reform and opening up policy of 1978. The average 9% GDP growth rate in the past 20 years has resulted in similar household income increases. Resource consumption and waste emissions increase in relation to growing household income and living standard (Kanyama and Karlsson Citation2002); higher household incomes are linked to higher levels of appliance ownership and more frequent use of water and energy consuming appliances.
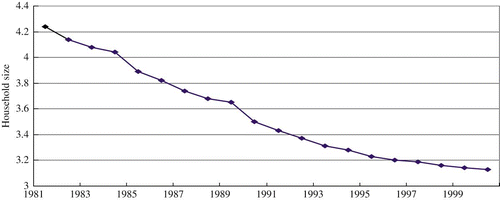
China's urbanization in the last two decades can be characterized by large-scale population migration from rural areas to cities, accompanied by changes in life styles. For households, the adoption of a modern urban way of life means more water and energy consumption (Ray Citation1998). With the increase in urbanization from 19.6% in 1981 to 35.8% in 2000, the Chinese urban population doubled from 196.22 million to 456.34 million, respectively. At the same time, average household size decreased from 4.24 to 3.13 (). Population growth, together with a trend towards fewer people per household, is contributing to a large rise in the number of households in Chinese cities.
Figure 6. Changes in urban household size in China (1981–2000).
The EPI patterns of households are connected to household expenditure patterns. The Engle coefficients for Chinese urban households in 1985 and 1990 were 53.3% and 54.2% respectively, which means more than half of household income was spent on food consumption. With improvements in living standards, the contribution of housing and transportation to HEI has increased rapidly. In 2000, the percentage of transportation and housing environmental impact to total HEI was 60%. This means that consumption patterns of Chinese urban households are shifting from basic demand to a higher quality of life. Expenditure patterns of urban household () show that urban household expenditure patterns are changing from basic demands, such as food and clothing, to transportation and housing. People's requirements for housing and cars boosted development of the construction and vehicle sectors in China. These are environmentally energy and resource intensive sectors.
Table 2. Expenditure patterns of urban households (%) (1985–2000)
Implications and remarks
As the largest developing country in the world, China is under increasing pressure to meet people's desire for a better quality of life. Due to its limited natural resources, huge population, and lack of advanced technologies, environmental issues have hampered China's development efforts. More and more environmental degradation in China will be related to residential consumption with increases in income and living standards. The next 20 years will be another economic boom period for China. It is forecast that GDP will increase by 7.7% and reach US$3000 per capita in 2020. With development of the national economy and household income, EHI will undoubtedly similarly increase.
It is predicted that by 2020, 47.7% of China's 1.48 billion residents will live in urban areas. If the urban household size decreases to 2.9, there will then be more than 0.24 billion urban households by 2020 (Lian Citation2004). These households will use more water and energy and take up more living space. With the wider use of showers and washing machines, water consumption patterns of Chinese urban households will approach those of developed countries: residential water use in 2020 will reach 58500 Mt. If residential COD emissions remain at 82.5 g per capita per day, total residential COD emissions will reach 25.58 Mt in 2020, and similar trends will exist in energy and other material use patterns. In 2020, electricity consumption of urban households is predicted to be more than 3500 KwH (Hu Citation2001). The ecological impact of households in 2020 will put great pressure on the environment that can only be alleviated if appropriate measures are taken now.
To meet the demands of Chinese people and protect the environment, integration of ecological engineering, ecological planning and capacity building of technology, institutions, and behaviors are vital in promotion of sustainable consumption. Life quality-based consumption patterns should therefore be developed. Control strategies and policies are required based on a scientific understanding of the relationship between consumption behavior and quality of life. Sustainable consumption is a rather new research area that is characterized by a variety of theoretical and methodological approaches that go far beyond neo-classical consumer theory. It is important to establish a multidisciplinary research framework to identify the relationship between consumption patterns and the environment, to identify specific activities, tools, policies, measures, monitoring, and assessment mechanisms that may mitigate effects of increased consumption on the environment and contribute to sustainable development.
Acknowledgments
This research was supported by the Knowledge Innovation Project of the Chinese Academy of Sciences (KZCX2-YW-422) and the Chinese National Scientific Foundation (No.70433001). We gratefully acknowledge discussions with and support from our colleagues.
Related Research Data
References
- Ayres , RU and Simonis , UE . 1994 . Industrial metabolism: restructuring for sustainable development , Tokyo : United Nations University Press .
- Barber , J . 2003 . “ Production, consumption and the world summit for sustainable development ” . In Integrative Strategies Forum , Netherlands : Kluwer Academic .
- Bin , S and Dowlatabadi , H . 2005 . Consumer lifestyle approach to US energy use and the related CO2 emissions . Energy Policy. , 33 ( 2 ) : 197 – 208 .
- Bringezu , S , Schmütz , H and Moll , S . 2003 . Rationale for and interpretation of economy-wide materials flow analysis and derived indicators . J Ind Ecol. , 7 ( 2 ) : 43 – 64 .
- China's , agenda 21 . 1994 . Beijing : Chinese Environmental Sciences Press .
- [CAE] Chinese Academy of Engineering, National Academy of Engineering and National Research Council . 2003 . Personal cars and China , Beijing : China Machine Press .
- [CI & UNEP] Consumers International and UNEP . 2004 . Tracking progress: implementing sustainable consumption policies. CI & UNEP .
- European Commission . 2001 . Economy-wide material flow accounts and balances with derived resource use indicators: a methodological guide , Luxembourg : Office for Official Publications of the European Communities .
- Farah , AZ and Allely , EG . 2003 . Household consumption patterns in OECD countries: trends and figures . J Cleaner Prod. , 11 ( 8 ) : 819 – 827 .
- Fischer-Kowalski , M and Hüttler , W . 1999 . Society's metabolism: the intellectual history of material flow analysis, part II, 1970–1998 . J Ind Ecol. , 2 ( 4 ) : 107 – 136 .
- Giljum , S . 2004 . Trade, material flows and economic development in the south: the example of Chile . J Ind Ecol. , 8 ( 1–2 ) : 241 – 261 .
- Hertwich , EG . 2005 . Life cycle approaches to sustainable consumption: a critical review . Environ Sci Technol. , 39 ( 13 ) : 4673 – 4684 .
- Hu , XL . 2001 . Evaluation of technology and countermeasures for greenhouse gas mitigation in China , Beijing, , China : Chinese Environmental Sciences Publishing .
- ISO 14040 . 1997 . Environmental management – life cycle assessment – principles and framework . ISO. ,
- Kanyama , AC and Karlsson , R . 2002 . Household metabolism in five cities , Stockholm : Swedish National Report .
- Lian , YM . 2004 . Chinese city development report, 2004 , Beijing : Modern Economy Press Housing .
- Liu , JG and Diamond , J . 2005 . China's environment in a globalizing world: how China and the rest of the world affect each other . Nature. , 435 ( 3 ) : 1179 – 1186 .
- Liu , JR , Wang , RS and Yang , JX . 2005 . Metabolism and driving forces of Chinese urban household consumption . Population and Environment. , 26 ( 4 ) : 325 – 341 .
- Matthews , HS and Small , MJ . 2001 . Extending the boundaries of life-cycle assessment through environmental economic input– output models . J Ind Ecol. , 4 ( 3 ) : 7 – 10 .
- Michaelis , L . 2003 . The Oxford commission on sustainable consumption . J Cleaner Prod. , 11 ( 8 ) : 931 – 933 .
- National Bureau of Statistics of China . 2001 . China Statistical Yearbook 2001 , Beijing : China Statistics Press .
- Noorman , KJ . 1998 . Green households? Domestic consumers, environment and sustainability , London : Earthscan Publications .
- OECD . 1999 . Towards more sustainable household consumption patterns: indicators to measure progress . OECD. ,
- Princen , T . 1999 . Consumption and environment: some conceptual issues . Ecol Econ. , 31 ( 3 ) : 347 – 363 .
- Ray , K , ed. 1998 . “ Promoting sustainable consumption in Asian cities ” . In Nairobi: United Nations Centre for Human Settlements
- Rixt , K , Benders , RMJ and Moll , HC . 2006 . Measuring the environmental load of household consumption using some methods based on input–output energy analysis: a comparison of methods and a discussion of results . Energy Policy. , 34 ( 17 ) : 2744 – 2761 .
- Sangwon , S . 2006 . Handbook on input–output economics in industrial ecology , Netherlands : Springer .
- Song , XT . 2004 . Water consumption efficiency of Chinese cities , China Construction Newspaper . Mar 19
- Spangenberg , JH and Lorek , S . 2002 . Environmentally sustainable household consumption: from aggregate environmental pressures to priority fields of action . Ecol Econ. , 43 ( 2–3 ) : 127 – 140 .
- United Nations . 1993 . Earth Summit: Agenda 21, the United Nations programme of action from Rio , New York : United Nations .
- Yang , JX , Wang , RS and Liu , JR . 2001 . Methodology of life cycle impact assessment for Chinese products . Acta Sci Circumstantiae. , 21 ( 2 ) : 234 – 237 .
- Zhou , H and Niu , WJ . 2003 . Analysis of residential power consumption in summer with various influence factors . North China Electric Power. , 21 ( 3 ) : 12 – 14 .