
Abstract
A large number of East Asian cities, like cities in other parts of the world, are being affected by extreme heatwaves. Yet, little is known about the general urban design characteristics of sites with significant heat vulnerability within the localized context. In this study, empirical data sets were constructed describing the biomedical, social, environmental, and place-based parameters associated with the location of heat-related emergency calls in Suwon, South Korea, between 2010 and 2014. The results showed that the distribution of heat vulnerability appeared to be highly clustered within a few places, although the area did not have a high proportion of socioeconomically vulnerable populations. Here, three urban design characteristics were described in association with the location of emergency calls: (1) high-rise building complexes built on a superblock gridiron layout with large open spaces in between, (2) low-rise, high-density residential districts with a fine-scaled street layout, and (3) hilly terrain parkland sites adjacent to a densely urbanized district. These general characteristics of the sites and their potential links to heat vulnerability were explained in terms easily understandable by urban design and planning professionals so that climatic knowledge can be more effectively integrated with urban form-making practices.
1. Introduction
Extreme heat events and greater heat vulnerability within particular communities are increasingly characterizing contemporary cities. Along with a growing number of studies on sustainable development – such as Zhao et al. (Citation2008, Citation2014) and Zheng et al. (Citation2013) – substantial progress was made in the studies of heatwave impacts on urban communities (McGeehin & Mirabelli Citation2001; Kovats & Hajat Citation2008; Hajat et al. Citation2010). Previous studies had attempted to reveal multiple dimensions of the causes of greater heat vulnerability associated with health risks. Subsequently, heat vulnerability was known to be influenced by factors beyond individuals’ biomedical conditions, including place-based characteristics. The physical and environmental features of a place – such as the type of materials covering the urban space, the size and the shape of open spaces, and regional land-cover patterns – do affect the degree of vulnerability to extreme heat events. But the links had significantly been understudied, at least until the 1970s.
Beginning in the 1980s, pioneering research by Oke (Citation1981, Citation1982) showed that a neighborhood’s microclimate is strongly influenced by multiple built environment characteristics, such as street height-to-width ratio (H/W), the thermal properties of urban materials (e.g., surface albedo), and land-cover patterns. Following this, empirical studies suggested a series of potentially influential factors that lead to heat trapping within an urbanized area – such as a small sky-view factor, the east–west orientation of streets, and courtyard-type housing blocks (Ratti et al. Citation2003; Ali-Toudert & Mayer Citation2006; Giridharan et al. Citation2007). Yet, among a number of place-based characteristics, urban design components were probably the least-studied area.
It is generally known that urban design characteristics influence heat vulnerability through two interactive paths. First, some factors are known to raise air temperature through a greater exposure of urban surfaces to direct solar radiation and greater heat containment/release for longer hours. These factors include the environment of a densely clustered downtown area covered with low-reflective materials, deep canyon-like streets, and great anthropogenic heat emission from vehicles. Negative health risks associated with highly dense urban environments were empirically supported in studies like Dolney and Sheridan (Citation2006), which showed that higher temperatures did increase the number of heat-related emergency calls in Toronto, with the correlation stronger in downtown area than in less-urbanized area. Additionally, urban landscape affects the pattern, direction, and speed of wind, which influences the flow of cool and clean air at a region scale. Second, certain living and walking environments are known to increase a community’s heat stress through greater heat exposure or delayed adaptation behaviors. These include living on the top floor of an apartment without air conditioners, staying in a housing unit with great thermal mass but with limited ventilation, open-air streets teeming with daytime street vendors or homeless families, and recreational places with people enjoying outdoor activities for long hours. This indicated that high temperature alone does not necessarily lead to greater health risks unless it is either directly or indirectly coupled with one or more of the urban design characteristics. Here, the urban design characteristic of a community was defined as the part of the physical environment that is designed, built, and modified by professionals of architecture and urban design.
Yet, from an urban designer’s perspective, understanding the generalizable built environment characteristics associated with greater heat vulnerability still presents a significant research gap. Although the urban design parameters mentioned above have been investigated in previous studies, little is known about why certain neighborhoods as a whole are far more critically affected during heatwaves than nearby neighborhoods with similar population compositions. Additionally, Eliasson (Citation2000) showed that climatic knowledge still has a very low impact on urban design and planning processes due to the presence of institutional barriers like communication problems, conflicting interests among stakeholders, and time constraints. In other words, fragmented place-based studies need to be put together to inform urban designers of a normative set of desirable built environment characteristics that take into account the health risks posed by heatwaves. This information should be presented as briefly and as straightforward as possible so that collective knowledge on climate and health risks can be integrated into the practice of urban design.
In this study, we aim to initiate empirical studies that respond to a simple but fundamental question: ‘What urban design factors characterize a highly vulnerable place – larger than a street or a single block but smaller than a city – during heatwaves?’ The paper attempts to provide preliminary research findings by reviewing related studies and by describing urban spaces associated with multiyear emergency call data sets collected from the mid-sized city of Suwon in South Korea during heatwaves. Here, the results are explained in terminology easily understood by urban design professionals who may or may not be familiar with the climatic environment of the study area. Due to the limited spatial scope of the collected data, the research findings may not be generalizable to other cities with different environmental context. However, we expect that a mid-sized city built of highly dense urban environments with a humid subtropical climate might show a vulnerability pattern similar to the one suggested in the study.
2. Research methods
2.1. Data and the study area
The city of Suwon was selected for empirical analyses. Suwon is a mid-sized city with an administrative area of 121 km2 and a population density of 9900 people/km2, located about 30 km to the south of Seoul. The city was first established in the late eighteenth century as an administrative town of a middle kingdom in the Korean Peninsula called the Joseon Dynasty (1392–1910). Since then, the city has undergone fairly rapid urbanization processes, with urban populations increasing tenfold from 52,000 in 1951 to 0.6 million in 1990 and again doubling to 1.2 million by 2014. The city has a humid subtropical climate and showed a strong sign of regional climate change. For instance, the climatic data between 1980 and 2013 showed continued increases in the mean, the highest, and the lowest temperatures in the city (Suwon Government, Citation2013). The change led to the issuance of heatwave warnings – called pokyeomjuuibo in Korean – every year between 2008 and 2014 consecutively, which is part of the public warning system when the hottest daily temperature over 33.0°C is expected.
Indeed, a number of heatwave events were observed in Suwon over the past five years, for example, with one of the highest temperatures recorded was 37.4°C on 5 August 2012 and 34.7°C on 22 August 2013 (KMA Citation2014). Although the city is situated inland, the western part of the city is near the coastal area of the West Sea. This geographic location – along with the city’s water-rich landscape crisscrossed with lakes and waterways flowing from the north to the south – makes the city very humid during the summer. The average relative humidity in Suwon was 84% in July and 81% in August 2013, which was higher than Seoul’s humidity of 79% and 69%, respectively (KMA Citation2014). With increasingly hot and humid temperatures observed across many Korean cities, the first-of-a-kind heat-related health monitoring program was initiated in 2010 by the Korea Center for Disease Control and Prevention (KCDC). In the following year, about 86% out of the country’s 470 emergency medical institutions reported detailed information about heat-related illnesses such as heatstroke, heat syncope, heat cramp, heat exhaustion, heat fatigue, and heat edema. Between 2011 and 2013, the total number of heat-related illnesses reported in Korea increased from 443 to 1195 (KCDC Citation2013).
In this study, all of the detailed emergency call data in Suwon associated with heat illnesses between 2010 and 2014 were collected. Although the data were not made public as of today due to privacy issues, the data were obtainable through the Mayor’s Advisory Group for Urban Planning after de-identifying patients’ names. The processed data included multiple socioeconomic characteristics of the patients – such as age, sex, and general health condition – as well as the date/time/location of the occurrence of heat illnesses, the patient’s status, the type of treatment after emergency medical dispatch, and the names of the medical institutions that cared for the patients after hospitalization. Between 2010 and 2014, 40 emergency calls were reported in Suwon. The average age of the patients was 47, and half of them were male. A majority calls of 36 were made between mid July and early September, while four calls were in early June. Among the callers, 30 people were hospitalized after first aid treatment and the rest recovered onsite without hospitalization. No heat-related deaths were reported in the data. From a methodological perspective, 40 samples did not seem to be large enough to derive generalizable conclusions about heat vulnerability in the city. However, since the purpose of the research is to identify major urban design characteristics associated with intense health risks, the limited sample size was not regarded as a major drawback.
Then, the acquired data were complied with the city’s geospatial database, including both the meso-and micro-scale urban/environmental variables like the location of parcels, streets, buildings, land-use and land-cover patterns, streams, contours, trees, and vegetation (Kim et al. Citation2014). Individual emergency call locations were carefully recorded in the data and were linked with each patient’s socioeconomic information. Once the database was built, field surveys were conducted between December 2013 and March 2014 to examine the locations of the emergency calls. Additionally, remote-sensed data using Landsat was analyzed to identify the thermal properties of the city, such as albedo and normalized difference vegetation index (NDVI). Albedo is the reflectance of shortwave radiation (i.e., solar radiation), thus higher albedo indicates less absorption of shortwave radiation by a land surface. NDVI is positively related to vegetation metabolism and structure (Ryu et al. Citation2010, Citation2014). We selected one Landsat 7 ETM+ (30 m resolution) image taken on a cloudless summer day (16 June 2011). We converted digital numbers to spectral reflectance in five spectral bands located in the shortwave domain. Albedo was computed by using the five spectral band reflectance (Liang Citation2001), and NDVI was calculated using red and near-infrared spectral reflectance (Tucker Citation1979). All data sets were georeferenced in ArcGIS to the Korea 2000 Central Belt coordinate system.
2.2. Research methods
The distribution pattern of emergency calls reported between 2010 and 2014 was visualized using a GIS mapping technique. The call data were pooled into a single table, and its precise location was mapped using dots. The kernel density method was applied to visualize the distribution of the emergency calls. Then, the degree of spatial evenness embedded in the call data was tested using the Pearson’s correlation analyses and the Anselin Local Moran’s (ALM) I test. For the Pearson’s correlation test, the emergency call pattern was compared to the distribution of total populations, working populations (both in manufacturing and in service industries), and vehicle numbers registered in the city, as these were proxy variables that at least partly represent the frequency of illnesses by administrative units.
Heat-related vulnerability mapping was then conducted based on the methodology suggested by Reid et al. (Citation2009). After reviewing a large number of epidemiological literature, the study combined 10 standardized socioenvironmental indicators to reveal the pattern of heat vulnerability at the census-tract level in the United States. Reid et al. (Citation2009, p. 1730) defined cumulative heat vulnerability index as the degree of ‘vulnerability to heat-related health effects in urban areas’ calculated from a set of standardized factors. The factors adopted were six demographic variables (e.g., age, poverty level, education, living alone, and race/ethnicity), a land-cover variable (e.g., vegetation coverage), a health-related variable (e.g., populations diagnosed with diabetes), and two air-conditioning variables (e.g., households without central AC and without any AC). The same variable categories were largely available for Suwon but two issues needed to be resolved to ensure the validity of the method. First, the effectiveness of the ‘vegetation coverage’ variable in the model was questionable, especially when the size of a neighborhood under investigation in our study – with a mean area of 3 km2 – was much smaller than a census tract. The area of vegetation might serve as a rough estimate for the heat-mitigating effects of nonurbanized land cover, but the variable did not include any detailed thermal parameters. Our study chose scientifically measurable thermal properties of urban surfaces, such as the albedo and the NDVI of the city during summertime. Second, the variable of ‘households with central air-conditioning units’ did not seem to be relevant to the vulnerability of communities in Suwon since noncentralized air conditioners, electric fans, and personal dehumidifiers were already in use. Thus, in this study, the variable was omitted to reduce a potential bias. Then, using the collected 10 indicators, each variable was rescaled to have a mean of 0 and a standard deviation (SD) of 1. The normalization process was conducted based on the assumption that all variables contributed evenly and linearly to heat-related vulnerability, which was also assumed in Reid et al. (Citation2009). Then, the rescaled vulnerability values for 10 indicators were summed by administrative boundaries called ‘Dong’ in Suwon, leading to the cumulative heat vulnerability indices with spatial variations. By overlaying the mapping result with the emergency call pattern, qualitative assessment was made about the potential causes of differences.
In order to estimate urban design characteristics associated with the sites of emergency calls in the study area, cluster analyses were conducted. It was not possible to investigate how individual patients’ medical factors were coupled with a group of urban design characteristics using a statistical model due to the lack of counterfactual samples, that is, a group of healthy and nonhealthy residents who had similar socioenvironmental status. Instead, average-linkage cluster analyses were conducted to classify distinctive urban design characteristics near the 40 patients, and then the characteristics were explained in relation to individual patients’ medical conditions and community-level heat vulnerability. Regarding the selection of a distance threshold between patients and a place in which each patient was located, a 300 m distance threshold was chosen based on the previous study by Giridharan et al. (Citation2007). The study assumed that urban design factors within a 300 m distance from a specific location may serve as a working estimate for the thermal influence of the area. The urban design variables investigated in our study were the ratio of building footprints (%), the average urban geometry of street sections (=H/W), road density (km/km2), major building uses (low/high-rise residential/commercial/mixed uses), the distance to major roads (m), the length of street walls (m), land elevation above sea level (m), the number of trees with canopy cover, and the size of a parking space (m2). These were chosen because all of the data could be acquired from various sources and through field monitoring.
3. Results
3.1. A highly clustered spatial pattern of heat-related emergency calls between 2010 and 2014
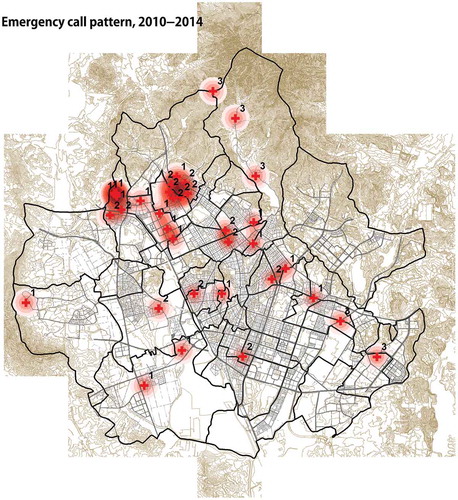
The results suggested that the distribution of heat-related emergency calls between 2010 and 2014 was highly clustered to the northwest of the city (). Four administrative areas of Pajang-dong, Jeongja 1 and 3-dong, and Yulcheon-dong had a disproportionately large number of emergency calls – about 42.5% of the total calls (=17 out of 40 calls) recorded in the city – over the years. The ALM I test indicated that the clustering pattern was statistically significant at a 5% level in Pajang-dong and at 1% level in the rest. No other area’s medical calls were clustered at a 5% significance level. The clustering pattern of the emergency calls was largely unexpected because the four areas occupied only 12.0% of the city’s total land area and had a population size of no more than 11.2% of the city’s total population. Over the five-year period, 1.2 heat-related medical calls per 10,000 residents were made in the four areas, which was four times higher than the city’s average ratio. Additionally, the Pearson’s correlation coefficients between emergency calls and three population indices ranged from −0.22 to 0.11, indicating that the clustering of the emergency calls was not well explained – sometimes the relationship was even negative – by any of the three population-related variables.
Figure 1. Distribution of emergency calls in Suwon between 2010 and 2014 (total number = 40). The crosses indicate the actual location of the calls. Each number in the figure indicates the results of cluster analyses involving a set of urban design variables described in the methods. (1) type I sites (high-rise building complexes with large in-between open space), (2) type II sites (low-rise, high-density residential districts), (3) type III sites (hilly terrain and sloped parkland).
The four area’s socioeconomic features provided a moderately reasonable clue supporting the uneven pattern of medical calls, but the relationship seemed to be very weak. For instance, Pajang-dong had a significantly high percentage of population living below the poverty line, around 2.2%, which was far higher than the city’s average of 1.35%. But on average, the four areas’ poverty level was at around 1.09%, making the influence of poverty concentration on heat illnesses uncertain. Jeongja 1-dong was populated by 2160 elderly residents over 65, which recorded the highest number of the aged across the city, but the average percentage of the four areas (=6.68%) showed minor difference from that of the city’s average (=6.24%). Despite the spatial clustering of emergency calls, patients in the four areas did not exhibit particularly distinctive socioeconomic characteristics. The age composition, sex, the degree of other diseases or hospitalizations among the patients in the four areas was similar to the average of patients in Suwon. To better compare the pattern of emergency calls with multiple socioeconomic circumstances of the city, the results of the heat vulnerability mapping are reported in the following section.
3.2. The limited capability of heat vulnerability mapping in predicting the occurrence of the emergency calls
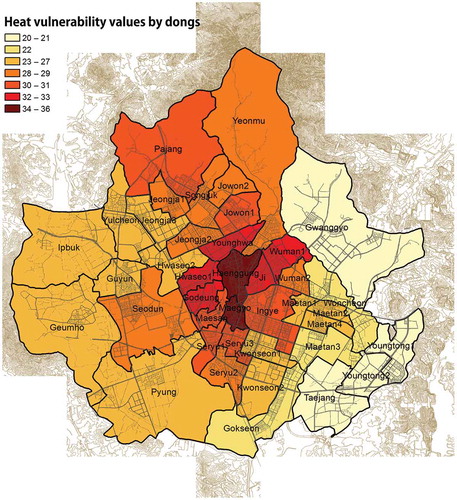
Mapping the heat vulnerability analyses showed that the cumulative vulnerability index values ranged between 20 (=least vulnerable) and 36 (=most vulnerable) across 40 administrative areas in Suwon, with a mean of 27.8 and an SD of 4.0 (). According to the analyses, the most vulnerable place in the city was the inner-city area. The ALM I test suggested that four inner-city areas, such as Haenggung-dong (vulnerability value = 36), Ji-dong (v = 33), Maegye-dong (v = 35), and Wuman 1-dong (v = 33) in Paldal-gu, showed the highest vulnerability values at 5% significance level. Haenggung-dong is an early settlement built in the late eighteenth century and located within the City Wall with a length of 5.4 km. The settlement expanded significantly over the early twentieth century, largely as a colonial outpost connected with modern railway lines under Japanese influence. After the country’s independence, its nearby areas like Ji-dong, Maegye-dong, and Wuman-dong were rapidly urbanized under the 1976 Urban Master Plan and the 1980s’ Land Readjustment policies, among others. But the area gradually declined as the city’s administrative centers and retail hubs moved away, leaving Haenggung-dong increasingly occupied by aged, less-affluent, and less-healthy households (Choi Citation2014). A moderately vulnerable neighborhood, according to the mapping analyses, was the northwestern part of the city. Jeongja 1-dong (v = 29) and Jeongja 3-dong (v = 26), for instance, showed vulnerability values similar to the medium of the city. The least vulnerable area was to the southeast of the inner-city area, including Maetan 3-dong (v = 22) and Yeongtong 1-dong (v = 21) and Yeongtong 2-dong (v = 20), where the Samsung R&D center and newly developed superblock housing complexes were agglomerated.
Figure 2. Cumulative heat vulnerability values by administrative units (Dongs), Suwon. Dark area indicates a neighborhood that might be highly vulnerable to heatwaves.
These results might indicate that the mapping method did not successfully predict the location of vulnerable neighborhoods with frequent heat-related illnesses over the years. For instance, the northwestern part of the city, which was a hotspot of emergency calls, showed moderately – but not significantly – high vulnerability values. Although Pajang-dong (v = 31) and Jeongja 1-dong (v = 29) showed vulnerability values slightly higher than the city’s average of 27.8, the other two areas like Jeongja 3-dong (v = 26) and Yulcheon 1-dong (v = 26) showed vulnerability values lower than the city’s average. None of the four areas belonged to the top 25% of vulnerability values among the city’s administrative areas. This indicated that the area did not have a particularly high percentage of people susceptible to heat-related health risks, but the heatwave impacts over the last five years might have been greatly amplified there due to other reasons. Another example of this apparent contradiction was the inner-city area. Emergency call data showed that this area was not particularly vulnerable to extreme heat events, having no more than two emergency calls over the years, whereas the vulnerability values of the communities were reported to be significantly high. The spatial mismatch indicated that although the inner-city area was largely inhabited by potentially vulnerable populations, there might be some urban design characteristics or collective social behaviors that reduced the impact of health risks associated with heatwaves. Nonetheless, it is difficult to say that the vulnerability mapping method has completely failed to predict the pattern of heat-related illnesses. Despite some limitations, the mapping helped to visualize the location of highly resilient neighborhoods during heatwaves. For instance, the southeastern part of the city was reported to have a very small number of emergency calls over the years, which could be predicted based on the very low vulnerability values of Maetan 3-dong, Yeongtong 1 and 2-dongs.
A major question raised through the analyses was: Why did two neighborhoods with very similar vulnerability values show a striking difference in the number of heat-related emergency calls? This question also manifested in two nearby neighborhoods: a moderately vulnerable neighborhood in the northwestern part of the city, such as Pajang-dong, Jeongja 1 and 3-dong, and Yulcheon-dong (average v = 28.0), which was a hotspot of emergency calls, and a nearby neighborhood including Songjuk-dong, Jowon 2-dong, Jeongja 2-dong, and Hwaseo 2-dong (average v = 27.8), which was also moderately vulnerable from the mapping but where only one emergency call was made. Despite similar population compositions and environmental characteristics, some undiscovered forces leading to differences in the actual vulnerability of the communities seemed to be in play. Although the research was not designed to provide a definite answer to the question, some urban design characteristics of the northwestern part seemed to be associated with greater heat vulnerability. The results are discussed in the following section.
3.3. Three urban design typologies associated with heat-related emergency calls
The results of the cluster analyses showed that the urban design characteristics associated with emergency calls in the study area can be grouped into the following types (). Once a dendrogram was visualized based on the similarity among the sites, the number of clusters was determined based on the stopping rule of pseudo-F index (Caliński & Harabasz Citation1974). Each group represented a type of urban area with different built environment characteristics ().
Figure 3. Results of average-linkage cluster analysis.
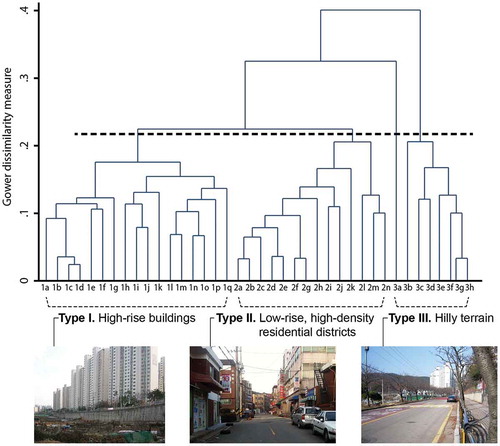
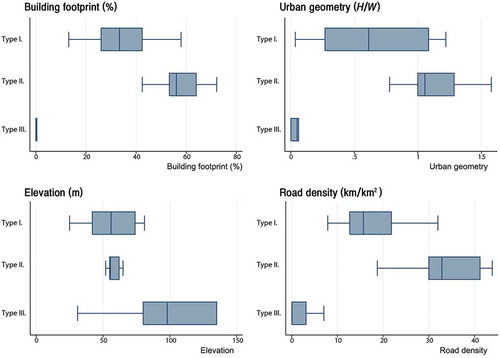
Figure 4. The site characteristics of type I, II, and III. The box plots indicate the 25th percentile (the left side of each box), the median, and the 75th percentile (the right side of each box). The whiskers represent the upper and lower adjacent values. Building footprint: the ratio of building footprint coverage compared to land area (%); urban geometry: the ratio of H/W, where H is the average height of building walls along a selected street and W is the width of the street; elevation: the height of emergency calls above sea level; road density: the ratio of the length of total road network to the land area within a 300 m distance from an emergency call location.
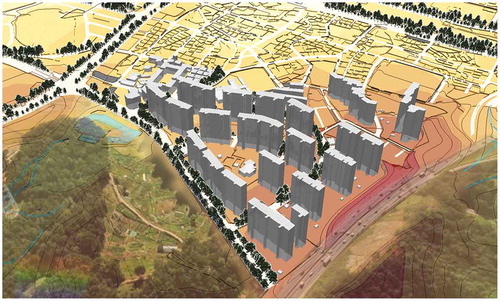
3.3.1. Type I: high-rise building complexes with large in-between open space
The first type was characterized by mid- to high-rise building complexes built on large-scaled urban blocks. This type included large-scaled apartment buildings containing over 1000 households, densely built industrial quarters, and a few stand-alone government administrative buildings in the middle of mid-rise residential districts. The specific sites were the Yuljeon Public Housing complex built in the early 2000s for 1078 households with 14- to 23-story high-rise towers, an open space with an area of 4600 m2 for the Jungbu Regional Tax Office, and a 2- to 3-story neighborhood shopping area abutting a 10-story Jowon-dong Byuksan Housing complex. The typical block pattern was a superblock gridiron layout, with the length of a block’s edge ranging between 150 and 500 m. The sites often had large open spaces used as playgrounds, public parks, or open-air parking lots surrounded by a group of evenly spaced, relatively homogeneous building structures. Some of the open spaces were situated in the middle of the block while others were located along their edges. Within the context of Suwon, the type I sites shared a spatiotemporal similarity: all had remained undeveloped by the mid-1980s – in some cases protected as nature reserves or farmlands – but came to be built beginning in the late 1980s and the early 1990s under the city’s pro-growth master plans.
The size of the individual buildings was fairly large, but this does not mean that the type I ground area was predominantly covered with oversized building floors. In fact, on average, the type I complexes presented a moderately high – but not significantly high – building footprint ratio (or ‘building-to-land ratio’ that calculates the percentage of the area of a lot covered by the footprint of buildings), at about 32.4% (SD = 14.4). This ratio was far smaller than the maximum buildable ratio of 60% as stipulated for the residential zoning area in Suwon. Individual buildings were visually similar, largely built of reinforced concrete with big punched windows and the outer surface was typically finished either with painting or stone tiles. The averaged urban geometry of street (= H/W) was fairly small, at about 0.66 (SD = 0.4). This meant that the street section was far from a deep, valley-like shape, despite the average building height of the type ranging between 7 and 15 stories. The ratio of 0.66 was about half of the typical street section ratio of highly dense low-rise residential streets in the city. Additionally, the type was characterized with moderately high road density at about 17.4 km/km2, which was 2.5 times higher than the city’s average density of 6.91 km/km2 (Gyeonggi-do Transportation Database Citation2014).
3.3.2. Potential links between type I urban design characteristics and heat vulnerability
The type I sites were a hotspot of multiple emergency calls due probably to the undesirable architectural quality of individual buildings and their spatial arrangement within a block, along with other social and medical conditions of the population (). First, the high thermal mass of the type I buildings – largely built of well-insulated, high-heat capacity poured concrete or brick structure with large windows exposed to summer sunshine – created a heat-vulnerable living environment. Since a predominant number of the type I buildings had a high surface-to-glass ratio and southern-and western-facing living spaces with wide bottom-to-top windows, the indoor temperature of their housing units went up very rapidly during extreme heat events. Under the four-hour sunshine policy requirement for residential districts in Korea, the type I apartment houses in Suwon were spaced with the distance of buildings (W) equal to the height of the building (H). Although the ordinance – H:W = 1:1 – greatly improved the sunlight environment of individual housing units, some units that removed a western-facing balcony or an outdoor louver came to be exposed to intensive solar radiation over longer hours during heatwave events. The high temperature often continued throughout the afternoon and after midnight due to the sustained release of previously stored solar heat gain to the interior of the building, as well as the formation of urban heat islands at the local and regional scales. The type I residential district of Suwon largely accommodated working couples with one or two children who sometimes lived with their parents. The parents often cared for the children while the couples were at work. The families were largely low-income households, using minimal electricity for air conditioning to avoid high-utility bills. Although increased indoor air temperatures affected all inhabitants, the impact was disproportionately greater on infants and toddlers among the family members. The person who first reported an emergency – often one of the grandparents of a kid – was also not very aware of the possible heat risks associated with toddlers, but was determined to call for help after the patient suffered a series of convulsions for 3–5 minutes. The symptoms, however, were quickly remediated by medical treatment from emergency teams and did not lead to increased mortality rates.
Figure 5. 3-D view of a typical type I site (the Yuljeon Public Housing complex).
Second, another health risk factor associated with the type I urban design involved large open spaces situated between building blocks, especially those without proper shade, arcades, or a cooling shelter. Open spaces that allow for a variety of uses and informal interactions among pedestrians are often assumed to be a desirable spatial quality by urban and landscape designers (Thompson Citation2002). However, that same open space may serve as a hazardous trap that exposes vulnerable people – often aged populations over 65 – to high temperatures for long hours. Aged populations living in the type I area showed great social demand for the use of nearby public spaces, such as a hardscape playground in the middle of a residential district, an urban agriculture site, and a sloped walking path leading to nearby public parks. For instance, an open-air urban agriculture site to the west of the Yuljeon Public Housing complex attracted a large number of aged populations working on the field to harvest edible crops in the afternoon. Additionally, a hardscape plaza in front of the Jungbu Regional Tax Office was occupied by a 71-year-old female protestor, who was standing there for more than three hours before she finally collapsed at around 3 pm on a very hot summer day.
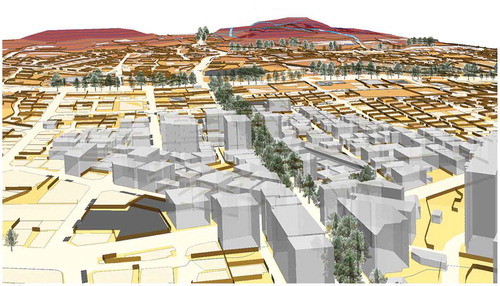
3.3.3. Type II: low-rise, high-density residential districts with a fine-scaled street layout
The type II areas represented low-rise, high-density residential districts located in and out of the inner-city area of Suwon. Largely developed throughout the 1970s and the 1980s, the type II sites had a residential subdivision layout comprising small-sized, fine-scaled parcels and rather poorly equipped public infrastructure. The average size of the parcels was 184.3 m2 (SD = 78.9), with the smallest measuring 33 m2 and the largest 491 m2. The typical length of the street frontage of each parcel was about 13 m, and the parcels faced a minor road separating a back-to-back block layout. Elongated gridiron layouts characterized the urban form of the type II district and each gridiron block was typically surrounded by two 15 m major roads and two 4–6.5 m minor roads. Unlike the high-rise building complex equipped with exclusive parking space, minor roads in the type II sites served as multiuser parking sites utilized by shoppers, guests, residents, and night-time temporary visitors to the area.
In the type II area, the largest allowable building footprints often occupied each parcel, with some exceptions. The average building footprint of the type II area was about 58.0% (SD = 10.7). This coverage was about 1.8 times larger than the type I area. Due to the presence of narrow internal streets defined by masonry walls and street gates, the average urban geometry of the streets was nearly two times higher than the high-rise building type, at about 1.22 (SD = 0.53). Although the valley-like shape of the residential streets sometimes provided shade to pedestrians to mitigate exposure to direct solar radiation during the daytime, the streets with a small sky-view factor often led to the formation of increased heat-island effects, causing greater pedestrian and resident discomfort in the late evening due to the trapping of long-wave radiation from urban surface. Additionally, the average density of roads – largely covered with black asphalt having low albedo and high sensible heat flux – was also nearly double the density of the type I area, at about 33.7 (SD = 7.4). Two-to three-story buildings built of masonry construction and simple concrete beams were typically of the area. But between the late 1990s and the present, a significant part of the low-rise masonry buildings was increasingly replaced with four-to five-story residential villas built of reinforced concrete finished with the dark gray exterior insulation system (e.g., Dryvit finish), sheet metal, or stone tiles. The mid-rise residential area was sprinkled with neighborhood vegetable markets, butcher’s shops, small home offices, and private educational institutes. The neighborhood retail stores comprised a very small building, and each retail module’s street frontage was typically between 3 and 6 m.
3.3.4. Potential links between the type II urban design characteristics and heat vulnerability
The urban design characteristics of the type II residential area were imbedded with multiple heat vulnerability factors and the urban forms contributed significantly to the microclimatic temperature rise during heatwave events (). A very narrow street section, its predominantly dark urban surface with low reflectivity, minimal vegetated spaces and little evapotranspiration, great heat emission on the street from vehicles and the outdoor units of air conditioners, reduced wind speed due to the greater roughness of different building heights, and a very high proportion of households living on the top floors of poorly insulated houses interactively contributed to the increased heat vulnerability of these communities. Additionally, active street-involved activities were commonly observed in the type II area. Unlike the type I open space with finite uses like urban farming or a football game, the social uses of the type II streets and parks were much more diverse. For instance, vehicles parked along one side of the street while the opposite side was casually used by young children and their parents; aged residents spent long hours sitting on the steps in front of the gate of their homes or in an open-air pocket park with or without a pergola; the same places attracted pedestrians commuting to workplaces in the morning, as well as night-time cab drivers and delivery service people taking a break; local bars attracted a larger number of strangers to the area at night. Although the flexible social uses of the narrow type II streets created attractive streetscape with some shade, greater heat exposure to physically exhausted people on the street became a source of serious heat illnesses. Since the streets were relatively human-scaled and pedestrian-friendly, the inhabitants routinely spent a large amount of time outside and seemed to be less prepared for heatwaves compared to very large, hot open-air spaces located in the type I sites. Although some thermal adaptation might have occurred among the people who were repeatedly exposed to hot climatic environment over time, a 38-year-old interviewee who had experienced heat stroke in the type II residential area reported that she was not reluctant to stay on the street even during the hottest days because the outdoor space was perceived to be highly habitable and safe in comparison to the hot and humid indoor space. This perception might have caused the occurrence of heat-related illnesses across a wide range of age groups in the type II area compared to the type I area in which heatwaves have affected a disproportionately large number of infants and toddlers. Additionally, a small number of people residing and working in the type II retail spaces were negatively affected by heatwaves. An 80-year-old security guard officer working for a supermarket in Jeongja-dong, for instance, stayed in his makeshift office space over night during the weekdays. The officer became critically dehydrated due to an extremely high indoor temperature but managed to make an emergency call at around 7:30 pm before he lost consciousness.
Figure 6. 3-D view of a typical type II site.
3.3.5. Type III: hilly terrain and sloped parkland adjacent to a densely urbanized district
The third type involved the city’s hilly terrain and sloped parkland. The city is perched on the slope of several mountains, including Mt. Gwanggyo. This led to the formation of sloped green strips along the edge of the city’s urbanized land. The strips link scattered natural vegetation patches, farmlands, and parkland sites, such as Yeungheung Park, Gwanggyo Lake Park, Mt. Gwanggyo, and Mt. Dukseong. These serve as important recreational places for tracking, education, and sports activities. The hilly terrain was sparsely occupied by buildings and roads, for example, the building footprints covered no more than 1.6% of the type III land area and the road density was 2.1 km/km2, which was only 6% of the type II residential district. The type III sites were largely located on mid- to high-elevation areas, with the average elevation of 138 m above sea level. One of the streets along which multiple emergency calls were made was Gwanggyosan-ro – a gently sloped, two-lane local road with a 2 m sidewalk on one side of the road – linking the inner-city area of Suwon with Mt. Gwanggyo to the north of the city. The road meanders downwardly from the peak of the mountain and is frequently overcrowded with hikers and mountain climbers during weekends. Yeungheung Park was another example of a location from where multiple heat-related emergency calls were made. It is a neighborhood park used for hiking and exercising, with an area of 595,000 m2. On average, the urban geometry of the type III sites was 0.1, which was less than one-tenth of the ratio of the type II sites. The locational characteristics of the type III sites suggested that recreational sites adjacent to urban centers may be associated with a fairly high frequency of heat-related illnesses, although the social vulnerability of residential populations may not be great.
3.3.6. Potential links between the type III urban design characteristics and heat vulnerability
All of the emergency calls in the type III sites were associated with intense physical activity, such as walking somewhere, exercising in a group, or working for long hours in a rather isolated place. Since the sites were largely located in the middle of vegetated hills or near streams, temperature rise alone did not seem to have posed significant health risks. Rather, the open-air environment associated with intense recreational and other physical activities was the major source of health risks. The threat was greatly amplified among the people either previously diagnosed with diabetes and other illnesses, or who drank alcohol before they began their physical activities. All of the type III patients showed symptoms of dehydration before their heat-related illnesses were observed by the callers. The physical isolation of the type III sites posed a great challenge to patients who were highly vulnerable to heat. For example, when there were a group of people involved in a physical activity, the patient who began to suffer from dehydration was quickly relocated to a safer place like under a tree by one or more people in the group, and then an emergency call was made immediately. However, there was a 46-year-old female biker who experienced fatal injuries from a bicycle accident, but who remained on the street for more than an hour without any help or medical treatment.
4. Discussion
The study investigated the spatial patterns of heat vulnerability and the associated urban design characteristics, analyzing the distribution of heat-related emergency calls in Suwon between 2010 and 2014. The research is a first-of-a-kind report in which fragmented place-based studies and climatic knowledge have been put together to inform urban designers and planners of potentially useful models for designing sites associated with heatwaves. However, the results might be preliminary and speculative due to the limited number and the scope of the collected emergency call samples. Also, the results of the cluster analyses are only descriptive and thus require subsequent research to explain the structural relationship between place variables and the degree of heat vulnerability in urban area. A major limitation of the research is that counterfactual samples with consistent environmental and biomedical variables were not available. To better examine the urban design effects on a community’s heat vulnerability, various aspects of heat vulnerability – such as residents’ behaviors and lifestyles during hot days, eating and drinking habits, micro-scale place variables, and housing design features modified for greater thermal comfort – need to be integrated. Additionally, as suggested in Kim and Rowe (Citation2012), similar studies in cities at a number of different scales in and out of Korea should be conducted to increase the applicability of the research since different-sized cities are likely to show large variations in environmental performance.
Acknowledgements
This work was supported under the framework of international cooperation program managed by National Research Foundation of Korea (NRF-2013K2A1A2055287). The research was conducted through collaboration with Harvard University Graduate School of Design (Professor Peter Rowe, co-authoring of a book titled Methodological Notes on the Spatial Analysis of Urban Formation (2013)) and the Korean National Park Service (Byeong Hyeok Yu). English editing was supported by the BK21 Plus Project in 2014 (Seoul National University Interdisciplinary Program in Landscape Architecture, Global leadership program towards innovative green infrastructure).
Related Research Data
References
- Ali-Toudert F, Mayer H. 2006. Numerical study on the effects of aspect ratio and orientation of an urban street canyon on outdoor thermal comfort in hot and dry climate. Build Environ. 41:94–108.
- Caliński T, Harabasz J. 1974. A dendrite method for cluster analysis. Commun Stat. 3:1–27.
- Choi SH. 2014. Analysis of decline in Suwon city. Presentation in the Suwon Research Institute Academic Forum; 2014 Apr 17; Suwon, Korean.
- Dolney TJ, Sheridan SC. 2006. The relationship between extreme heat and ambulance response calls for the city of Toronto, Ontario, Canada. Environ Res. 101:94–103.
- Eliasson I. 2000. The use of climate knowledge in urban planning. Landsc Urban Plan. 48:31–44.
- Giridharan R, Lau SSY, Ganesan S, Givoni B. 2007. Urban design factors influencing heat island intensity in high-rise high-density environments of Hong Kong. Build Environ. 42:3669–3684.
- Gyeonggi-do Transportation Database. 2014. Transportation database [Internet]. Available from: http://gtdb.gg.go.kr/
- Hajat S, O’Connor M, Kosatsky T. 2010. Health effects of hot weather: from awareness of risk factors to effective health protection. Lancet. 375:856–863.
- Kim S, Park S, Lee JS. 2014. Meso-or micro-scale? Environmental factors influencing pedestrian satisfaction. Transp Res Part D: Transp Environ. 30:10–20.
- Kim S, Rowe PG. 2012. Does large-sized cities’ urbanisation predominantly degrade environmental resources in China? Relationships between urbanisation and resources in the Changjiang Delta Region. Int J Sustain Dev World Ecol. 19:321–329.
- [KCDC] Korea Center for Disease Control & Prevention. 2013. Annual report on the notified patients with heat related illness in Korea. Osong: Korea Center for Disease Control & Prevention. Korean.
- [KMA] Korea Meteorological Administration. 2014. Weather information [Internet]. Available from: http://www.kma.go.kr/
- Kovats RS, Hajat S. 2008. Heat stress and public health: a critical review. Ann Rev Public Health. 29:41–55.
- Liang S. 2001. Narrowband to broadband conversions of land surface albedo I: algorithms. Remote Sens Environ. 76:213–238.
- McGeehin MA, Mirabelli M. 2001. The potential impacts of climate variability and change on temperature-related morbidity and mortality in the United States. Environ Health Persp. 109:185–189.
- Oke TR. 1981. Canyon geometry and the nocturnal urban heat island: comparison of scale model and field observations. J Climatol. 1:237–254.
- Oke TR. 1982. The energetic basis of the urban heat island. Quart J Royal Meteorol Soc. 108:1–24.
- Ratti C, Raydan D, Steemers K. 2003. Building form and environmental performance: Archetypes, analysis and an arid climate. Energy Build. 35:49–59.
- Reid CE, O’Neill MS, Gronlund CJ, Brines SJ, Diez-Roux AV, Brown DG, Schwartz JD. 2009. Mapping community determinants of heat vulnerability. Environ Health Persp. 117:1730–1736.
- Ryu Y, Baldocchi DD, Verfaillie J, Ma S, Falk M, Ruiz-Mercado I, Hehn T, Sonnentag O. 2010. Testing the performance of a novel spectral reflectance sensor, built with light emitting diodes (LEDs), to monitor ecosystem metabolism, structure and function. Agric For Meteorol. 150:1597–1606.
- Ryu Y, Lee G, Jeon S, Song Y, Kimm H. 2014. Monitoring multi-layer canopy spring phenology of temperate deciduous and evergreen forests using low-cost spectral sensors. Remote Sens Environ. 149:227–238.
- Suwon Government. 2013. Understanding the livable city of Suwon. Suwon: Suwon Government. Korean
- Thompson CW. 2002. Urban open space in the 21st century. Landsc Urban Plan. 60:59–72.
- Tucker CJ. 1979. Red and photographic infrared linear combinations for monitoring vegetation. Remote Sens Environ. 8:127–150.
- Zhao J, Xiao L, Tang L, Shi L, Su X, Wang H, Song Y, Shao G. 2014. Effects of spatial form on urban commute for major cities in China. Int J Sustain Dev World Ecol. 21:361–368.
- Zhao J, Zhu YG, Shao G, Ness D. 2008. Coping with an urbanising world: interdisciplinary research towards sustainability. Int J Sustain Dev World Ecol. 15:284–287.
- Zheng S, Xiong X, Vause J, Liu J. 2013. Real-time measurement of wind environment comfort in urban areas by environmental internet of things. Int J Sustain Dev World Ecol. 20:254–260.