
ABSTRACT
Coupled social and ecological systems need to be understood from a dynamic perspective in order to operationalise complexity concepts, such as tipping points, for sustainable ecosystem management. In this study, we strive to achieve this type of conceptual understanding through the analysis of the relationships (e.g. strength, nonlinearity) between the trends of ecosystem services (ES) and human wellbeing (HWB) between 1960 and 2010 in the south-west Bangladesh delta using generalized additive and logistic regression models. We use sequential principal components analysis to investigate the connectedness within the social–ecological system as a measure of resilience. We also use published literature to help develop a system dynamic framework in order to investigate how ES and HWB are interlinked. Overall, our results support previous work, which depicts that material wellbeing (basic materials for a good life) having a strong relationship with provisioning services, which in turn, show a weak relationship with the quality of life (security and health). Moreover, our analysis confirms the ‘Environmentalist’s Paradox’ that HWB has increased despite the deterioration in ES. However, our results suggest that provisioning services are not the only important reason for the increases in observed HWB, as these have also been substantially influenced by technology and capital investment (aid and subsidy). In addition, worsening trends in regulation services and in ‘slow’ variables such as climate suggest that the resilience of the overall social-ecological system is decreasing. Such changes may have severe consequences if they continue, for example, if temperatures exceed the upper physiological limits of key provisioning services (e.g. rice, fish) in the Bangladesh delta. These indicators all suggest that although in terms of HWB the deltaic social–ecological system may be successfully adapting to environmental change, it may also be close to transgressing critical ecological boundaries in the near future.
Introduction
The Millennium Ecosystem Assessment (MA) developed a conceptual framework to explore the complex relationships between ecosystem services (ES) and human wellbeing (HWB). Due to the importance of this relationship for policy decisions and human actions, several studies have adopted this framework empirically at national and subnational scales (Butler & Oluoch-Kosura Citation2006; CRA Citation2006; Hossain et al. Citation2013; Santos-Martın et al. Citation2013). It is evident from regional (e.g. Scherr Citation2000; Irz et al. Citation2001; CRA Citation2006; Hossain et al. Citation2013; Santos-Martın et al. Citation2013) and global scale (Raudsepp-Hearne et al. Citation2010) studies that provisioning services are supporting improvements in HWB. Of particular note is the study by Santos-Martın et al. (Citation2013) who analysed the relationship between ES and HWB in Spain using comprehensive lists of indicators and a structural equation model within the Driver-Pressure-State-Impact-Response framework. They demonstrated that, in contrast to regulating services, provisioning services have a direct and highly significant relationship with HWB. However, HWB indicators, such as life expectancy at birth, are not only affected by provisioning services, but are also directly driven by human capital formation (e.g. GDP, education) and technological progress (Cervellati & Sunde Citation2005). In addition, rising living standards and wellbeing could eventually be affected by the negative consequences of low levels of regulating services, as in the argument put forward to explain the ‘Environmentalist’s Paradox’ (Raudsepp-Hearne et al. Citation2010) of rising HWB in the face of environmental deterioration, which then may need to be offset by investments in human capital (e.g. government initiatives for education and health) and technology (e.g. water quality purification, alternative livelihood sources) (Hossain, Johnson, et al. Citation2015). An understanding of the full relationship between ES and HWB demands a dynamical perspective based on time series data (Carpenter et al. Citation2009) that can give insight into the complex and uncertain nature of a social–ecological system, for example, the potential time lag effects between regulating services and HWB.
Previous social–ecological studies in Bangladesh delta have mainly used conceptual models for specific sectors, such as shrimp farming, (Datta et al. 2010) and climate change adaptation (Shamsuddoha et al. Citation2013, FAO Citation2006) and analysed the likely impacts of single drivers of change, such as climate (e.g. Husain et al. Citation2001; Swapan & Gavin Citation2011; Hossain et al. Citation2013). An improved approach would use a conceptual model that describes a fuller range of complex and dynamic relationships (e.g. nonlinearity, feedbacks) between social and ecological systems that would provide the means of structuring real world situations and aid the understanding of sustainable ecosystem management (Hodge Citation1997; Rounsevell et al. Citation2010). In this study, we strive to achieve this type of conceptual understanding through the analysis of the relationships (e.g. strength, nonlinearity) between the trends of ES and HWB between 1960 and 2010 using generalized additive and logistic regression models. We use sequential principal components analysis (PCA) to investigate the connectedness within the social–ecological system as a measure of resilience. We also use published literature to help develop a system dynamic framework in order to investigate how ES and HWB are interlinked. It is intended that the findings from the present study will be useful in operationalising concepts such as ‘thresholds and tipping points’ and ‘safe and just operating spaces’, beyond which the risk of unpredictable and damaging change to social–ecological systems becomes very high, for regional-scale sustainability and for ecosystem management (Dearing et al. Citation2014).
Our approach comprises six research steps: (1) collecting and collating time series data for ES and HWB indicators as well as for other social, economic and climate change; (2) analysing the past trends of provisioning and regulating services, and the current status of HWB; (3) analysing the relationship between regulating services and provisioning services indicators; (4) analysing the relationship between provisioning services and HWB indicators; (5) developing a conceptual system dynamic model for each of those indicators and (6) exploring the relationships between each of those indicators.
Data and methods
Study area
The south-west coastal part of Bangladesh () represents 16% of the total land area (~25,000 km2) of Bangladesh with a population of 14 million people (BBS Citation2010). Our study area comprises 60% of the Khulna Division and the whole Barisal Division, an agro-ecological landscape representative of the Ganges tidal floodplain (FAO-UNDP Citation1998) and mapping onto the linked ESPA delta project area (www.espadelta.net). This coastal ecosystem produces more than 1300 million USD of gross domestic product (GDP) (BBS Citation2010) which contributes to 277 USD GDP per person (Sarwar Citation2005). However, around 38% of the people of this region live below the poverty line (BBS Citation2010). The livelihoods in this region are dependent on agriculture (~40%), fishery (~20%) and forestry (~25%) with the remainder including labourers and professionals (e.g. teachers, government officials and businessman). The Sundarbans, the world’s largest mangrove ecosystem, provides livelihoods for about 1.5 million people and protects about 10 million coastal people from storm surges (Islam & Haque Citation2004).
Figure 1. South-west coastal region of Bangladesh.
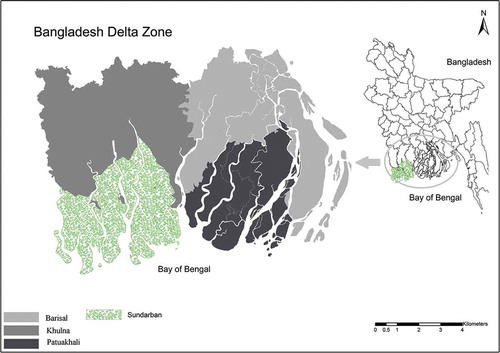
The humid climate gives an annual rainfall of 1400–2100 mm and an average temperature of 30–34°C in the dry summer period and 15–20°C in winter (Hossain et al. Citation2014). The region has been affected by 174 natural disasters within the 1965–2010 time period (Rahman et al. Citation2010). Floods in 1992 damaged 50% of total food grain, and drought in 1997 caused 1 million tons of food grain loss (Islam et al. Citation2011). Besides these natural disasters, the region is also experiencing challenges due to human intervention, including water shortages due to dam construction upstream of the Ganges delta (Hossain, Dearing et al. Citation2015) and polder construction in coastal areas (Islam Citation2006). Moreover, expansion of the shrimp industry has degraded the water quality as well as the density of the mangrove forest (Hossain, Dearing et al. Citation2015). The social-ecological system of this region is rapidly changing in comparison to previous decades, because of sea level rise, land-use changes, water scarcity, migration and urbanization (ADB Citation2005; Hossain, Dearing et al. Citation2015) with climate change (Hossain et al. Citation2013) adding an extra layer of complexity for environmental managers. The high dependency of the residents’ livelihoods on ES and their ability to adapt to growing environmental threats underpins the importance of treating the area as a highly complex social–ecological system.
Ecosystem services
Ecosystem service indicators (Supplementary Table 1) from different locations across the region were selected based on data availability 1960–2010, the degree to which they reflect well-known environmental challenges, and their measurability. Total rice, shrimp and fish production, plus the mass of raw materials obtained from the mangrove forest are the main indicators for provisioning services, whereas temperature and precipitation are the key indicators of local climate (de Groot et al. Citation2006; WRI Citation2013; Hossain et al. Citation2014; Hossain, Dearing et al. Citation2015). Climate data from three weather stations (Khulna, Barisal and Patuakhali) have been used to calculate trends in average annual climate for the study area. Water flow data from Hardinge Bridge (1931–2010) have been used to investigate the trend in water availability. This stream point of the Padma River (Ganges) is the major passage of water flow into the Bay of Bengal and also the major water source of the Sundarbans. We also chose surface water salinity and soil salinity to show the trends of water quality and soil quality, respectively, key indicators of regulating services. Crops damaged by different natural disasters have been selected to analyse the trends of natural hazards protection. Mangrove density was selected as the best indicator (Costanza et al. Citation1997; de Groot et al. Citation2002) of maintenance of biodiversity, which is the main source of raw materials in this area. An earlier paper (Hossain, Dearing, et al. Citation2015) provides details about the selection of ES indicators and also the detailed analysis of ES at different spatial and temporal scales using a number of time series analyses (e.g. Mann–Kendal and Lepage tests). Supporting ecosystem services (e.g. nutrient cycling, primary production) are excluded due to the lack of data and avoidance of double counting ((de Groot et al. Citation2010; Petz et al. Citation2012).
Human wellbeing
HWB is a subset of economic and social wellbeing factors (OECD Citation2013) and has been classified into five dimensions: health, material, security, freedom and social relations (MA Citation2005). Except for material wellbeing, all these indicators fall within the quality of life dimension (OECD Citation2013). Our main data source for HWB is the most recent (2010) household income and expenditure survey (HIES) undertaken by the Bangladesh Bureau of Statistics (BBS) with the help of the World Bank using a two-stage randomly selected sampling strategy. The number of primary sample units (PSU) and household samples selected for the surveys are 1000 and 12,240, respectively. Moreover, surveys were conducted across the year to account for seasonality (BBS Citation1997, Citation2011). The HIES is representative at national and divisional level (Azam & Imai Citation2009; Szabo et al. Citation2015). The list of selected HWB indicators (Supplementary Table 2) is based on data availability, measurability and the Sustainability Development Goals (SDG 2030) and Millennium Development Goals (MDG 2015) for Bangladesh, for example, the percentage of ‘births attended by skilled health staff’ and ‘primary education’ attainment. In addition, we have also used the percentage of households with access to ‘sanitation’ and ‘safe drinking water’ in each year to analyse the trends in personal security over the study area. We have classified both sanitation facilities and drinking water sources into improved and unimproved types as per the Demographic and Health Survey (DHS Citation2007). Sanitary latrines and pacca latrines (water seal and pit) are categorized within the ‘improved sanitation’ category, whereas kacha, open and other types of sanitation facilities are labelled as ‘unimproved sanitation’. Similar approaches have been followed to classify improved (supply, tube well) and unimproved (pond/river, well and others) sources of drinking water. In case of ‘education’, we have defined the categories as ‘primary education completed’ and ‘primary education not completed’.
Gross domestic production (GDP) and income have been used for analysing material wellbeing (both converted to current values using the Consumer Price Index). Trends of GDP have been analysed with respect to each of the four provisioning services (crops, fish, forestry and shrimp) from 1978 to 2005. A lack of data means that we have calculated the GDP share from each sector (except forestry) only for the period 1978–1992, and 2005. Besides GDP, we also analysed the average annual production and average cultivated area for crop production for all household level data in our study region. Similar to crop production, we have also analysed the average fish production (fish catch from rivers and cultivated in ponds) at household level and the average annual production of fish. These indicators are not only part of the sustainable agriculture under the dimension of material wellbeing, but also can be used as the proxy of provisioning service (e.g. food, fish) production at the household level to analyse the possible relationships between HWB and provisioning services.
Interlinkages between ES and HWB
In general, it may be assumed (Raudsepp-Hearne et al. Citation2010; OECD Citation2013) that there are two major sets of linkages that define the relationship between ES and HWB: (1) the underpinning role of regulating services with respect to provisioning services, and (2) the strong dependence of HWB on provisioning services (Supplementary Figure 1). In the Bangladesh delta, previous work (Mirza Citation1998; Azad et al. Citation2009; Swapan and Gavin Citation2011; Hossain et al. Citation2013; Hossain, Dearing et al. Citation2015; Hossain, Johnson, et al. Citation2015) provide ample evidence to enable us to explicitly link relevant regulating services to provisioning services, and thereby to identify dependent and independent variables within a relationship. Examples of this include the declining trends of water flow and higher rates of sea water intrusion that are leading to increasingly high ground water levels, and water flow reduction, higher temperatures and rainfall change that strongly influence food production. We use these empirical observations to develop hypothesized system dynamic models for agriculture, fisheries, shrimp farming and forestry, where dependent and independent variables are defined as a basis for statistical (both generalized additive models and logistics regression) analysis. Because of the nonlinear (characterized by thresholds and limiting functions) relationships between ecosystem functions and ES (Koch et al. Citation2009), we have used generalized additive models to analyse the types of relationships between the time series data of regulating services and provisioning services based on these hypothesized links. This non-parametric regression technique allows us to determine the underlying relationships between the variables (Hastie & Tibshirani Citation1990) using the following equation:
Here, response variable μ is related to link function g (.) and is a smooth non-parametric function (spline) (Green & Silverman Citation1994). Because of the power of this regression and capacity to analyse the complex relationship (e.g. nonlinear and non-monotonic relationships) between ecological variables, it has already been used for analysing ecological (Thomas & Mitchell Citation1991; Guisan et al. Citation2002) climate (Khan et al. Citation2007; Kim et al. Citation2011) and social-economic (Gouveia et al. Citation2003) systems. We have tested for heteroscedasticity in the time series data in order to avoid bias in the least squares estimates of the variance of the coefficients. We have also used sequential PCA in 10- and 20-year moving windows to measure changes in connectedness (Billio et al. Citation2010) between provisioning and regulating services (Zhang et al. Citation2015) as an indicator of system resilience (Ash & Newth Citation2007; Scheffer et al. Citation2012). For this, we have used trends for different varieties of crops since 1967 and trends for water discharge, temperature, rainfall and water salinity since 1967.
For the linkage between provisioning services and HWB, we use linear regression to analyse the relationship between the GDP time series (as an indicator of material wellbeing) and provisioning services. However, the lack of long time series data for HWB means that we can only link the provisioning services to quality of life indicators through the household level information in the HIES data. In this case, we generate linear relationships from linear and logistic regression because: (1) linear relationships (e.g. GDP and production) are exhibited in the linearity diagnostics (e.g. scatterplot, normality of residuals); (2) dependent variables (e.g. education, sanitation) are categorical and (3) unlike the ecosystem, the relationships in the social system often show linearity (e.g. income and health, wealth and primary school attainment) between independent and dependent variables (Ecob & Smith Citation1999; Gylfason Citation2001). We also analyse the 2010 HIES data with logistic regression to give the relationships between binary outcomes (e.g. having improved sanitation versus unimproved sanitation, connected to electricity versus not connected to electricity) and continuous covariates (e.g. crop produce, fish production). The categorization of improved and unimproved HWB indicators has already been given in the HWB indicator section. Here, we use code 0 as an unimproved and code 1 as an improved category of HWB (e.g. 0 = primary completed, 1 = not completed) for logistic regression. The relationship between the dependent variable and independent variables is established by the following equation:
Here, p is the probability of an improved HWB outcome, and p/(1-p) is the odds of improved HWB outcome (Menard Citation1995). In our case, quality of life (e.g. primary education, improved sanitation) is the dependent variable and production of crops and fish at household level is the independent variable. This analysis is limited to crop and fish production because data for households engaged in shrimp and forest production from the mangrove are not collected in the household surveys. Moreover, the sample size of HIES also varies for the households engaged in agriculture (N = 437) and fisheries (N = 347). Some of the HWB indicators such as ‘child mortality’, ‘infant mortality’ and ‘access to media’ are only available in the DHS dataset, which does not cover any production or income data and cannot be linked to the HIES dataset, meaning that analysis of the relationship between provisioning services and those HWB indicators is not possible.
Results
Trends of ecosystem services
shows the trends of ES in the Bangladesh delta. For provisioning services, total rice production in Bangladesh delta has increased two-fold (1.5–3.0 Mt) from 1972 to 2010, whereas total crop (all) production declined since 1975 in the same region. Inland fish production has increased since 1986 mirroring the increasing production from shrimp (from ~22,000 t to >30,000 t) and ponds (from ~50,000 t to >70,000 t) since 1999 ()). In contrast, collection of raw material (e.g. timber) from the Sundarbans rose to peak in the 1980s and 1990s (data are missing 1987–1991) before declining rapidly (from 150,000 t to 20,000 t) after 1996 ()).
Figure 2. Trends of ecosystem services and of ecosystem service indicators in Bangladesh delta.
Figure 3. Trends of GDP (a) and GDP shared by different sectors (b) in Bangladesh delta.
Records of regulating services show significant change. Salinity concentrations ()) in the river rose 2–10 fold and stood between 20,000 and 45,000 dS m−1 in the period 1980–2008. Similarly, soil salinity has also increased from ~1.5 dS m−1 in 1990 to ~3.5 dS m−1 in 2008. Overall, water availability declined from 1968 to 2000 because of the Farakka Barrage in the upstream Ganges (built in 1975). The mean flow rate has declined by ~50 m3/s/year in the period 1948–2010 with mean annual flows ~2000 m3/s lower in the post-Farakka period (1975–2010) compared to the pre-Farakka period. In addition, mean flow rates in the dry season have declined by ~−35 m3/s/year in the period 1965–2010, whereas wet season figures show small declines ~−6 m3/s/year in the post-Farakka period. Similarly, levels of ground water ()) have risen from ~2.5 m to ~1.75 m all over the delta region.
In the recent four decades (1971–2012), the annual average temperature ()) has increased by 0.74°C over the previous two decades (1948–1970). This change in annual temperature is also consistent with seasonal temperature trends which show an accelerating upward trend (~0.03°C/year) for pre-monsoon and monsoon seasons since 1990. Meanwhile, mean values for dry season (pre-monsoon and winter) and monsoon rainfall show declining trends (−60 mm/year and −35 mm/year, respectively) whereas post-monsoon rainfall shows an increasing trend (+4.5 mm/year) trend up until 2007. Annual rainfall ()) has increased by ~400 mm in the period 1991–2007 compared to 1971–1990. Damage to crops due to natural disaster (flood, rainfall and drought) was highest between 1987 and 1991 but the data show no long-term trend. Sea level may exert an influence on salinity, river flows and ground water level. It has risen ()) by ~200 mm in the period 1978–2003 at a rate of ~8.5 mm/year.
Tree density ()), used as the indicator of biodiversity, has halved for all types of species including the main species of sundari (Heritierafomes) from 1959 to 1996. Despite the loss of tree density, the number of tourists visiting the mangrove forest has increased six-fold (5000~35,000) between 1996 and 2010.
Human wellbeing
Total GDP ()) has increased from 74 million USD to 1025 million USD in the period 1978–2005 with an annualized increase of 36 million USD/year since the 1980s. GDP from crops, fisheries, shrimp and forestry show ()) similar trends to total GDP, but GDP from crops is higher (>100 million USD) than forestry and fisheries (~40–60 million USD) and shrimp (~20–40 million USD). About 40% of households are engaged in agriculture, whereas 20% and 25% households are engaged in fishery and forestry, respectively (Supplementary Table 3). The mean cultivated area is ~0.92 ha in which on average ~3800 kg crop is produced at the household level giving estimated mean and median household yields of ~10,600 kg/ha and 3800 kg/ha, respectively. The mean annual household incomes and costs of production are about 34,000 Bangladeshi Taka (BDT) (median 23,000 BDT) and 30,000 BDT (median 16,000 BDT), respectively (1 BDT = ~0.13 USD). The annual mean fish production per household at 465 kg gives a higher annual mean income (96,000 BDT) than from crop production.
shows that in 2010, ~74% households had access to improved ‘sanitation’ both for households engaged in fishery and in agriculture. In the case of access to improved ‘drinking water sources’, ~90% of households engaged in fishery had access to improved ‘drinking water sources’. Approximately, 34% and 41% of households engaged in agriculture and fishery, respectively, have an ‘electricity connection’ at home. For ‘births attended by skilled health staff’, a similar difference exists for households engaged in agriculture (46%) and fishery (30%). Besides these figures, currently ~45% of household individuals engaged in agriculture and fishery have completed primary education.
Table 1. Target and current status of MDGs in regional (south-west Bangladesh delta) and national scale of Bangladesh.
Regression analyses of ecosystem services
The generalized additive regression analysis shows (Supplementary Table 4 and ) that rice exhibits significant and positive relationships (, )) with temperature (β = 0.22, p = 0.03) and soil salinity (β = 0.71, p = 0.01), a non-significant relationship ()) with rainfall (β = 0.19, p = 0.12, and a significant (p = 0.04) negative (β = −0.21) relationship ()) with water discharge (water availability). Within these relationships, a linear relationship is observed for water discharge and soil salinity, whereas nonlinear relationships are found for both rainfall (cubic) and temperature (quadratic). It is evident ()) that rice productivity increases with temperature, although at temperatures beyond 27°C rice productivity begins to fall. Rice production declines when rainfall drops to within the range 4.0–6.7 mm/day or rises to more than ~12 mm/day.
Figure 4. Linear and nonlinear relationships between provisioning (rice and shrimp production) and regulating services. The central line represents estimated mean (spline), whereas the other two lines represent 95% (top lower and top higher) and 80% (middle two lines) credible interval, respectively.
Total fish production is negatively ()) related to water salinity (β = −0.13, p = 0.00) but positively ()) related to water discharge (β = 0.84, p = 0.23). Although fish production from ponds ()) shows a significant positive relationship (β = 1.47, p < 0.01) with water salinity, fish production from natural habitats (,)) exhibits a negative relationship for both water discharge (β = −0.13, p = 0.90) and water salinity (β = −2.32, p < 0.01). Nonlinear effects on fish production from ponds and natural habitats are found for water discharge respectively at ~9800 m3/s and ~13,370 m3/s. Similar nonlinear (quadratic) relationships are observed at ~39,000 dS m−1 water salinity for forest products ()). Moreover, the relationship between forest production and water salinity is negative (β = −0.63) with a higher confidence level (p < 0.01). Forest production also exhibits a weak negative but non-significant (β = −0.08, p = 0.66) relationship with water discharge ()).
Figure 5. Linear and nonlinear relationships between provisioning (fish and forestry production) and regulating services. The central line represents estimated mean (spline), whereas the other two lines represent 95% (top lower and top higher) and 80% (middle two lines) credible interval, respectively.
For selected covariate relationships with regulating services, shows that water discharge is positively (non-significant) associated (β = 20, p = 0.13) with rainfall ()), and also show non-significant and negative association (β = −0.92, p = 0.18) with water salinity ()). Water discharge exhibits a linear relationship with rainfall and water salinity. The rise in sea level shows a significant (p < 0.01) negative (β = −0.63) relationship with ground water levels ()), which also exhibits a significant (p < 0.01) negative (β = −0.70) relationship with water salinity ()). Soil salinity is also positively (β = 0.73) associated with water salinity ()), whereas it is non-significantly (p = 0.27) and negatively (β = −0.26) associated with ground water levels ()). Both of these relationships are nonlinear in that soil salinity remains at the same level as the ground water level rises between 1.41 and 1.79 m, but drops if the ground water level rises beyond 1.79 m. Soil salinity increases when water salinity exceeds 39,500 dS m−1.
Figure 6. Linear and nonlinear relationships among the variables of regulating services. The central line represents estimated mean (spline), whereas the other two lines represent 95% (top lower and top higher) and 80% (middle two lines) credible interval, respectively.
Curves for combined PCA axis 1 and 2 () since 1967 for two rolling windows (10 years and 20 years) suggest high levels of connectivity existed between regulating and provisioning services in the early 1980s were followed by a sharp decline until the 1990s with a rising trend after 1995. The changes in the connectivity curve from high to low values coincides with the shift in economic regimes from nationalization in the late 1970s to greater privatization from the early 1990s onwards. At this time, widespread rice-based farming gave way to an increasing diversity of land use, especially shrimp and fish cultivation, and a large variety of crop types. The recent rise in the curves tracks the trade globalization that started in the early 2000s, which may have had the effect of synchronizing the regional production of local products, such as jute, shrimps and fish, for export according to prevailing commodity prices.
Regression analyses of provisioning services and human wellbeing
At the household level, provisioning services (independent variable) are strongly associated with GDP (β = 0.70, p < 0.01) and income from crop production (β = 0.75, p < 0.01). Moreover, production cost is also positively (β = 0.50, p < 0.01) associated with production. Similar to crop production, GDP is also positively associated with forest products (β = 0.90, p < 0.01), shrimp production (β = 0.83, p < 0.01) and fish production (β = 0.94, p < 0.01) (Supplementary Table 5). Tables 2 and 3 show the results of the logistic regression between independent variables (continuous variable, e.g. crop production, fish catch at household level) and dependent variables (categorical variable, e.g. sanitation, education). Results from logistic regression show that households with higher crop production levels have a higher odds (39%) of ‘electricity connection’ (odd ratio (OR) = 1.39, p = 0.05) compared to the 10% higher odds of ‘electricity connection’ (OR = 1.10, p = 0.20) for the households engaged in fisheries (). Although the households with higher crop production have higher odds (22%) of ‘births attended by skilled health staff’ (OR = 1.22, p = 0.04) and higher odds (17%) of ‘primary education’ (OR = 1.17, p < 0.01), but the higher fish production at household level does not have higher odds of ‘primary education’ (OR = 1, p = 0.24) nor ‘birth attendance by skilled health staff’ (OR = 1.03, p = 0.60). In addition, ‘improved sanitation’ and ‘access to safe drinking water’ is not associated with crop production and fish production at households.
Table 2. Logistics regression results of cross sectional data (HIES 2010) for analysing the relationship between quality of life (e.g. ‘electricity’, ‘safe drinking water’) and production at household level.
Table 3. Logistics regression results of cross sectional data (HIES 2010) for analysing the relationship between quality of life (e.g. ‘electricity’, ‘safe drinking water’) and fish catch at household level.
Discussion
Ecosystem services and wellbeing
Since the 1980s regulating services have deteriorated while provisioning services and HWB have improved. The coastal zone has shown remarkable progress on improving ‘maternal health’ (births attended by skilled health staff) and ‘sanitation’ facilities compared to the national scale (). For both these indicators, the progress of the households engaged in fishery and agriculture at the regional scale is higher than at the national scale. Even the proportion of ‘births attended by skilled health staff’ is closer to the MDG target (50% by 2015) for the group of households engaged in agriculture (46%) in 2010. Although ‘access to safe drinking water’ for all occupation is closer to the MDG target, half of the households are still without an ‘electricity’ connection at national and regional scale. Moreover, the average electricity coverage for the households engaged in fishery (41%) and agriculture (34%) are below the national (55%) and regional (50%) average.
Interlinkages and connectivity within social–ecological system
All four types of provisioning services show negative linear relationships with water availability, which exhibit nonlinear relationships with fish production in ponds and natural habitats. Linear relationships are exhibited between sea level and ground water level, water salinity and ground water level and between water discharge and water salinity. However, nonlinear relationships exist between the indicators, such as water discharge and temperature, soil salinity and water salinity and soil salinity and rainfall. The negative relationship between sea level rise and ground water level, indicating the possibility of decreasing (actually increasing) ground water level for the sea level rise. Furthermore, a positive strong relationship is shown between water salinity and soil salinity. All these indicate the possibility of salinity increasing in both soil and water because of the sea level rise due to global warming. This salinity rise is likely to worsen because of the water flow reduction (e.g. Farakka dam), which exhibited negative relationship with salinity and ground water level.
Provisioning services are positively (strongly) linked with material wellbeing (GDP and income). In addition, positive links between production costs and production at the household level indicate the fact that higher crop production through intensive cultivation, shifts in technology and changes in crop varieties are associated with the higher production costs (Ali Citation1995; Husain et al. Citation2001; Hossain, Dearing et al. Citation2015; Hossain, Johnson, et al. Citation2015). Although the material wellbeing exhibits a positive relationship with provisioning services, some of the quality of life indicators such as access to ‘safe drinking water’ and improved ‘sanitation’ are not related to production at the household level. This could be because of the contribution of government (20% of annual budget), private and foreign aid (8500 million USD from 1981 to 2012) to improve HWB (e.g. safe drinking water, sanitation, etc.) (MoF Citation2014; UNDP Citation2014). This development programme could be also another reason that households with higher production levels have only a 22% higher chance of attending ‘births by skilled health staff’. In the fishery groups, there is no relationship observed between fish production and births by skilled health staff. Similarly, there is only a 17% higher chance of completing ‘primary education’ for those with higher crop production at households, even though ‘primary education’ is free in Bangladesh. This impact of free ‘education’ is evident for households engaged in fishery as these do not show any association between fish production and ‘primary education’ attainment. This difference between the households engaged in fishery and agriculture could be because of the fact that farmers often leave primary level ‘education’ early as they need to help in cultivation and the primary school system does not offer technical knowledge on agriculture (Alam Citation2008; The Daily Prothom alo Citation2014).
Our analyses support the overall MA (Citation2005) framework, which depicts that material wellbeing (basic materials for a good life) show a strong relationship with provisioning services, which in turn, show a weak relationship with the quality of life (security and health). But our analysis also confirms the ‘Environmentalist’s Paradox’ that HWB has increased despite the deterioration in ES (Raudsepp-Hearne et al. Citation2010). However, provisioning services are not the only important factor for HWB, which have also been substantially influenced by technology and capital investment (aid and subsidy).
System stability
In terms of the stability of the delta zone system, there are two major findings. The generally weak relationships between provisioning services and the slowly changing (and worsening) driving variables (e.g. temperature, rainfall, water discharges) may reflect the effect of ‘slow variables’ on system resilience that are not observable until a threshold is reached (Hossain, Johnson, et al. 2015). For example, the warming climate may have no negative effect on provisioning services until a threshold temperature is exceeded. In addition, the rising systemic connectivity between regulating and provisioning services since 1996 seems to reflect the homogenization of cultivation practices and their environmental impacts caused by trade globalization. Thus, deteriorating slow variables coupled to rising connectivity could be interpreted, as in other regions (e.g. Zhang et al. Citation2015) as indicating declining resilience and growing systemic instability. This means that the region could become more vulnerable to external shocks (e.g. floods, cyclones, crop disease) with the increased likelihood of volatility, failure or even the collapse in key components, such as rice production. In order to understand how these changes might be mitigated by alternative management strategies, it is useful to consider the structure of the system in terms of key interactions and feedback loops (Biggs et al. Citation2012).
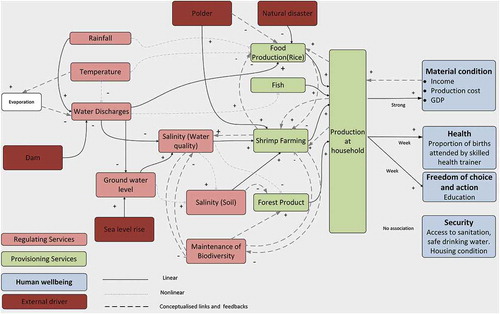
Systems model of the social–ecological system
Based on our analysis and evidence from previous work, we have developed a hypothesized systems diagram (). Although food production is not directly linked with quality of life, we include in the system diagram the role of GDP in contributing to the national and regional budgets that in turn improve HWB. Positive feedback loops are especially important to assess because they have the potential to grow and destabilize the social-ecological system (CBD Citation2010). In the case of our studied region, a major positive feedback loop exists between shrimp farming, mangrove forest and water salinity (Hossain, Dearing et al. Citation2015). Higher profits from shrimp industry increase the possibility of conversion of rice farms into shrimp farms (Swapan & Gavin Citation2011) with further destruction of the mangrove forest (Azad et al. Citation2009), but the higher water salinity that conversion and destruction causes makes the shift from rice to shrimp farms even more likely. Also, important is the long-term decrease in water discharge that is believed to increase the regional temperature (Adel Citation2002), potentially bringing forward the time when the critical temperature for crop production is exceeded.
Figure 7. Connectivity between regulating and provisioning services since 1978. Curve of PCA axis 1 and 2 combined data both for the provisioning services (different varieties of crops) and seasonal regulating services, such as water discharges, temperature, and rainfall and water salinity since 1967. Moreover, black line represents the connectivity between regulating and provisioning services using 10-year moving window and line in dot shows the connectivity between regulating and provisioning services using 20-year moving window.
Figure 8. Hypothesized system dynamic framework for the social–ecological system in south-west coastal Bangladesh.
The combination of strengthening positive feedback loops, declining resilience and the evidence for increasing production costs all suggest that the social-ecological system is in a vulnerable transition state as it adapts to rapidly changing conditions (Renaud et al. Citation2013). Management strategies certainly need to consider alternative land use and agriculture in high salinity and high temperature conditions. Future improvement of HWB may need to rely less on local ES and more on technological advances and capital investment if a ‘perfect storm’ of social-ecological failings (Dearing et al. Citation2012; Zhang et al. Citation2015) is to be avoided.
The system analysis is relevant to the ~60% of households that are engaged in agriculture and fishery. The study could be extended through surveys of shrimp and forest people that are not included within the HIES and more fully. The findings could be also be used to develop system dynamic modelling for identifying the impacts of alternative management strategies in adaptation planning for regional sustainability.
Conclusions
This study represents the first regional scale analysis of a complex social–ecological system in a coastal area of Bangladesh using the concept of ES and HWB. Analysis of this study has increased our understanding of the linear and nonlinear relationships, as well as the threshold points in the social–ecological system. Time series analysis of ES reveals that, in the past four decades, food provisioning services such as rice and fish production have sharply increased while, in contrast, regulating services are deteriorating. HWB is also improving in this region, in particular, since the 1980s. Households engaged in agriculture have progressed well in achieving the MDGs target in the case of ‘births attended by skilled health staff’; however, all households did not meet some other MDGs targets such as ‘education’, ‘sanitation’ and ‘electricity’. Linear and nonlinear relationships (e.g. water discharge and temperature), as well as threshold points (water availability and temperature, soil salinity and ground water level) are identified through a generalized additive model. Provisioning services are positively linked with material wellbeing (e.g. GDP and income). The development programme by the Government of Bangladesh and NGOs are the likely reasons why households with higher production have only 22% and 17% of higher chance of attending ‘births by skilled health staff’ and completing primary ‘education’, respectively, whereas there is no similar effect for fishery groups. Moreover, evidence such as rising connectedness and growing positive feedback loops, suggest that the social–ecological system is losing resilience with a higher probability of instability in the near future, particularly through the effects of higher salinity and temperatures. Our hypothesized systems dynamic framework based on the linear and nonlinear relationships helps to summarize the main interactions and to draw out key feedbacks within the system. We limited our analysis within the households engaged in agriculture and fishery, mainly because the HIES data do not cover the information for households engaged in shrimp and forestry. The findings of this study can serve as the basis for system dynamic modelling to identify how the social system will respond to changes in the ecological system. The methodology of this study can also be used for analysing and modelling social–ecological system in other data-poor areas for sustainable ecosystem management.
Supplementary_information-1182087.docx
Download MS Word (99.8 KB)Acknowledgements
Md. Sarwar Hossain acknowledges financial support provided by a joint NERC/ESRC interdisciplinary PhD studentship award (1223260) and the University of Southampton. John Dearing acknowledges financial support from the project ESPA-DELTAS ‘Assessing health, livelihoods, ecosystem services and poverty alleviation in populous deltas’ (NE/J002755/1) funded by the Ecosystem Services for Poverty Alleviation Programme (ESPA), and the project BF-DELTAS ‘Catalyzing action towards sustainability of deltaic systems with an integrated modelling framework for risk assessment’ funded by the Belmont Forum (award no. 1342944). The UK ESPA programme is funded by the Department for International Development (DFID), the Economic and Social Research Council (ESRC) and the Natural Environment Research Council (NERC). This is a Sustainability Science at Southampton publication.
Disclosure statement
No potential conflict of interest was reported by the authors.
Supplementary material
Supplemental data for this article can be accessed here.
Additional information
Funding
Related Research Data
References
- ADB. 2005. Summery environmental impact assessment: south west area integrated water resources planning and management project in Bangladesh. Manila: Asian Development Bank (ADB).
- Adel MM. 2002. Man-made climatic changes in the Ganges basin. Int J Climatol. 22:993–1016.
- Alam GM. 2008. Impact of the private universities on Bangladeshi education system: an investigation on education policy. Saarbrücker: VDM.
- Ali AMS. 1995. Population pressure, environmental constraints and agricultural change in Bangladesh: examples from three agro ecosystems. Agric Ecosyst Environ. 55:95–109.
- Ash J, Newth D. 2007. Optimizing complex networks for resilience against cascading failure. Phys A. 380:673–683.
- Azad A, Jensen K, Lin C. 2009. Coastal aquaculture development in Bangladesh: unsustainable and sustainable experiences. Environ Manage. 44:800–809.
- Azam MS, Imai KS. 2009. Vulnerability and poverty in Bangladesh. Manchester: Economics, School of Social Sciences University of Manchester. ( Working Paper No 141).
- BBS. 1997. Summary report of the household income and expenditure survey 1995-96. Dhaka: Bangladesh Bureau of Statistics (BBS).
- BBS. 2010. Report of the household income and expenditure survey 2010. Dhaka: Bangladesh Bureau of Statistics (BBS).
- BBS. 2011. Report of the household income and expenditure Survey 2010. Dhaka: Bangladesh Bureau of Statistics (BBS).
- Biggs R, Schlüter M, Biggs D, Bohensky EL, BurnSilver S, Cundill G, Dakos V, Daw TM, Evans LS, Kotschy K, et al. 2012. Toward principles for enhancing the resilience of ecosystem services. Annu Rev Environ Resour. 37:421–448.
- Billio M, Getmansky M, Lo AW, Pelizzon L. 2010. Econometric measure of systemic risk in the finance and insurance sectors. ( NBER Working Paper No. 16223). Cambridge (MA): National Bureau of Economic Research.
- Butler CD, Oluoch-Kosura W. 2006. Linking future ecosystem services and future human well-being. Ecol Soc. 11:30.
- Carpenter SR, Mooney HA, Agard J, Capistrano D, Defries RS, Díaz S, Dietz T, Duraiappah AK, Oteng-Yeboah A, Pereira HM, et al. 2009. Science for managing ecosystem services: beyond the millennium ecosystem assessment. Proc Natl Acad Sci U S A. 106:1305–1312.
- CBD. 2010. Global biodiversity outlook 3. Montreal: Convention on Biological Diversity (CBD); p. 94.
- Cervellati M, Sunde U. 2005. Human capital formation, life expectancy, and the process of development. Am Econ Rev. 95:1653–1672.
- Costanza R, d’Arge R, de Groot R, Farber S, Grasso M, Hannon B, Limburg K, Naeem S, O’Neill RV, Paruelo J, et al. 1997. The value of the world’s ecosystem services and natural capital. Nature. 387:253–260.
- CRA. 2006. Assessing the linkage between ecosystems, ecosystem services & poverty reduction. Kampala: Centre for Resource Analysis Limited (CRA) Final Report.
- Datta DK, Roy K, Hassan N. 2010. Shrimp culture: trend, consequences and sustainability in the south-western coastal region of Bangladesh. In: Ramanathan A, Bhattacharya P, Dittmar T, Prasad MBK, Neupane BR, editors. Management and sustainable development of coastal zone environments. Dordrecht: Springer; p. 227–244.
- De Groot RS, Fisher B, Christie M, Aronson J, Braat L, Haines-Young R, Gowdy J, Maltby E, Neuville A, Polasky S, et al. 2010. Integrating the ecological and economic dimensions in biodiversity and ecosystem service valuation. In: Kumar P, editor. The economics of ecosystems and biodiversity (TEEB): ecological and economic foundations. London: Earthscan.
- De Groot RS, Stuip MAM, Finlayson CM, Davidson N. 2006. Valuing wetlands: guidance for valuing the benefits derived from wetland ecosystem services. Montreal: Ramsar Convention Secretariat, Gland, Switzerland & Secretariat of the Convention on Biological Diversity. ( Ramsar Technical Report No. 3/CBD Technical Series No. 27).
- De Groot RS, Wilson MA, Boumans RMJ .2002. A typology for the classification, description and valuation of ecosystem functions, goods and services. Ecol Econ. 41:393–408. doi:10.1016/S0921-8009(02)00089-7
- Dearing JA, Bullock S, Costanza R, Dawson TP, Edwards ME, Poppy GM, Smith G. 2012. Navigating the perfect storm: research strategies for social-ecological systems in a rapidly evolving world. Environ Manag. 49:767–775.
- Dearing JA, Wang R, Zhang K, Dyke JG, Haberl H, Hossain MS, Langdon PG, Lenton TM, Raworth K, Brown S, et al. 2014. Safe and just operating spaces for regional social-ecological system. Glob Environ Change. 28:227–238.
- DHS. 2007. Bangladesh demographic and health survey 2007. Dhaka: National Institute of Population Research and Training, Mitra and Associates, and Macro International.
- Ecob R, Smith GD. 1999. Income and health: what is the nature of the relationship? Soc Sci Med. 48:693–705.
- FAO. 2006. Livelihood adaptation to climate variability and change in drought-prone areas of Bangladesh. Rome: Food and Agriculture Organization of United Nations.
- FAO-UNDP. 1998. Land resources appraisal of Bangladesh for agricultural development. Report prepared for the Government of the People’s Republic of Bangladesh by the Food and Agricultural Organization of the United Nations (FAO) in association with United Nations Development Programme (UNDP), Report # 2. Rome: Agroecological Regions of Bangladesh.
- Gouveia N, Hajat S, Armstrong B. 2003. Socioeconomic differentials in the temperature–mortality relationship in São Paulo, Brazil. Int J Epidemiol. 32:390–397.
- Green PJ, Silverman BW. 1994. Nonparametric regression and generalized linear models. London: Chapman and Hall.
- Guisan A, Thomas C, Edwards J, Hastie T. 2002. Generalized linear and generalized additive models in studies of species distributions: setting the scene. Ecol Modell. 157:89–100.
- Gylfason T. 2001. Natural resources, education, and economic development. Eur Econ Rev. 45:847–859.
- Hastie T, Tibshirani R. 1990. Generalized additive models. London: Chapman and Hall.
- Hodge T. 1997. Towards a conceptual framework for assessing progress toward sustainability. Soc Indic Res. 40:5–98.
- Hossain MS, Dearing JA, Rahman MM, Salehin M. 2015. Recent changes in ecosystem services and human wellbeing in the coastal zone. Reg Environ Chang. doi:10.1007/s10113-014-0748-z.
- Hossain MS, Hein L, Rip FI, Dearing JA. 2013. Integrating ecosystem services and climate change responses in coastal wetlands development plans for Bangladesh. Mitig Adapt Strateg Glob Change. doi:10.1007/s11027-013-9489-4.
- Hossain MS, Johnson FA, Dearing JA, Eigenbrod F. 2015. Recent trends of human wellbeing in the Bangladesh delta. Environ Dev. doi:10.1016/j.envdev.2015.09.008.
- Hossain MS, Roy K, Datta D. 2014. Spatial and temporal rainfall variability of rainfall over the south west coast of Bangladesh. Climate. 2:28–46.
- Husain AMM, Hossain M, Janaiah A. 2001. Hybrid rice adoption in Bangladesh: a socioeconomic assessment of farmers’ experiences. Research monograph series no. 18. Dhaka: BRAC and international rice research institute.
- Irz X, Lin L, Thirtle C, Wiggins S. 2001. Agricultural productivity growth and poverty alleviation. Dev Policy Rev. 19:449–466.
- Islam MB, Ali MY, Amin M, Zamon SM. 2011. Climatic variations: farming systems and livelihoods in the high barind tract and coastal areas of Bangladesh. In: Lal R, Sivakumar MVK, Faiz SMA, Rahman AHMM, Islam KR, editors. Climate change and food security in South Asia. Berlin: Springer; p. 477–488.
- Islam MR. 2006. Managing diverse land uses in coastal Bangladesh: institutional approaches. In: Hoanh CT, Tuong TP, Gowing JW, Hardy B, editors. Environment and livelihoods in tropical coastal zones. Manila: CAB International and International Rice Research Institute (IRRI).
- Islam MS, Haque M. 2004. The mangrove-based coastal and nearshore fisheries of Bangladesh: ecology, exploitation and management. Rev Biol Fish. 14:153–180.
- Kan H, London SJ, Chen H, Song G, Chen G, Jiang L, Zhao N, Zhang Y, Chen B. 2007. Diurnal temperature range and daily mortality in Shanghai, China. Environ Res. 103:424–431.
- Kim Y, Kim H, Kim DS. 2011. Association between daily environmental temperature and suicide mortality in Korea (2001–2005). Psychiatry Res. 186:390–396.
- Koch EW, Barbier EB, Silliman BR, Reed DJ, Perillo GM, Hacker SD, Granek EF, Primavera JH, Muthiga N, Polasky S, et al. 2009. Non-linearity in ecosystem services: temporal and spatial variability in coastal protection. Front Ecol Environ. 7:29–37. doi:10.1890/080126
- MA. 2005. Ecosystems and human well-being: a framework for assessment. Millennium ecosystem assessment. Washington (DC): Island Press.
- Menard S. 1995. Applied logistic regression analysis. Series: Quantitative Applications in the Social Sciences, No. 106. Boulder, CO: University of Colorado.
- Mirza MQ. 1998. Diversion of the Ganges water at Farakka and its effects on salinity in Bangladesh. Environ Manag. 22:711–722.
- MoF. 2014. Ministry of Finance (MoF). Available from: http://www.mof.gov.bd/en/.
- OECD. 2013. OECD guidelines on measuring subjective well-being. Paris: OECD.
- Petz K, Minca EL, Werners SE, Leemans R. 2012. Managing the current and future supply of ecosystem services in the Hungarian and Romanian Tisza river basin. Reg Environ Change. 12:689–700.
- Rahman A, Rabbani G, Muzammil M, Alam M, Thapa S, Rakshit R, Inagaki H. 2010. Scoping assessment on climate change adaptation in Bangladesh. Thailand: AIT-UNEP PRC, AP.
- Raudsepp-Hearne C, Peterson GD, Tengö M, Bennett EM, Holland T, Benessaiah K, MacDonald GK, Pfeifer L. 2010. Untangling the environmentalist’s paradox: why is human well-being increasing as ecosystem services degrade? BioScience. 60:576–589.
- Renaud FG, Syvitski JPM, Sebesvari Z, Werners SE, Kremer H, Kuenzer C, Ramesh R, Jeuken A, Friedrich A. 2013. Tipping from the Holocene to the anthropocene: how threatened are major world deltas? Curr Opin Environ Sustain. 5:644–654.
- Rounsevell MDA, Dawson TP, Harrison PA. 2010. A conceptual framework to assess the effects of environmental change on ecosystem services. Biodivers Conserv. 19:2823–2842.
- Santos-Martın F, Martı´n-Lo´pez1 B, Garcı´a-Llorente M, Aguado M, Benayas J, Montes C. 2013. Unraveling the relationships between ecosystems and human wellbeing in Spain. PLoS One. 8:1–12.
- Sarwar MGM. 2005. Impacts of sea level rise on the coastal zone of Bangladesh [ MSc dissertation]. Sweden: Programme in environmental science, Lund University.
- Scheffer M, Carpenter SR, Lenton TM, Bascompte J, Brock W, Dakos V, Koppel JVD, Leemput IA, Levin SA, Nes EH, et al. 2012. Anticipating critical transitions. Science. 338:344–348.
- Scherr SJ. 2000. A downward spiral? Research evidence on the relationship between poverty and natural resource degradation. Food Policy. 25:479–498.
- Shamsuddoha M, Roberts E, Hasemann A, Roddick S. 2013. Establishing links between disaster risk reduction and climate change adaptation in the context of loss and damage: policies and approaches in Bangladesh. Dhaka: International Centre for Climate Change and Development (ICCCAD).
- Swapan MSH, Gavin M. 2011. A desert in the delta: participatory assessment of changing livelihoods induced by commercial shrimp farming in Southwest Bangladesh. Ocean Coast Manag. 54:45–54.
- Szabo S, Hossain MS, Adger WN, Mathews Z, Sayem A, Lazar AN, Ahmed S. 2015. Soil salinity, household wealth and food insecurity in tropical deltas: evidence from south-west coast of Bangladesh. Sustain Sci. doi:10.1007/s11625-015-0337-1.
- The Daily Prothom alo. 2014. Highest dropout in primary education in Haor areas. Available from: http://en.prothom-alo.com/bangladesh/news/45336/Highest-dropout-in-primary-education-in-Haor-areas.
- Thomas WY, Mitchell ND. 1991. Generalized additive models in plant ecology. J Vegetation Sci. 2:587–602.
- UNDP. 2014. Millennium Development Goals (MDGs). United Nations Development Program in Bangladesh; [cited 2015 Oct20]. Available from: http://www.bd.undp.org/content/bangladesh/en/home/mdgoverview/
- WRI. 2013. Ecosystem service indicators database. Washington (DC): Word Resource Institute; [cited 2015 Mar 20]. Available from: http://www.esindicators.org/indicator_details/1132.
- Zhang K, Dearing JA, Dawson TP, Dong X, Yang X, Zhang W. 2015. Poverty alleviation strategies in eastern China lead to critical ecological dynamics. Sci Total Environ. 506-507:164–181.